0781
CEST MRI detection of Deoxycytidine Kinase activity using natural deoxycytidine1Radiology, Johns Hopkins University, Baltimore, MD, United States, 2F.M. Kirby Research Center for Functional Brain Imaging, Kennedy Krieger Institute, Baltimore, MD, United States
Synopsis
To assess the activity of deoxycytidine kinase (
Introduction
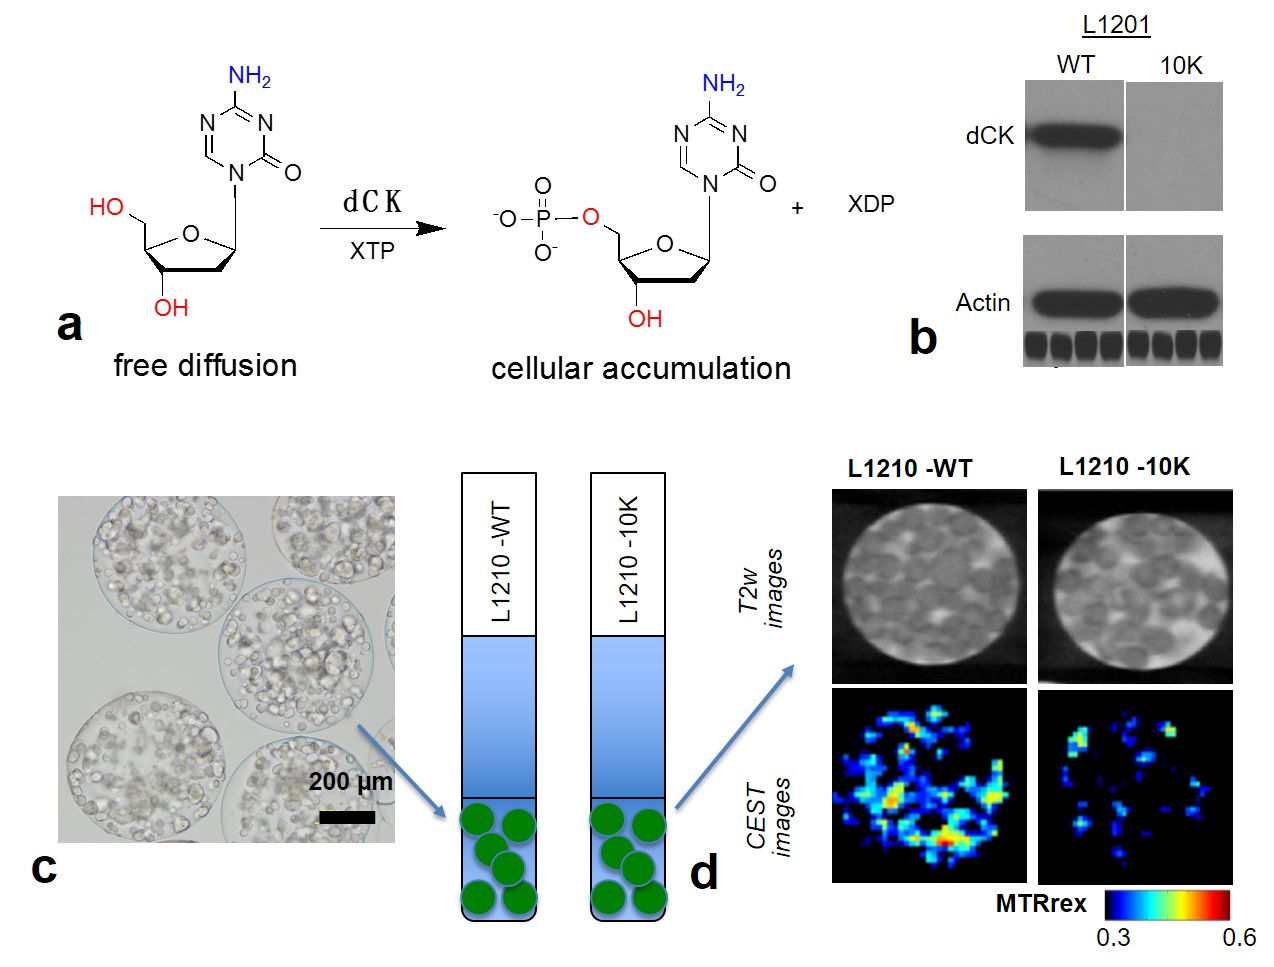
Deoxycytidine kinase (dCK) is an enzyme that predominantly phosphorylates deoxycytidine (dC) into deoxycytidine monophosphate (dCMP, Figure 1a), which will be consequently converted to deoxycytidine triphosphate (dCTP). dCK has found to be essential for many nucleoside-based chemotherapeutic agents including gemcitabine (dFdC) and cytosine arabinoside (ara-C) by converting these drugs into their active forms1,2. Therefore, an imaging method that can non-invasively assess the (spatial and temporal) activity of dCK is of great clinical interest. In this context, 19F MRI and PET methods3,4 have been developed, but no clinical studies have been reported yet. Based on our previous studies5,6, we hypothesized that CEST MRI can be used to detect the dCK activity by monitoring the intracellular accumulation of its natural substrate dC, which can be detected directly by CEST MRI without any chemical labeling7.Methods
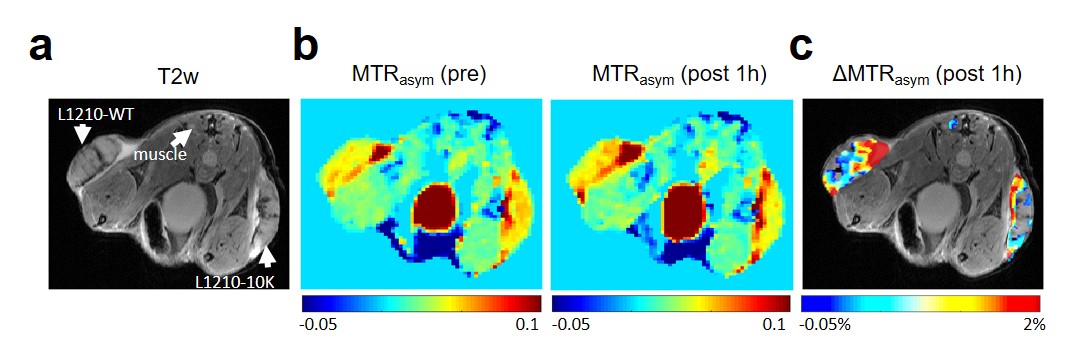
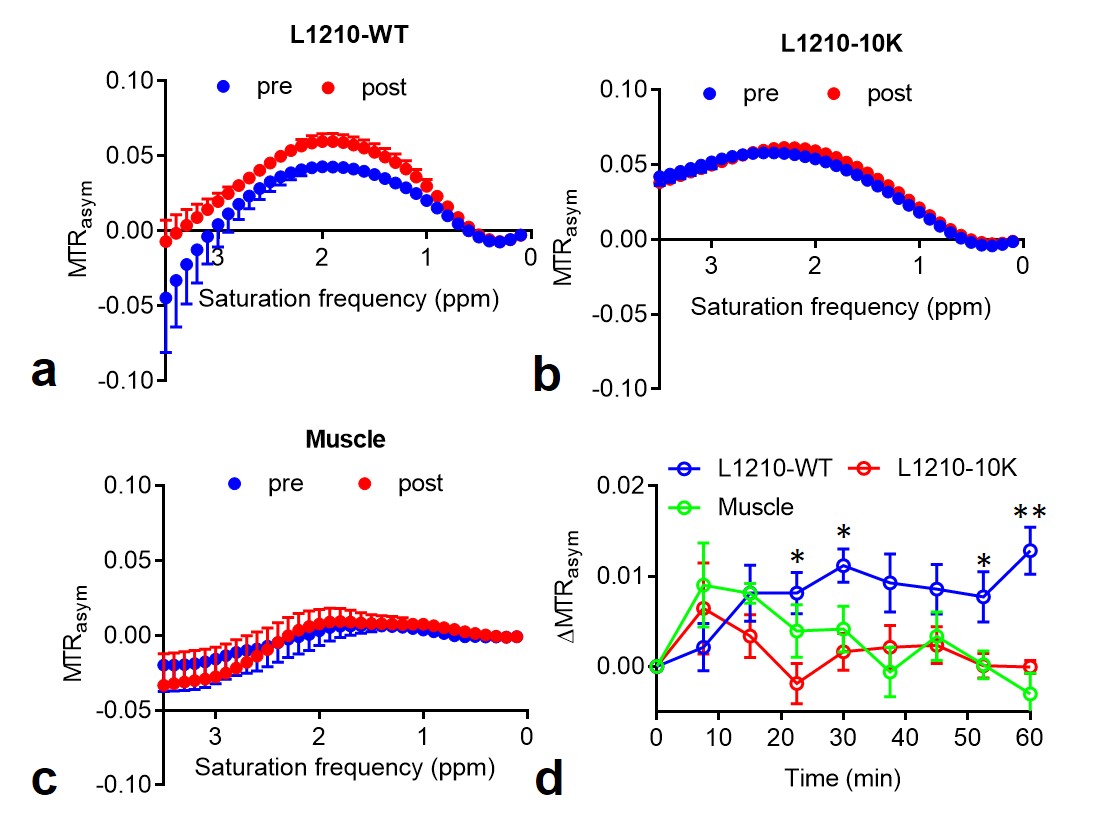
Both dCK-expressing L1210-WT and dCK-deficient L1210-10K murine leukemic cell lines were gifts from Dr. Radu at UCLA4. Cells containing microcapsules were prepared as previously reported5. In vitro CEST MRI was performed at 37 °C on a 9.4 T vertical bore Bruker MRI scanner using a previously reported procedure8 with CEST parameters: B1 =3.6 μT, Tsat= 3 sec, offsets ranging from -5 ppm to 5 ppm (step=0.2 ppm). The B0 inhomogeneities were measured and corrected using the WASSR method9. Two million L1210-WT and L1210-10K cells, suspended in 200 µL PBS, were injected subcutaneously in the left and right flank, respectively, of the same animals. Approximately 7-10 days later, mice were scanned using an 11.7 T Bruker Biospec horizontal scanner equipped with equipped with a mouse brain surface array RF coil (receiver) and a 72 mm volume coil (transmitter). CEST MRI was performed before and after the injection of 200 µL dC saline solution (2 g/kg b.w.), a dose that was used previously for 3‐O‐methyl‐D‐glucose10. The CEST parameters were: B1= 3.6 µT, Tsat= 3 s, Δω = -4 to +4 ppm with a step size of 0.2 ppm. MTRasym=(S-Δω – S+Δω)/S0 was computed after B0 correction and ΔMTRasym at each time point was calculated by MTRasym (t)- MTRasym (pre). Tumor ROIs were chosen for the whole tumor regions.Results
The level of dCK-expression was confirmed using western plot (Figure 1b). As shown in Figure 1c, incubation with 5 mM dC resulted in a markedly increased CEST signal in dCK (+) L1210-WT but not in dCK(-) L1210-10K cells, confirming the ability of CEST MRI to detect intracellularly accumulated dC and its phosphorylated form dCTP. Our in vivo results showed that, at one hour after the injection of dC, dCK (+) L1210-WT tumors showed a strongly elevated CEST signal, whereas dCK(-) L1210-10K tumors showed no CEST enhancement (Figure 2), attributed to the selective accumulation of dC in L1210-WT tumor cells. The same trend was found in all four animals studied, as revealed by the mean MTRasym plots (Figures 3a and 3b), which clearly showed a significant increase in CEST signal in the L1210-WT tumors but not in the L1210-10K tumors at 1 hour after injection. In particular, dCK(+) tumors exhibited an average of 1.3±0.3% signal increase as quantified by MTRasym(2ppm) at 1 h after injection (P=0.026, paired Student t test, n=4), whereas dCK(-) tumors showed negligible CEST signal change (P=0.11, paired Student t test, n=4). The dynamic CEST signals in the two types of tumors are shown in Figure 3c, revealing distinct pharmacokinetic patterns. Because muscle is known for lacking dCK activity and therefore can be used an internal negative control, we also assessed the dynamic CEST changes in the muscle, which showed a similar pharmacokinetic pattern as the dCK(-) tumor (Figure 3d).Conclusion
We developed a new MRI approach for detecting dCK enzyme activity by using its natural substrate dC as the CEST MRI contrast agent without any additional chemical labeling. We successfully used this approach to differentiate dCK(+) and dCK(-) tumors in a mouse leukemia model. Our study implies that this new “natural” approach has potential to be used to stratify tumors based on their dCK activity and to predict the tumor response to nucleotide-based chemotherapies such as gemcitabine and ara-C.Acknowledgements
Supported by NIH grants R03EB021573, R01CA211087 and R21CA215860.References
1. Sebastiani, V., et al. Immunohistochemical and genetic evaluation of deoxycytidine kinase in pancreatic cancer: relationship to molecular mechanisms of gemcitabine resistance and survival. Clin. Cancer Res. 12, 2492-2497 (2006).
2. Jordheim, L.P. & Dumontet, C. Review of recent studies on resistance to cytotoxic deoxynucleoside analogues. Biochim. Biophys. Acta 1776, 138-159 (2007).
3. Cron, G.O., et al. 19F NMR in vivo spectroscopy reflects the effectiveness of perfusion‐enhancing vascular modifiers for improving gemcitabine chemotherapy. Magn. Reson. Med. 59, 19-27 (2008).
4. Laing, R.E., et al. Noninvasive prediction of tumor responses to gemcitabine using positron emission tomography. Proceedings of the National Academy of Sciences of the United States of America 106, 2847-2852 (2009).
5. Liu, G., et al. Monitoring enzyme activity using a diamagnetic chemical exchange saturation transfer magnetic resonance imaging contrast agent. J. Am. Chem. Soc. 133, 16326-16329 (2011).
6. Bar-Shir, A., et al. Transforming thymidine into a magnetic resonance imaging probe for monitoring gene expression. J. Am. Chem. Soc. 135, 1617-1624 (2013).
7. Li, Y., et al. CEST theranostics: label-free MR imaging of anticancer drugs. Oncotarget 7, 6369-6378 (2016).
8. Liu, G., et al. In vivo multicolor molecular MR imaging using diamagnetic chemical exchange saturation transfer liposomes. Magn. Reson. Med. 67, 1106-1113 (2012).
9. Ryoo, D., et al. Detection and Quantification of Hydrogen Peroxide in Aqueous Solutions Using Chemical Exchange Saturation Transfer. Anal Chem 89, 7758-7764 (2017).
10. Rivlin, M. & Navon, G. CEST MRI of 3‐O‐methyl‐D‐glucose on different breast cancer models. Magn. Reson. Med. (2017).
Figures