0780
Hyperpolarized 13C β-hydroxybutyrate/acetoacetate as a biomarker for non-invasive monitoring of NAD+/NADH status in glioblastoma1Department of Radiology and Biomedical Imaging, University of California San Francisco, San Francisco, CA, United States, 2Department of Physical Therapy and Rehabilitation Science, University of California San Francisco, San Francisco, CA, United States
Synopsis
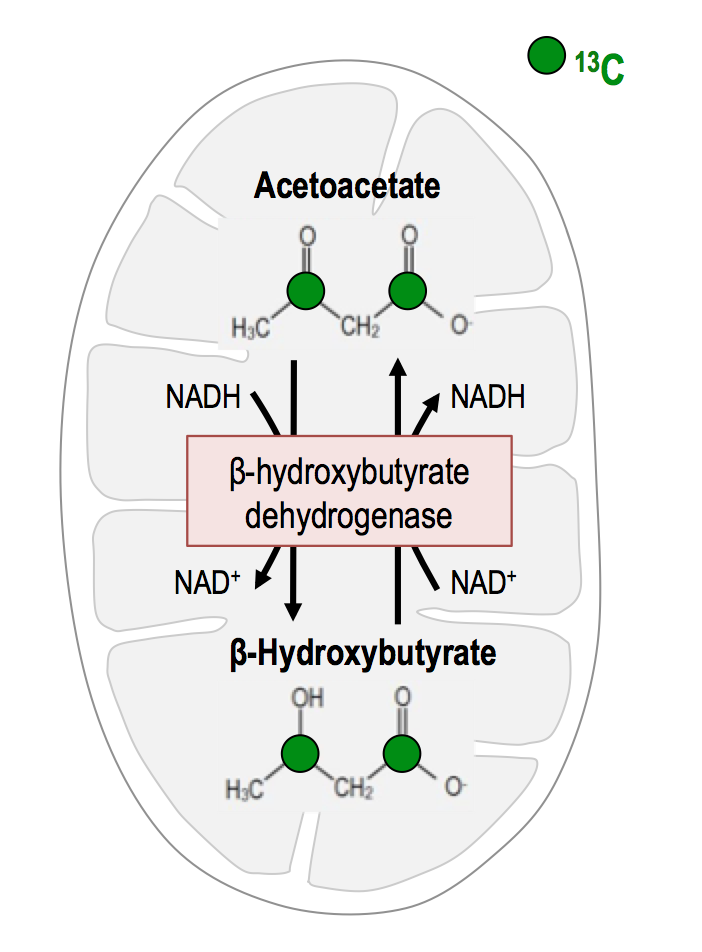
Conversion of acetoacetate (AcAc) to β-hydroxybutyrate (β-HB) by the mitochondrial enzyme β-hydroxybutyrate dehydrogenase depends upon NADH availability. Previous studies have shown the potential of β-HB-to-AcAc ratio to reflect the redox state in rat hearts and lymphoma cells. Here, we assessed the value of HP [1,3-13C]-AcAc in brain. We demonstrated the potential to probe AcAc to β-HB conversion in normal mice and mice with glioblastoma. Significantly higher levels of [1-13C]-β-AcAc and [1-13C]-β-HB were observed in tumor-bearing mice compared to control mice. Consistent with lower levels of NADH measured in tumors, the [1-13C]-β-HB-to-[1-13C]-β-AcAc ratio trended towards a decrease compared to normal brain.
Introduction
Deregulation in NAD+/NADH levels is associated with increased cell division and elevated reactive oxygen species in rapidly proliferating cancer cells[1,2]. Acetoacetate (AcAc) conversion to β-hydroxybutyrate (β-HB) by the mitochondrial enzyme β-hydroxybutyrate dehydrogenase depends upon NADH availability (Fig.1)[3,4]. Therefore, the β-HB-to-AcAc ratio is expected to reflect redox, and previous studies have shown the potential of hyperpolarized (HP) AcAc in rat hearts and lymphoma cells[3,4,5]. However, this probe has not been previously investigated in brain. The goal of our study was therefore to assess the value of HP [1,3-13C]-AcAc in normal mice and mice with glioblastoma (GBM).Material and Methods
Hyperpolarized [1,3-13C]-AcAc [1,3-13C]-AcAc was produced from [1,3-13C]-ethyl-acetoacetate (Sigma) as described previously[3] and was resuspended in a 1:3 DMSO:water solution, leading to a final concentration of ~2.5M. Samples for polarization were mixed with OX-63 (15mM) and gadolinium (1mM). After polarization and dissolution, HP [1,3-13C]-AcAc was injected into an NMR tube and single-pulse 13C spectra acquired using an 11.7T INOVA spectrometer (Agilent Technologies) to evaluate T1 and percent polarization (n=2). Spectra were quantified by peak integration using MestRenova (Mestrelab).
Mitochondria studies Following dissolution, 2mL of HP [1,3-13C]-AcAc was injected into an NMR tube containing 1mL of cow heart mitochondria (5.5mg/L, Abcam) and 2mM NADH. Dynamic sets of HP 13C spectra (TR=3s/FA=13deg) were acquired on an 11.7T INOVA spectrometer. High-resolution proton-decoupled thermal 13C spectra were acquired on an 11.7T Bruker spectrometer equipped with a triple resonance cryoprobe. Spectra were analyzed as above (n=2).
In vivo studies 12 female athymic nu/nu mice were used. Tumors were implanted by intracranial injection of 3x10⁵ cells. 3 mice were implanted with IDH1 wild-type U87 (U87wt) GBM cells and 4 with U87 cells engineered to express mutant IDH1 (U87mut). 4 mice served as tumor-free controls. Studies were performed on a 14.1T vertical MR system (Agilent Technologies) equipped with dual-tune 1H-13C coil. Axial T2-weighted images were used to evaluate tumor size and were acquired using a multi-slice spin-echo sequence (TE=20ms/TR=1200ms/in-plane resolution=0.12x0.12mm2/slice thickness=1.5mm/NA=2). For HP studies, 500μL of [1,3-13C]-AcAc was injected in the tail-vein over 12s. 10s after beginning of the injection, dynamic 13C MR spectra were acquired from a 10mm slab (TR=4s/FA=20deg/NT=10) followed by a final 90deg acquisition. The dynamic data were summed and analyzed by measuring the [1-13C]-β-HB and [1-13C]-AcAc signal-to-noise ratios using MestRenova. The 90deg acquisition was analyzed in the same way. At end-point, all mice were euthanized. Tumor and normal brain tissues were clamp frozen to quantify NAD+ and NADH by colorimetric assay (BioVision).
Statistical analysis All results are expressed as mean±s.d. Paired and unpaired two-tailed Student’s t-test were used.
Results and Discussion
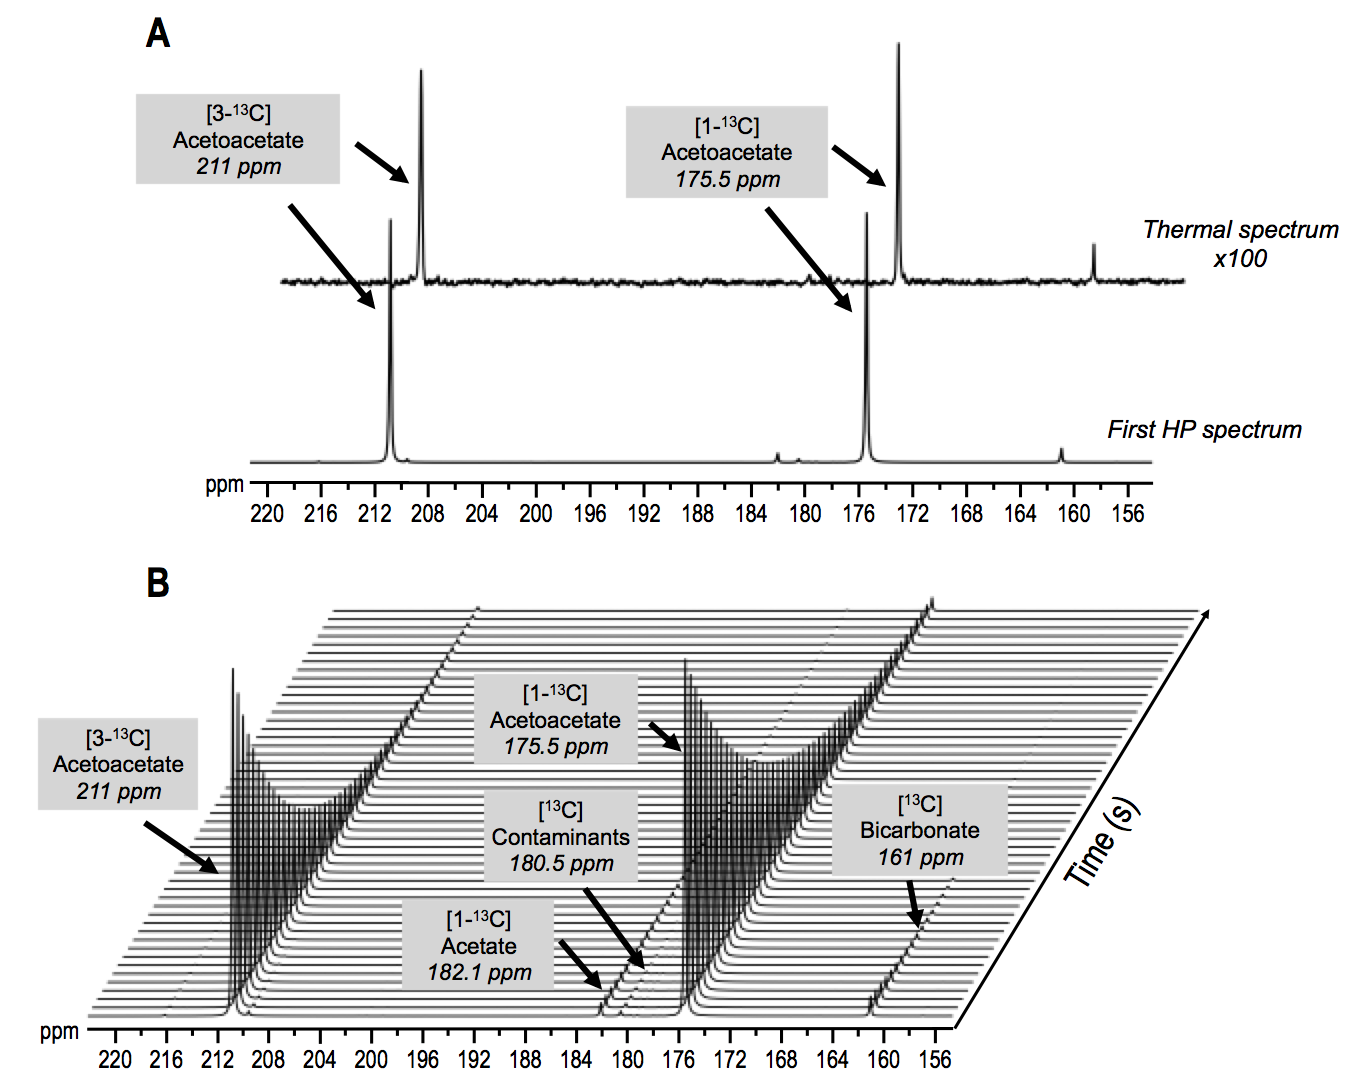
Characterization Following polarization, resonances of HP [1-13C]-AcAc and [3-13C]-AcAc were detected at 175.5ppm and 211ppm with an enhancement of 21±3% and 19±2% when compared to thermal spectrum (Fig.2A). Additional resonances detected at 182.1, 180.5 and 161ppm were attributed to the natural abundance of HP [1-13C]-acetate, an unknown contaminant and [13C]-bicarbonate. Similar to a previous report[6], the T1 of HP [1-13C]-AcAc and [3-13C]-AcAc were 48±4s and 35±2s (Fig.2B).
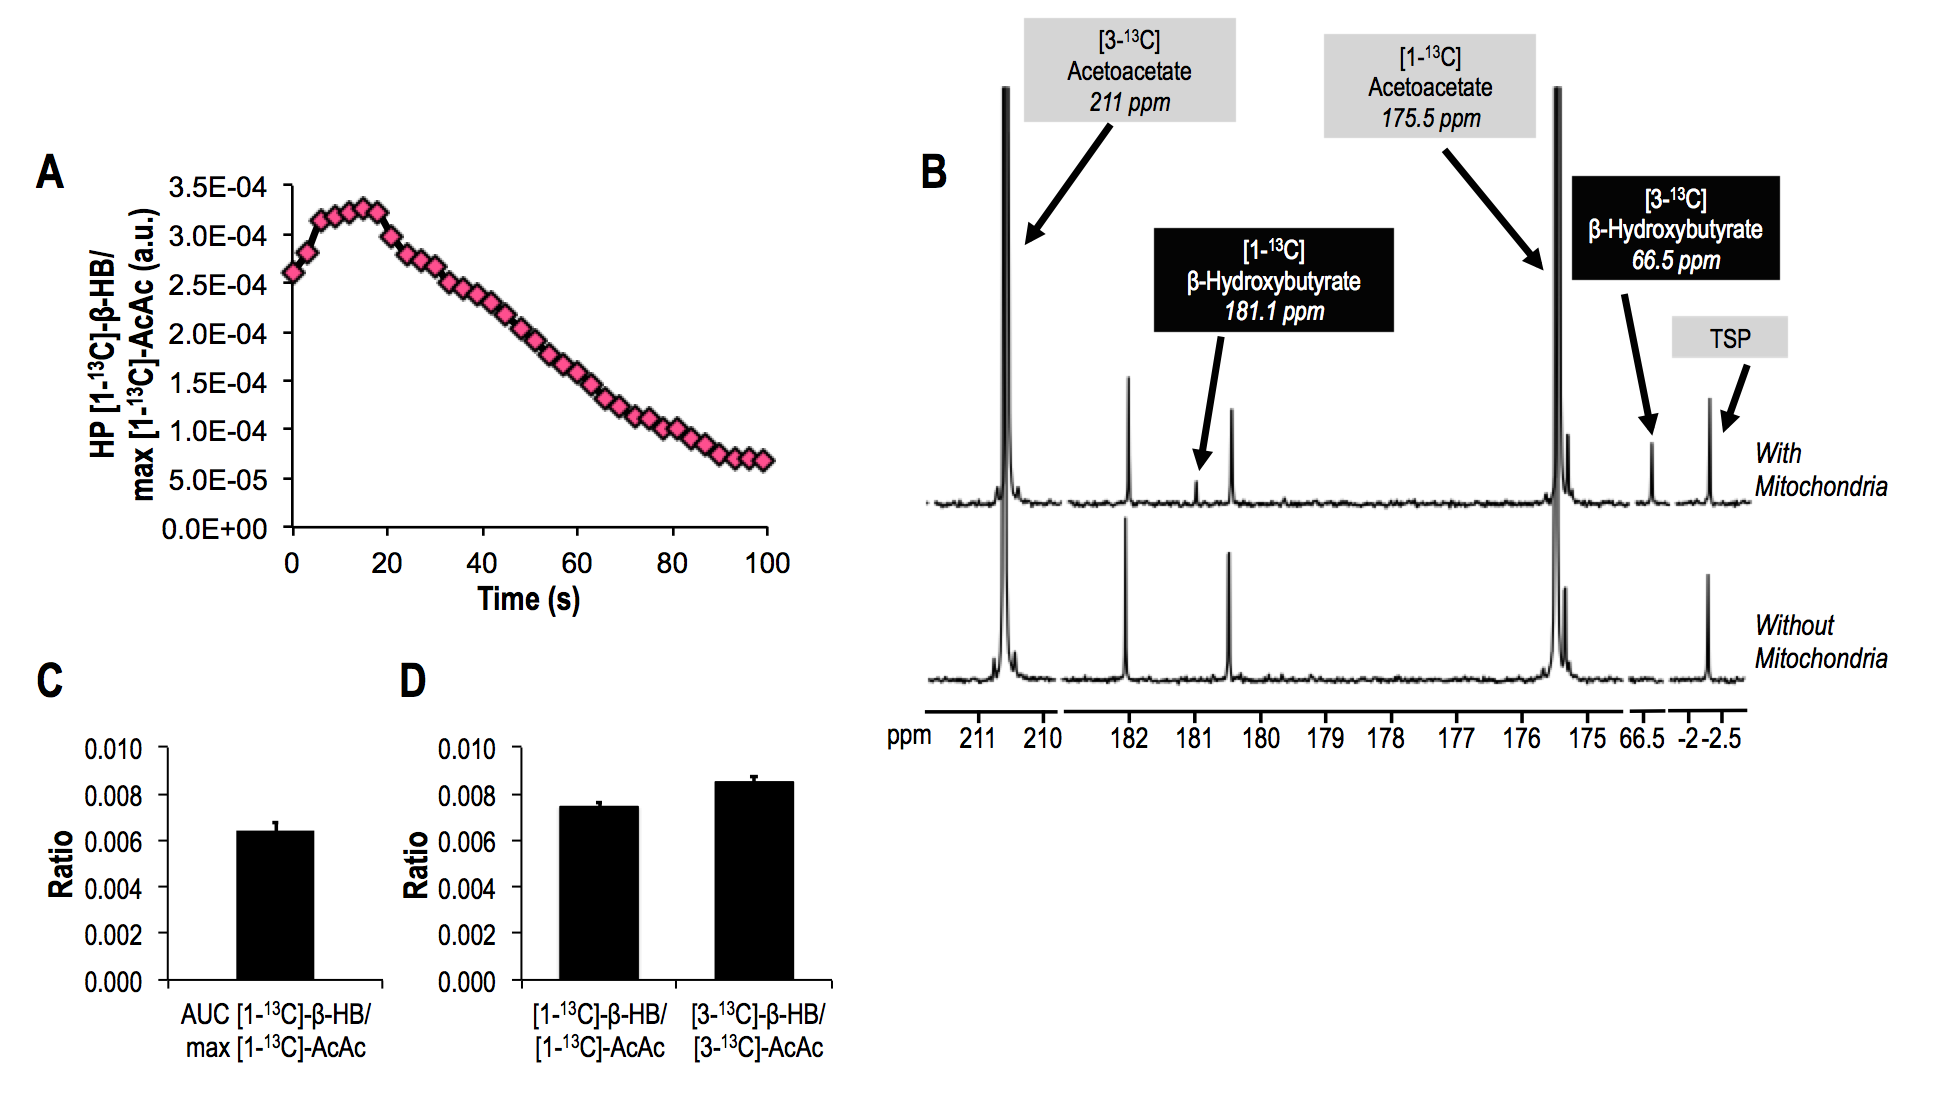
Mitochondria studies Injection of HP [1,3-13C]-AcAc to a suspension of mitochondria resulted in a detectable build-up of HP [1-13C]-β-HB at 181.1ppm (Fig.3A/3C), confirming our ability to monitor the conversion of [1-13C]-AcAc to [1-13C]-β-HB. Signal from [3-13C]-β-HB was also detected but rapidly disappeared, probably due to its shorter T1. High-resolution thermal 13C acquisitions confirmed [1-13C]-β-HB and [3-13C]-β-HB production (Fig.3B/3D).
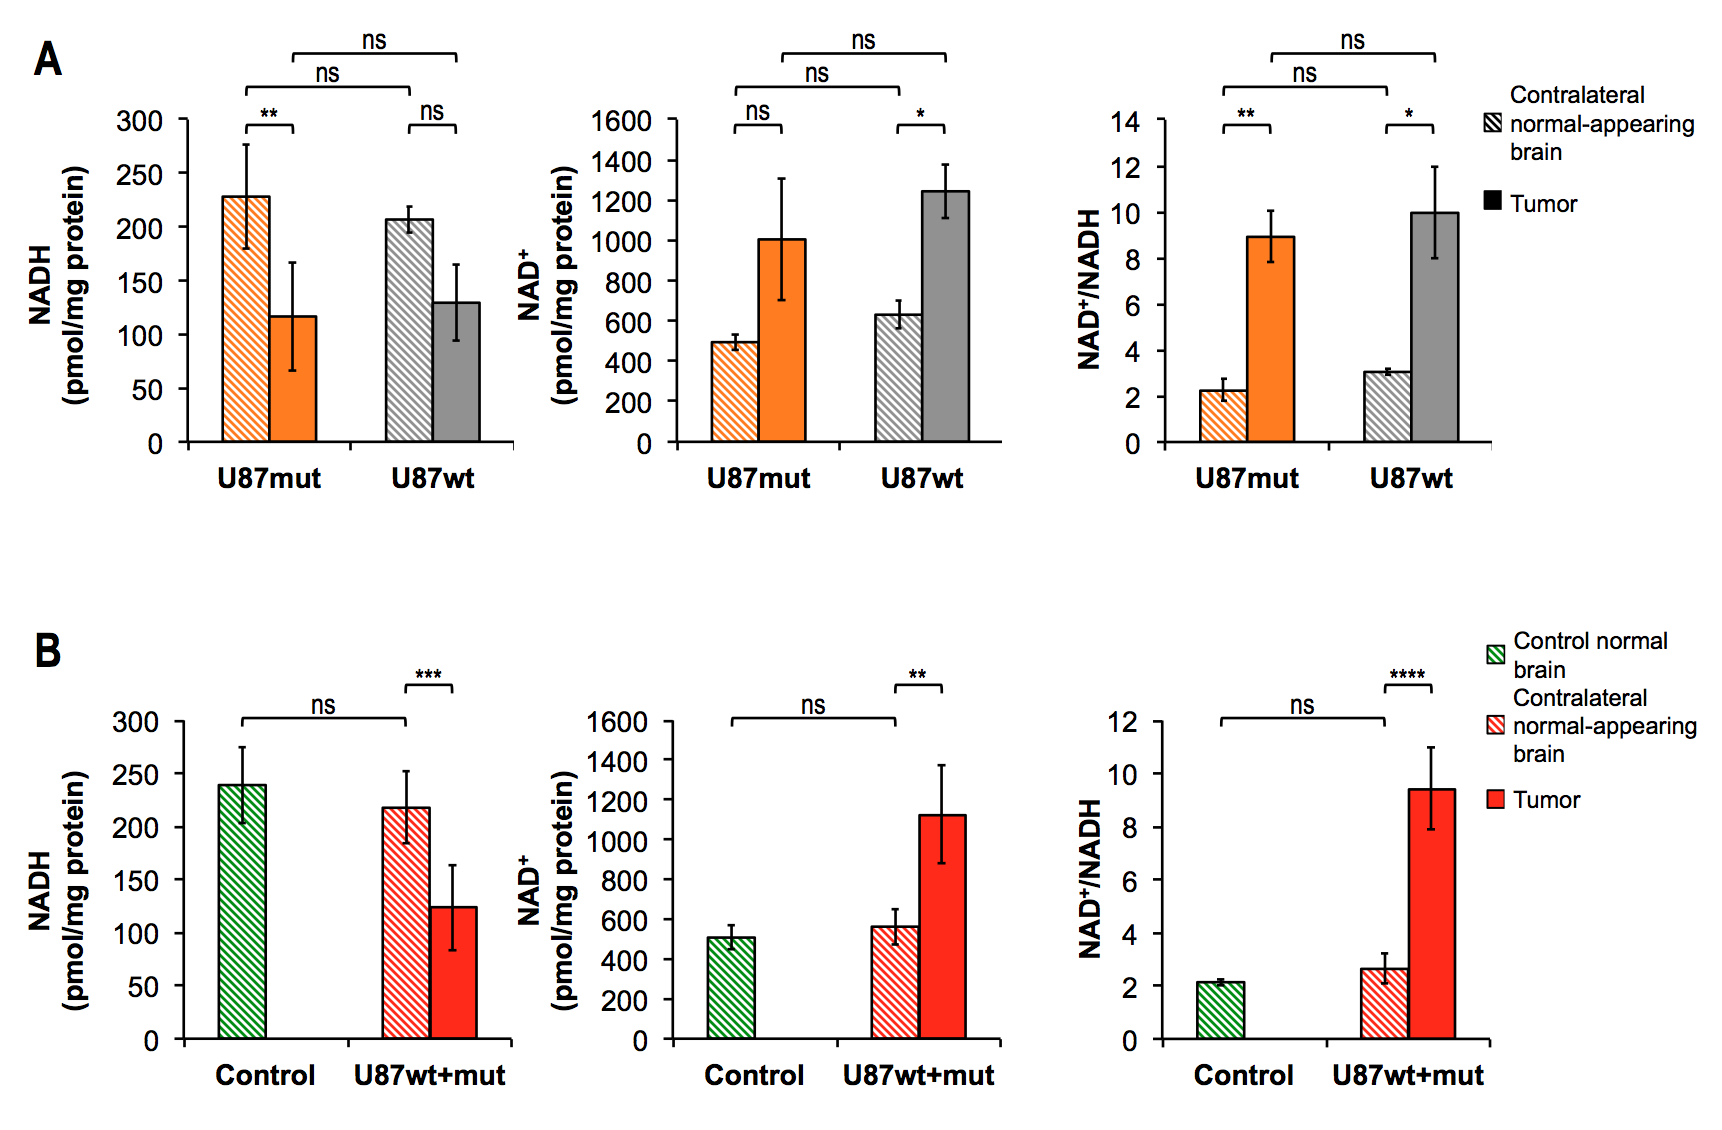
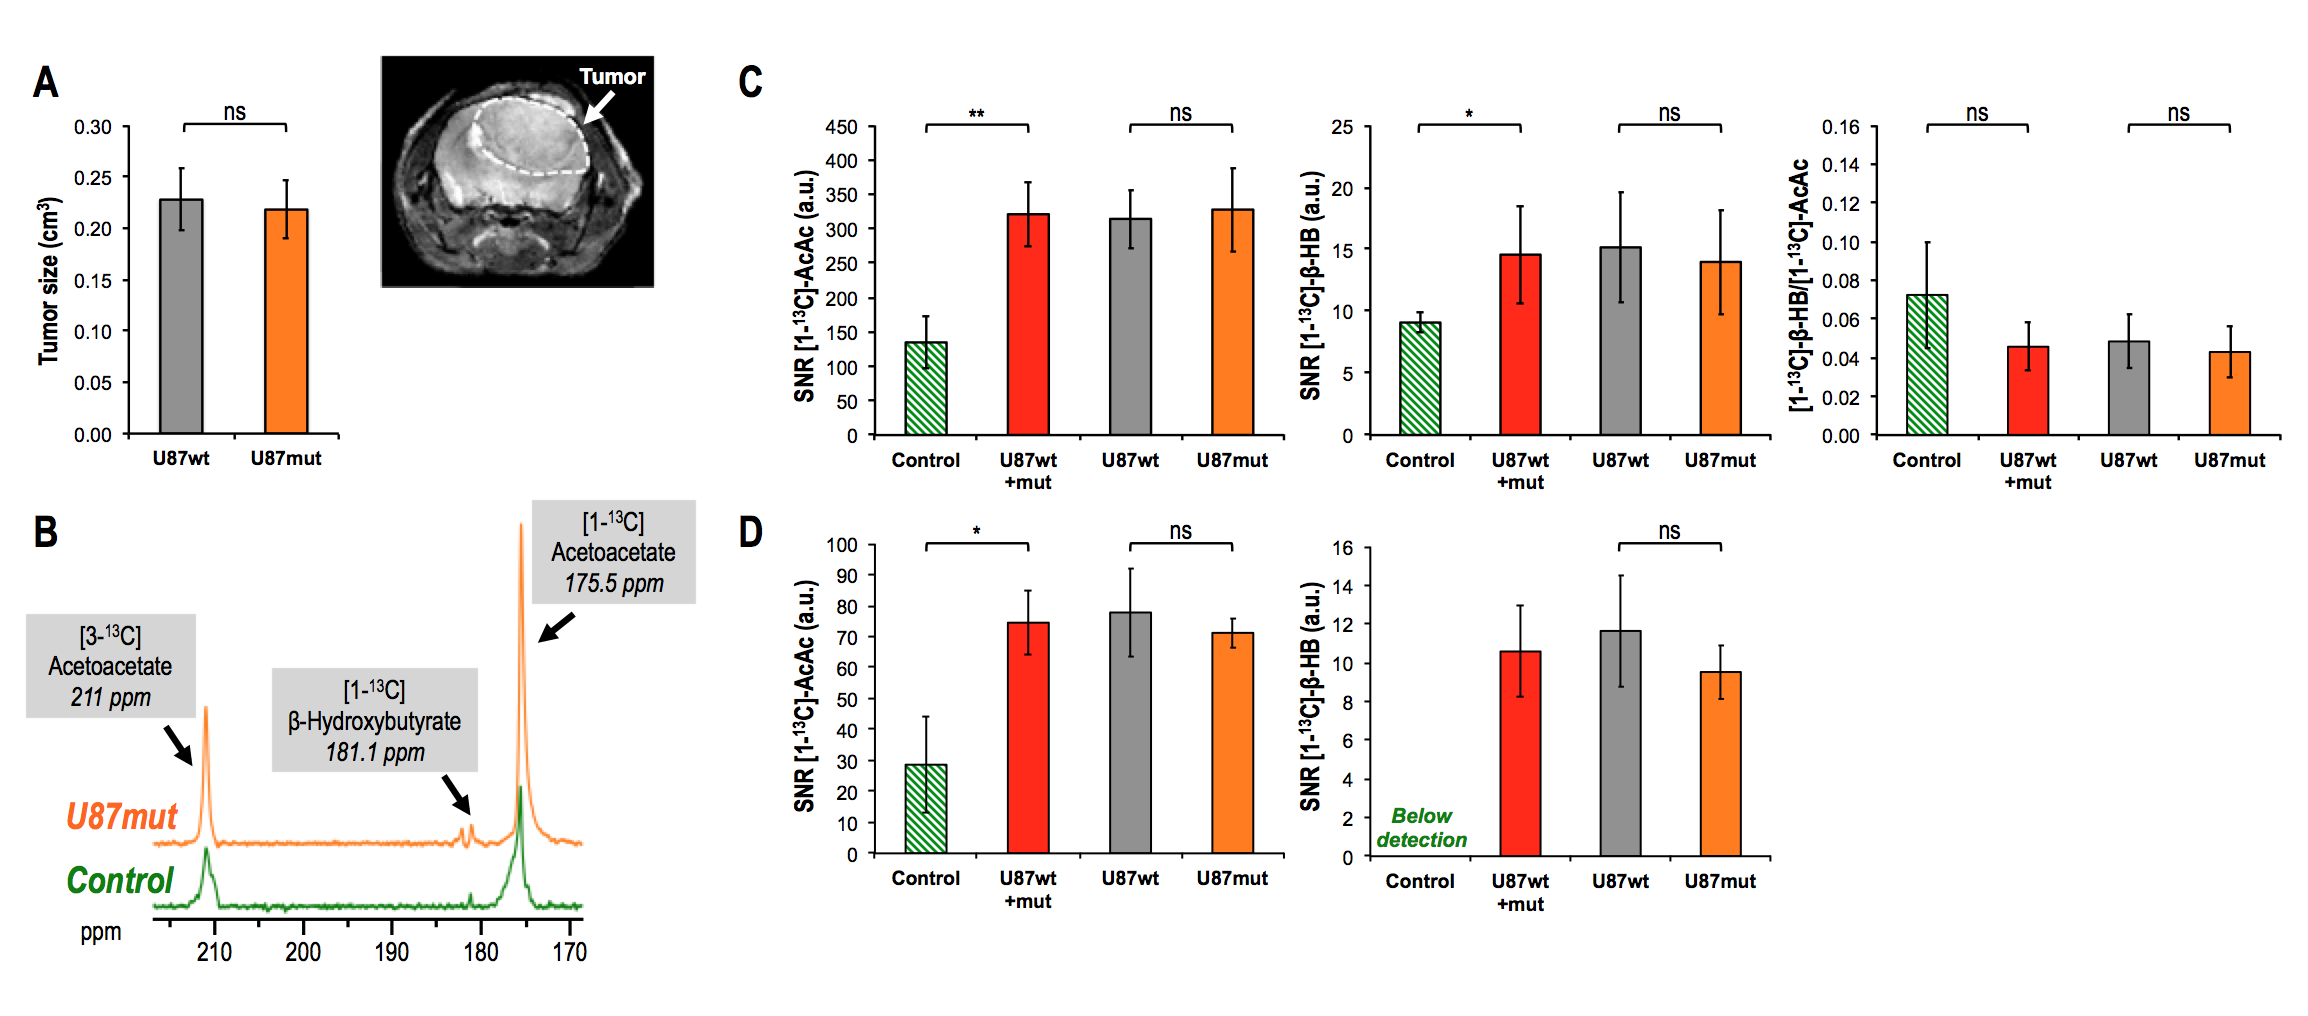
GBM studies Quantification of NADH and NAD+ showed no significant differences between U87wt and U87mut tumors (Fig.4A). However, NADH was significantly lower in U87wt+mut tumor tissues compared to normal brain from control mice or contra-lateral normal-appearing brain in U87wt+mut tumor-bearing mice (Fig.4B). HP acquisitions were performed on tumor-bearing animals when tumors reached a volume of ~0.22cm3 (Fig.5A). Spectra from dynamic acquisitions or 90deg acquisitions showed no difference in [1-13C]-β-HB, [1-13C]-AcAc or [1-13C]-β-HB-to-[1-13C]-AcAc ratio between U87wt and U87mut as expected by their comparable NADH and NAD+ levels (Fig.5B/C/D). When comparing control and tumor-bearing mice, HP [1-13C]-AcAc and [1-13C]-β-HB were significantly lower in controls. Consistent with lower levels of NADH in tumors, [1-13C]-β-HB-to-[1-13C]-β-AcAc ratio trended towards a decrease compared to normal brain, but the difference was not statistically significant (the ratio was not quantified in the 90deg acquisition because [1-13C]-β-HB was below detection, Fig.5C/D).
Conclusion
Further studies are needed to determine whether the higher levels of HP [1-13C]-β-HB detected in our tumor-bearing mice are simply due to the higher delivery of [1-13C]-AcAc to the more permeable tumor tissue, or whether they are associated with differences in NADH. Nonetheless, this study demonstrates for the first time the feasibility of using [1,3-13C]-acetoacetate to monitor acetoacetate to β-hydroxybutyrate conversion in the brain.Acknowledgements
Work supported by NIH R01CA172845, NIH R01CA1972254, UCSF Brain Tumor Center Loglio Collective, UCSF NICO project, ABTA BRF1700006 and center grant P41EB013598.References
[1] Salazar-Ramiro et al., Frontiers in Immunology 2016, [2] DeBerardinis et al., Cell Metabolism 2008 [3] Lau A.Z. et al., ISMRM 2015, [4] Chen W. et al., ISMRM 2016, [5] Timm K.N. et al., Clinical Cancer Research 2016, [6] Jensen P.R. et al., International Journal of Cancer 2015Figures