0779
Quantitative 3D Deuterium MRS Imaging of Glucose Metabolisms in the Rat Brain1Center for Magnetic Resonance Research, Department of Radiology, University of Minnesota, Minneapolis, MN, United States
Synopsis
Assessment of metabolic coupling between glycolysis and oxidation is crucial for understanding neuroenergetics. Based on our recently developed in vivo Deuterium (2H) MR (DMR) spectroscopic approach, we further developed a quantitative DMR imaging method for simultaneous measuring the glucose consumption rate (CMRglc) and TCA cycle flux (VTCA) in rat brain at 16.4 T. Regional metabolic rates were quantified and compared between two brain conditions. The metabolite images were also generated. This work demonstrates the feasibility and reliability of in vivo DMR imaging for assessing glucose metabolisms, which makes it possible to image CMRglc and VTCA in brains under different states.
Introduction
Quantitative assessment of metabolic coupling/decoupling between glycolysis and glucose oxidation is crucial for understanding neuroenergetics under physiological and pathological conditions. To achieve this goal, there has been always a need to develop a reliable technique that can simultaneously measure the cerebral glucose consumption rate (CMRglc) and the TCA cycle flux (VTCA) in vivo. Recently, we developed such a novel Deuterium (2H) MR (DMR) spectroscopic approach for noninvasively assessing glucose metabolisms in the rat brain at ultrahigh field (1). This new method has the advantages of eliminating the usage of radioactive tracer commonly employed by 18FDG-PET imaging for CMRglc measurement; and of allowing more signal averaging resulting in substantial sensitivity gains due to the much shorter T1 of deuterated glucose (~0.05 s), when comparing with the classic 13C MRS method for VTCA quantification (1, 2). In this study, we aimed to develop a quantitative DMR imaging approach for assessing local glucose metabolisms by using dynamic 3D-chemical shift imaging (CSI) technique in the rat brain at 16.4 T. Through kinetic modeling analysis, regional metabolic rates were quantified and compared between two brain conditions, i.e., under 2% isoflurane anesthesia vs. constant morphine infusion. Metabolites images were also generated.Method
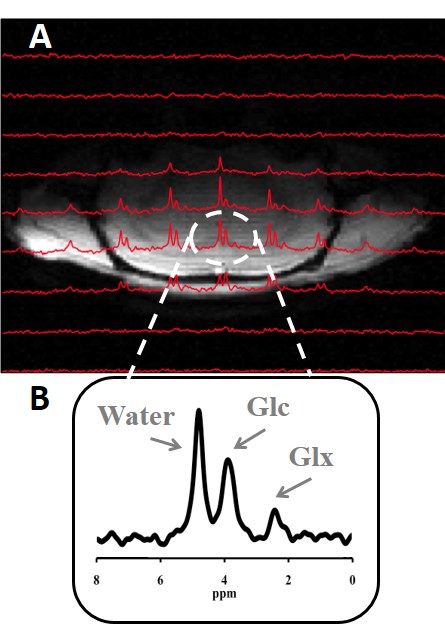
Eight Sprague Dawley rats (BW=358±45 g) were anesthetized by 2% isoflurane, and their femoral arteries and veins were catheterized for blood sampling, physiological monitoring and deuterated glucose and/or morphine infusion. All MR experiments were conducted at 16.4 T/26 cm scanner (Varian/VNMRJ) using a passively decoupled 1H/2H surface coil. Dynamic 2H CSI data of rat brains were acquired with 37 μL nominal voxel size and 69 s temporal resolution for about 103 min. For each rat, 11.5 min baseline spectra were acquired followed by 2 min i.v. infusion of D-Glucose-6,6-d2 (isotope, Sigma-Aldrich, 1.3 g/kg BW) dissolved in 2.5 mL saline. Four of the eight rats were switched from isoflurane inhalation to constant morphine i.v. infusion (25 mg/kg/hr) before the onset of DMR acquisitions. Three identical and partial overlapping voxels (central, as shown in Fig. 1, left and right) within the brain were selected as the regions of interest. All resonance signals (deuterated water, glucose (Glc) and glutamate/glutamine (Glx)) were fitted using a MATLAB-based program (1). The concentrations of metabolites were quantified as previously described (1). By least-square fittings of a kinetic model with the DMR data (1), CMRglc and VTCA were determined. Maps of cerebral Glc distribution were generated using summed spectral data (sum of 14 spectra, data from 22 to 38 min after infusion done). Saturation effects and non-uniform surface-coil B1 field on metabolite signals were also corrected for quantification.Result
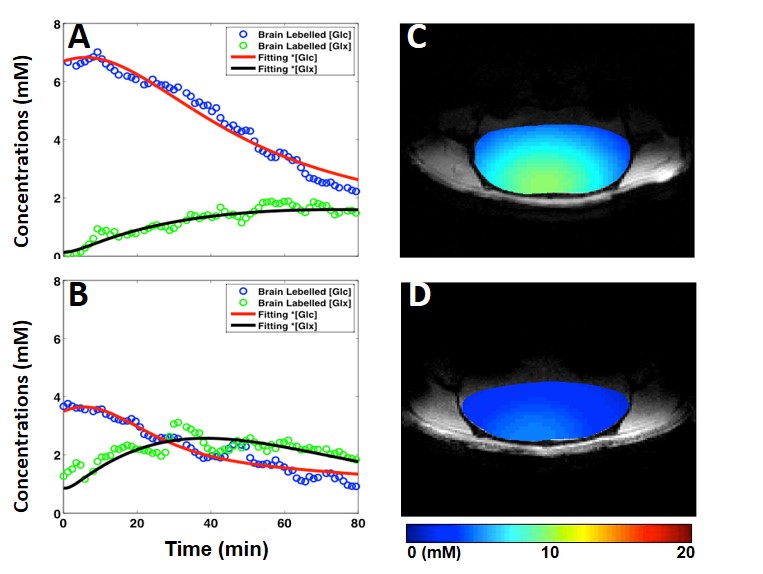
Figure 1 demonstrated excellent spectral quality and well-resolved metabolites resonances of the DMR CSI data obtained from individual voxel. Figure 2A&B showed the time courses of in vivo Glc and Glx concentrations and the results of model fittings obtained from the central voxels. When compared with the isoflurane condition (Fig. 2A), accelerated glucose consumption and Glx accumulation were observed from the morphine-infused brain (Fig. 2B). All of these findings indicated a stimulated glucose metabolism under morphine condition, which was confirmed by the kinetic modeling analytical quantification, i.e., increased CMRglc (0.6±0.06 vs. 0.3±0.03 μmol/g/min, averaged from three selected voxels) and VTCA (1.1±0.05 vs. 0.7±0.1 μmol/g/min) for the morphine group. Figure 2C&D illustrated a relatively uniform Glc distribution in the representative rat brains under the two metabolic conditions at the same time after infusion. Due to significantly increased glucose consumption rate under the morphine condition, in vivo brain Glc image showed a much low concentration (Fig. 2D).Discussion & Conclusion
Regional glucose consumption rate and TCA cycle flux were measured and quantified simultaneously in the rat brain at two different conditions. The results of CMRglc and VTCA from individual voxels of this study were relatively higher than the values previously reported (1). The underestimations of the previous study were due to the non-localized acquisitions combining signals originated from both of the brain tissues and muscles. This work demonstrates the feasibility, sensitivity and reliability of the in vivo DMR imaging technique for assessing cerebral glucose metabolisms, which makes it possible to simultaneously image the CMRglc and VTCA in brains under normal and diseased states at high/ultrahigh field.Acknowledgements
NIH Grants: R01 NS57560, NS70839, MH111447, R24 MH106049, P41 EB015894, P30 NS076408, S10 RR025031 and Keck foundation.References
(1) Lu, M. et al. (2017) J Creb Blood Flow Metab., PMID: 28503999. (2) Gruetter, R. et al. (1994) J. Neurochem. 63, 1377-1385.
Figures