0777
Quantitative Mapping by Data-Driven Signal-Model Learning1Advanced Clinical Imaging Technology, Siemens Healthcare AG, Lausanne, Switzerland, 2Department of Radiology, University Hospital (CHUV), Lausanne, Switzerland, 3LTS5, École Polytechnique Fédérale de Lausanne, Lausanne, Switzerland
Synopsis
In quantitative MRI, tissue properties are typically estimated by fitting a signal model onto the acquired data. These models are derived from the underlying MR physics describing the signal behavior. The accuracy of the quantitative values heavily depends on the correctness of this model which is usually validated using gold-standard sequences with long acquisition times. Here, we suggest learning the signal model based on the values obtained from the gold-standard sequence with machine learning methods instead. The feasibility of the idea is shown using quantitative T2-mapping with a multi-echo spin-echo sequence and a classical single spin-echo as the gold standard.
Introduction
In quantitative MRI, images encoding the quantitative parameters of interest are typically sampled multiple times, e.g. at different echo times using a multi-echo spin-echo (MESE) sequence to estimate T2. Subsequently, a signal model describing the relation between image intensities and relevant tissue properties is fitted onto these series of images, yielding a quantitative map. The chosen signal model is an approximation to reality by nature and may omit important components driving the signal behavior due to the complex nature of the tissue microstructure (e.g. magnetization transfer effects) or system imperfections (e.g. field inhomogeneity), among others. Taking MESE-based T2 mapping as an example, one often consciously ignores sources of model failure resulting from non-ideal pulse profiles inducing stimulated echoes that cannot be described with a simple mono-exponential decay. As a result, T2 values are systematically overestimated in comparison to a gold-standard sequence (e.g. single-echo spin-echo sequence). In the past years, more complex signal models have been developed to describe the spin behavior more accurately, for example using Bloch simulations1,2.
Here, we suggest learning the relation between signal intensities and gold-standard values using machine learning tools rather than a predefined physical model. This general data-driven approach is demonstrated by quantifying T2 using a learnt signal model for a MESE sequence with a single-echo spin-echo sequence as gold-standard reference.
Methods
MESE images of four healthy subjects were acquired after obtaining written consent using a product Carr-Purcell-Meiboom-Gill sequence at 3T (MAGNETOM Skyra, Siemens Healthcare, Erlangen, Germany) equipped with a standard 64-channel head/neck coil (1.4x0.9x3.3mm3 voxel-size, 134x256x40 matrix, 6 echoes, ΔTE=15ms, TR=3.95s, and TA=8:49 min). Reference T2 values were obtained from three slices using a resolution- and orientation-matched single-echo spin-echo sequence (TE=12/50/100ms, TR=2.5s, TA=16:45min per slice). The gold-standard T2 values were computed using a non-linear fit of a mono-exponential decay onto the spin-echo data. At this point, a gold-standard T2 value is associated with every measured MESE signal evolution (decay), and machine-learning approaches can be used to learn the relationship between the decay and the T2 value.
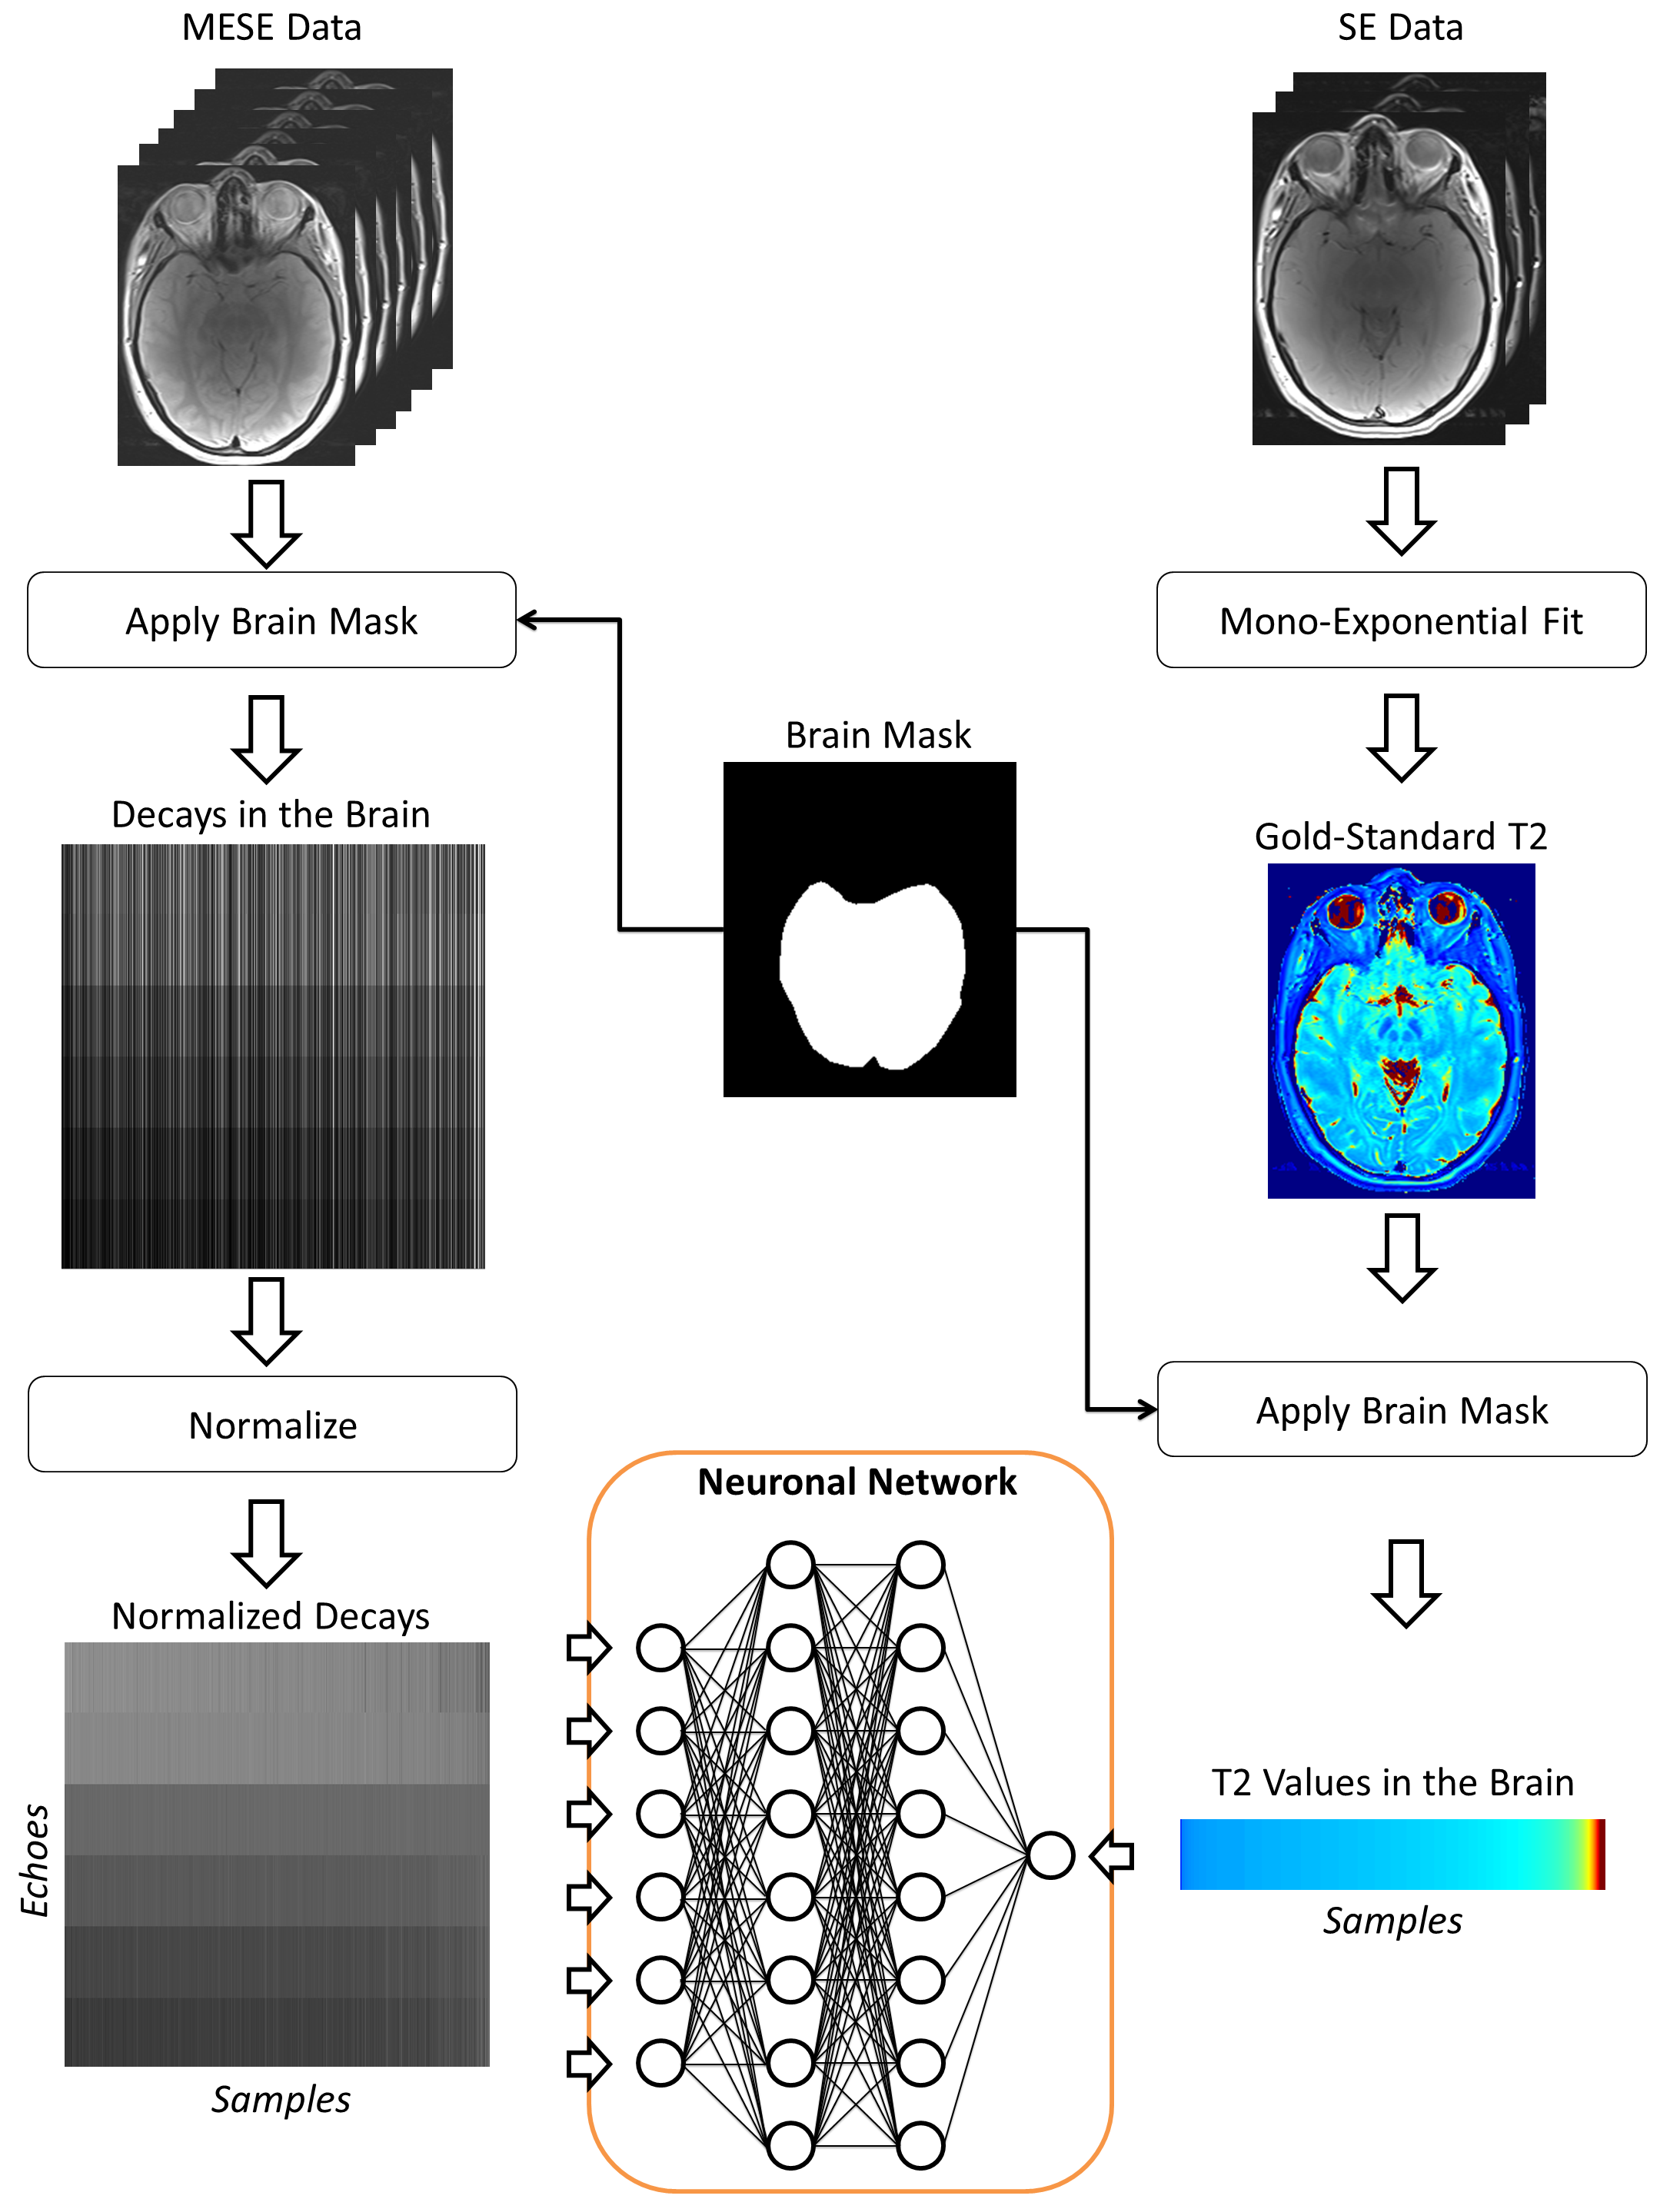
The prototype processing pipeline used in this study is illustrated in Figure 1. The intracranial volume was first segmented to restrict the learning to brain tissue. All MESE signal decays were normalized by dividing the signal intensities by the l2-norm of the decay. Subsequently, a neuronal network was trained using the signal intensities of each echo as input and the gold-standard T2 value as desired output. This training was performed using the signal decays from only three of the subjects.
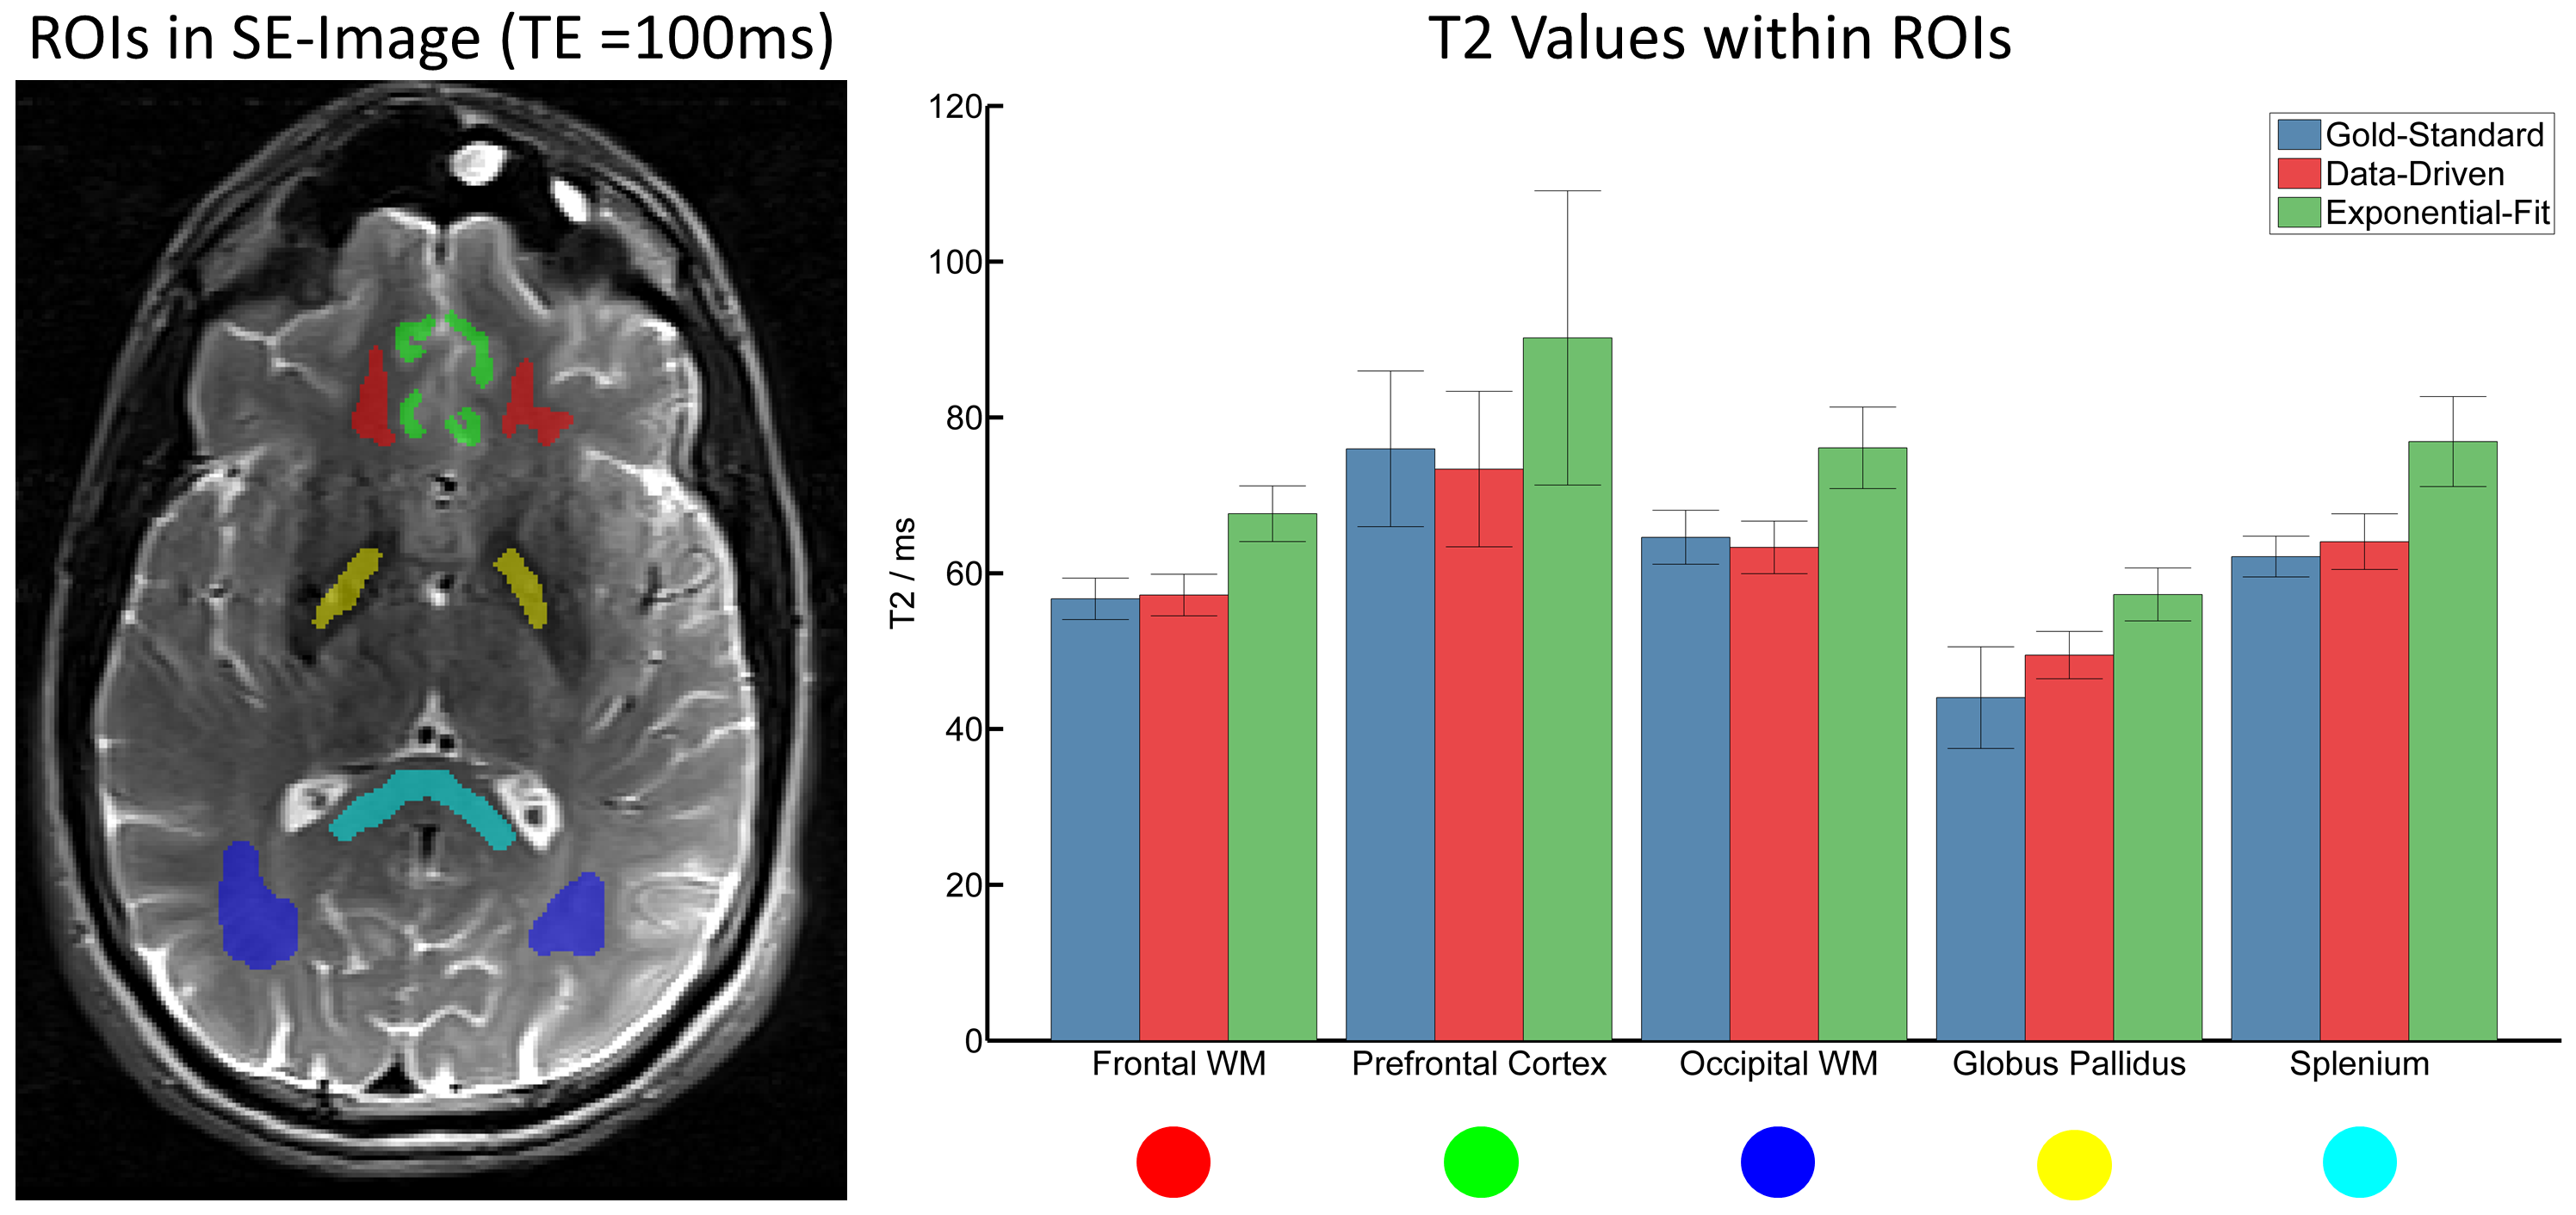
The data of the fourth subject was used as validation dataset (i.e. was not included in the training). Every decay was fed to the previously trained network to estimate T2 in each voxel of the validation dataset. For comparison to the classical procedure, a conventional mono-exponential fit was also performed. The obtained T2 values of the data-driven approach and the mono-exponential fit were compared to the gold-standard spin-echo T2 values within manually drawn regions of interest (ROIs).
Results
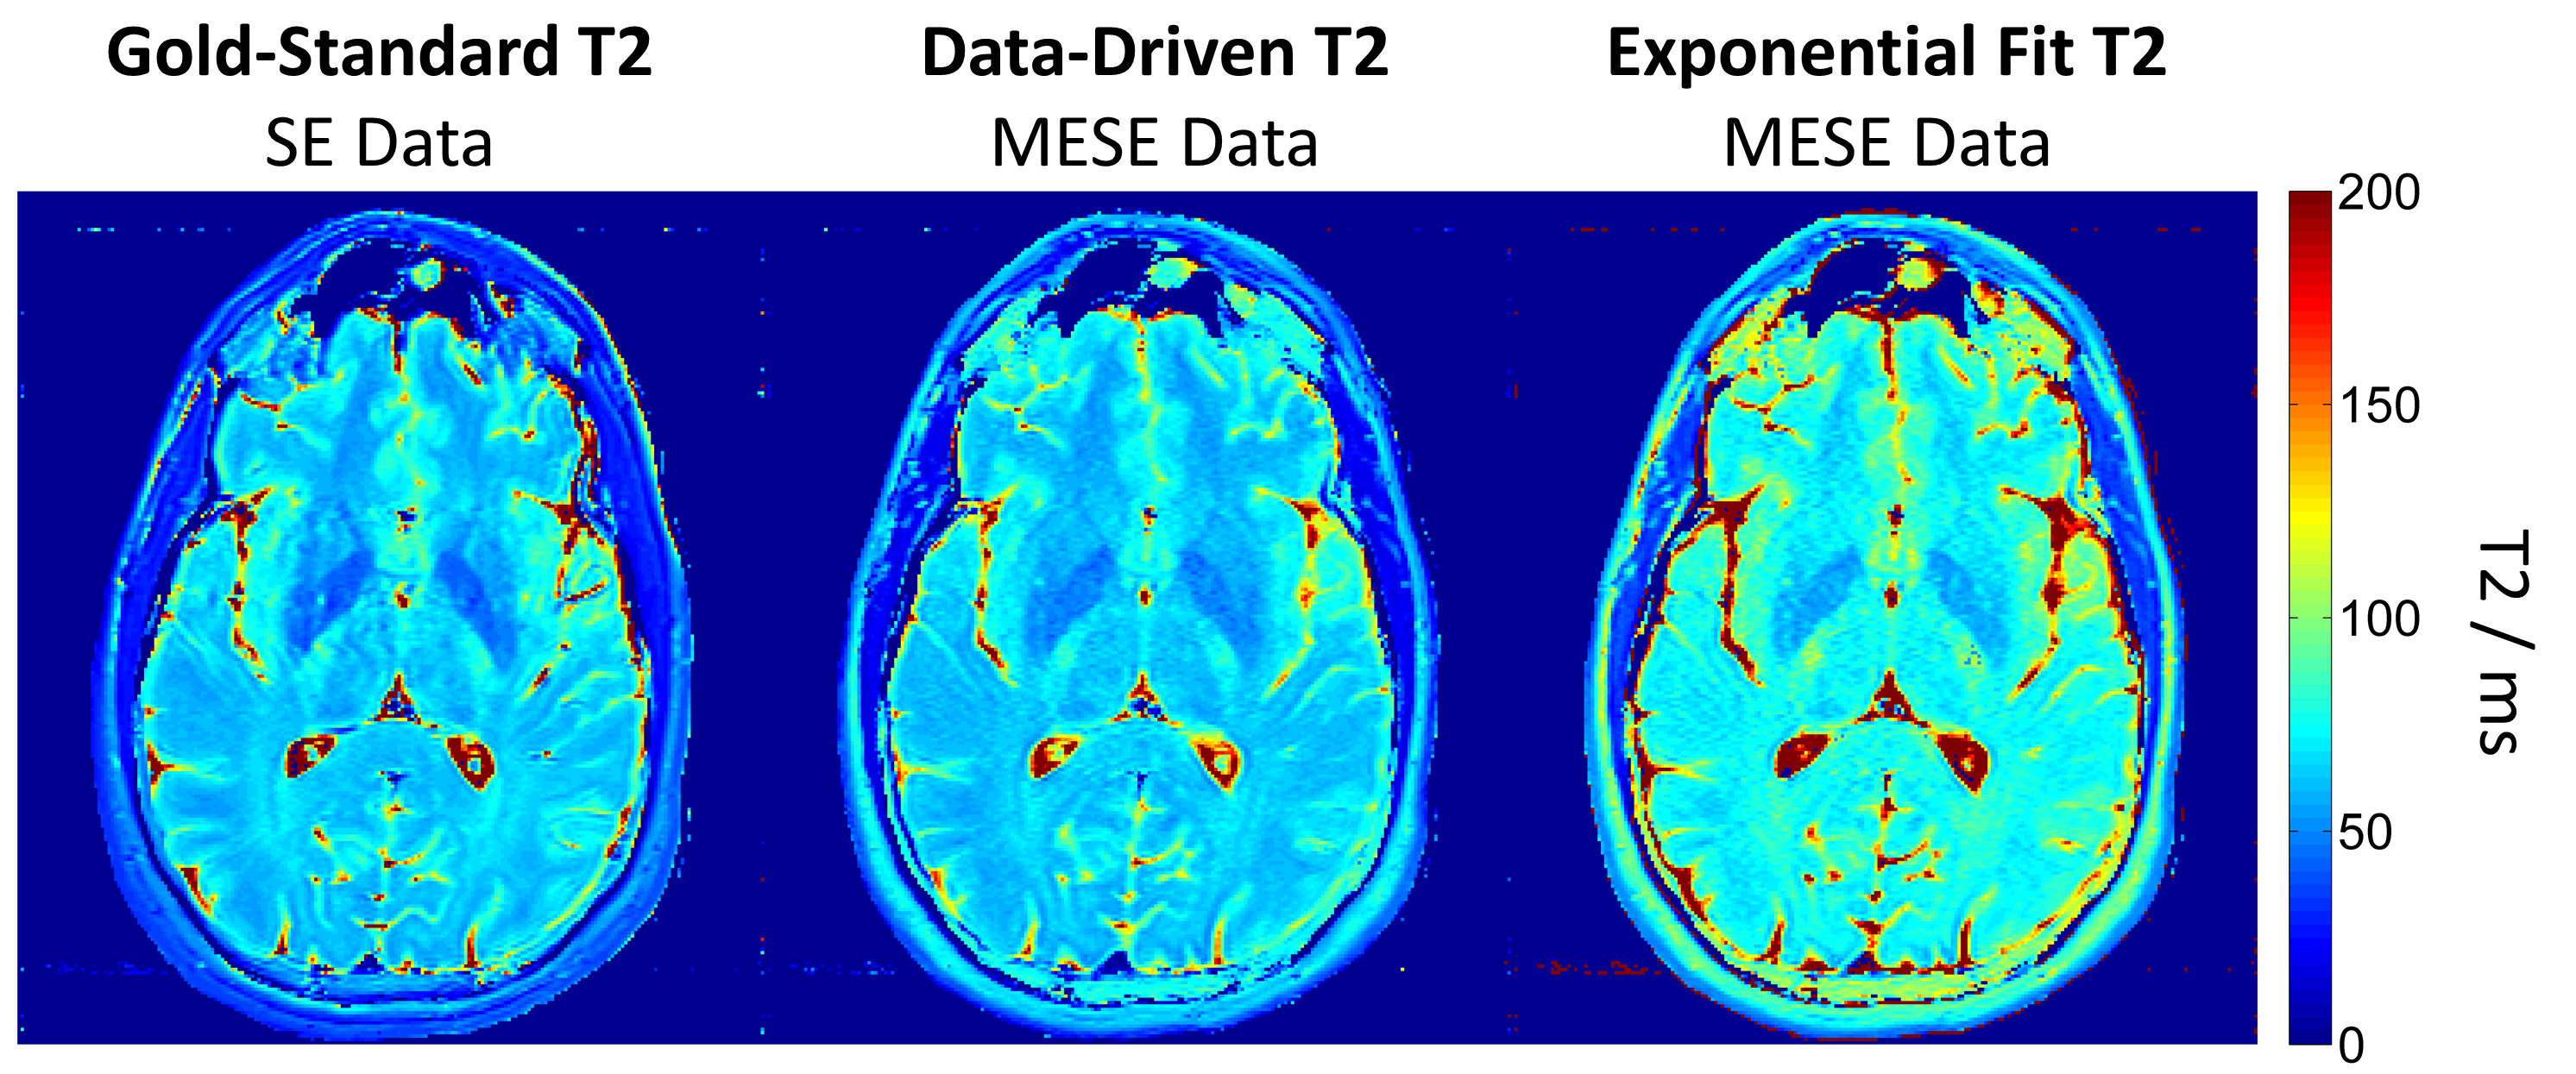
Figure 2 contrasts the gold-standard spin-echo-based T2 maps with results from the proposed data-driven approach and the classical fitting of the MESE data. As it can be seen, T2 values generated with the data-driven approach agreed better with the spin-echo acquisition, whereas the mono-exponential fit exhibited the expected systematical overestimation, mostly due to stimulated-echo effects. The quantitative ROI analyses confirmed that observation (Figure 3). Figure 4 shows all slices of the data-driven reconstruction. It is worth noting that the reconstruction of the entire volume took ~2 s using the neuronal network but ~140 s using the classic fit (16GB RAM, Intel®Core™ i7-3770K CPU@3.50GHz).Discussion & Conclusion
Our preliminary data suggest that a data-driven approach can improve tissue quantification techniques by learning signal models including inherent imperfections from reference data. One limitation of this method is that it is trained on a specific sequence protocol, i.e. it needs to be retrained when sequence parameters influencing the decay (e.g. the echo time) are modified. Furthermore, the method relies on a gold-standard method (e.g. spin-echo sequence) to train the network, which might be flawed due to subject motion or an oversimplified signal model for the reference.
Despite these limitations, the data-driven approach may be a good alternative when a complex spin model is required. Furthermore, the method is generalizable; it may be, for example, applied to T1 mapping based on a look-locker sequence, but using an IR-SE as gold standard3. The method could also be used for magnetic resonance fingerprinting4, where the fingerprint is the input and the multi-parametric values are outputs of the neuronal network.
Acknowledgements
No acknowledgement found.References
- Ben‐Eliezer, Noam, Daniel K. Sodickson, and Kai Tobias Block. "Rapid and accurate T2 mapping from multi–spin‐echo data using Bloch‐simulation‐based reconstruction." Magnetic resonance in medicine 73.2 (2015): 809-817.
- Sumpf, Tilman J., et al. "Fast T2 mapping with improved accuracy using undersampled spin-echo MRI and model-based reconstructions with a generating function." IEEE transactions on medical imaging 33.12 (2014): 2213-2222.
- Look, David C., and Donald R. Locker. "Time saving in measurement of NMR and EPR relaxation times." Review of Scientific Instruments 41.2 (1970): 250-251.
- Ma, Dan, et al. "Magnetic resonance fingerprinting." Nature 495.7440 (2013): 187-192.
Figures