0776
Common pitfalls in machine learning applications to multi-center data: tests on the ABIDE I and ABIDE II collections1Physics, University of Pisa, Pisa, Italy, 2National Institute for Nuclear Physics, Pisa, Italy
Synopsis
Applying Machine Learning (ML) techniques on neuroanatomical MRI data, is becoming widespread for studying psychiatric disorders. However, such instruments require some precautions that, if not applied, may lead to inconsistent results that depend on the procedural choices made in the analysis. In this work, taking neuroimaging studies on Autism Spectrum Disorders as a reference, it is demonstrated that the strong dependency of the cerebral quantities extracted with the segmentation software FreeSurfer 6.0 on the MRI acquisition parameters can, in a multivariate analysis based on ML, obscure the differences due to medical conditions and give inconsistent and meaningless results.
INTRODUCTION
Autism Spectrum Disorders (ASD) are a group of neurodevelopmental diseases involving behavioral, social and communicative disabilities. Many studies focus on the analysis of brain MRI images, aiming to detect the anatomical features that characterize ASD. These studies are generally carried out according to the following procedure: collection of brain MRI images of ASD and control subjects from various research centers; image segmentation through specific software tools (e.g. Freesurfer) to extract quantitative measurements of anatomical regions; training classifiers based on Machine Learning (ML), which are able to extract patterns that allow to distinguish ASD from control subjects. The accuracies of these biomarkers in distinguishing ASD from controls are barely reproducible across different studies1,2,3. The lack of shared results could be attributed to inhomogeneities induced in the images by different MRI scanners or different acquisitions settings that characterize the data of every research center4 or sub-optimal performances of segmentation algorithms5. Particularly in case of psychiatric diseases, where macroscopic anatomical differences between case and control subjects do not exist, it is of utmost importance to understand the many possible confounding factors that can affect ML analyses.METHODS & RESULTS
The T1-weighted MRI scans of the about 2000 subjects of the biggest international database on autism (ABIDE I and II collections) have been processed with Freesurfer 6.0 (recon-all workflow) and 420 cerebral features were extracted. Then a multivariate and univariate outlier analysis has been conducted to exclude anomalous data. In order to investigate the effect that different acquisition settings have on a multivariate analysis, different classifiers have been trained on age-matched and sex-matched subjects acquired in different sites. In figure 1 results are reported representing the general performances of classifiers trained to distinguish between all the possible couples of the 39 different acquisition sites that contributed to ABIDE. These results pose new questions: indeed, if the differences due to the acquisition site are so easily detected by a ML approach, there is the risk that, if a group of subjects with the same medical condition comes also from the same site, the classifier may learn a criterion based on the acquisition site rather than the medical condition, giving the false impression of extremely good results. In fact, as the classifiers trained to distinguish cases from controls in subjects coming from the same site show (figure 2), the classification performances are greatly inferior with respect to the ones reported in figure 1. The findings described in this work may seem rather unusual, given that various studies6,7 affirm that the features extracted with Freesurfer are comparable, even when the acquisition parameters vary. This is due to the fact that a univariate analysis is not able to capture the real proportion of the differences due to the acquisition settings, since they are evenly spread among the various features. This concept is shown in the plots in figure 3. Finally, an analysis was made to investigate the possibility of eliminating or reducing the influence of the acquisition site by removing some features, however, it has been found that there is not a single group of features that varies consistently among the different sites. Therefore, the number of features with which the classifier is trained has been progressively reduced (randomly deleting some features), in order to understand how many features the classifier needs to correctly classify the acquisition site of the subjects. As it can be observed from the plot in figure 4, the performances start to degrade when the feature number goes below 10. Using such a small sample of features would however defeat the purpose of using ML techniques to find patterns in a great amount of data.CONCLUSION
This study shows that the differences due to the acquisition protocol can have a strong impact on a multivariate analysis. It also emerges that, even if the same protocol is used, small differences (probably intrinsically tied to the specific scanner) make the data not comparable. Preprocessing pipelines devoted to data harmonization8, quality check on the extracted features, outlier removal and careful matching for confounding variable are necessary preliminary steps to improve the reliability of the results in multi-center studies. Furthermore, these results underline the necessity of using different acquisition modes, able to detect physical signals more dependent on tissue types rather than acquisition settings, like the recently introduced quantitative Magnetic Resonance Fingerprinting9.Acknowledgements
This work has been supported by the Tuscany Government (PAR-FAS2007-2013, Bando FAS Salute 2014) through the ARIANNA Project(C52I16000020002) https://arianna.pi.infn.itReferences
1. Anagnostou, Evdokia, and Margot J. Taylor. "Review of neuroimaging in autism spectrum disorders: what have we learned and where we go from here." Molecular autism 2.1 (2011): 4.
2. Haar, Shlomi, et al. "Anatomical abnormalities in autism?." Cerebral Cortex 26.4 (2014): 1440-1452.
3. Abraham, Alexandre. Learning functional brain atlases modeling inter-subject variability. Diss. Université Paris-Saclay, 2015.
4. Styner, M., et al. "Multi-site validation of image analysis methods-assessing intra and inter-site variability." SPIE Medical Imaging. Vol. 4684. No. 278-286. 2002.
5. Gronenschild, Ed HBM, et al. "The effects of FreeSurfer version, workstation type, and Macintosh operating system version on anatomical volume and cortical thickness measurements." PloS one 7.6 (2012): e38234.
6. Dickerson, Bradford C., et al. "Detection of cortical thickness correlates of cognitive performance: reliability across MRI scan sessions, scanners, and field strengths." Neuroimage 39.1 (2008): 10-18.
7. Wonderlick, J. S., et al. "Reliability of MRI-derived cortical and subcortical morphometric measures: effects of pulse sequence, voxel geometry, and parallel imaging." Neuroimage 44.4 (2009): 1324-1333.
8. Fortin, Jean-Philippe, et al. "Removing inter-subject technical variability in magnetic resonance imaging studies." NeuroImage 132 (2016): 198-212.
9. Ma, Dan, et al. "Magnetic resonance fingerprinting." Nature495.7440 (2013): 187-192.
Figures
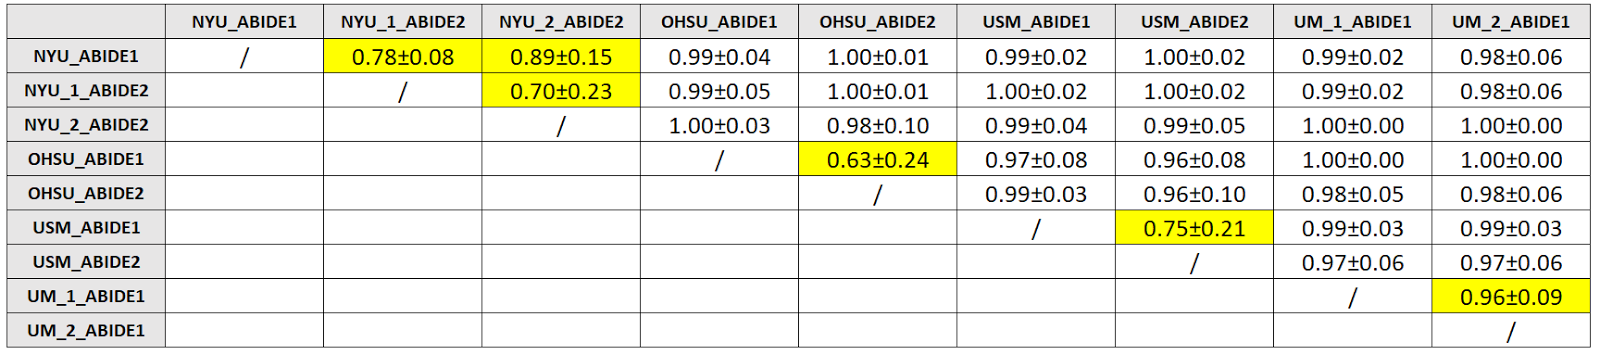
Fig.1
Table showing average values of 100 AUCs (with standard deviation) obtained from classifiers based on Logistic Regression. The classifiers have been trained to distinguish subjects acquired in different sites. These classifiers have been trained with 80% of the subjects from every site, matching them for age and sex. ML algorithms are able to distinguish subjects acquired with different scanners and/or protocols with high accuracy. The cases in which the acquisition sites reported to have used the same acquisition settings are highlighted in yellow. Even in this case it is often possible to distinguish the two acquisition settings.
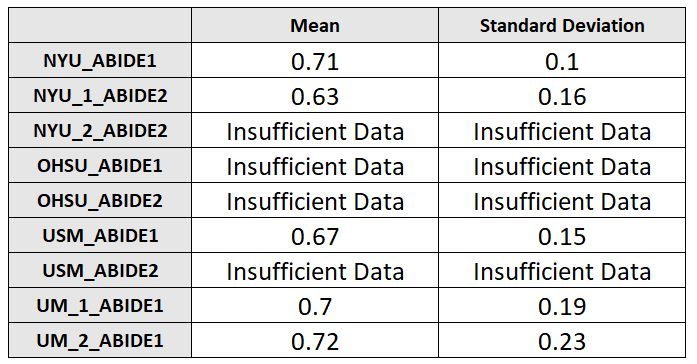
Fig.2
Table showing average values of 100 AUCs (with standard deviation) obtained from classifiers based on Logistic Regression. The classifiers have been trained to distinguish cases from controls acquired in the same site. These classification performances are worse than those obtained in table 1, meaning that, if no particular care is taken regarding the composition of the training dataset when trying to find differences between cases and controls, differences due to acquisition settings may obscure them.
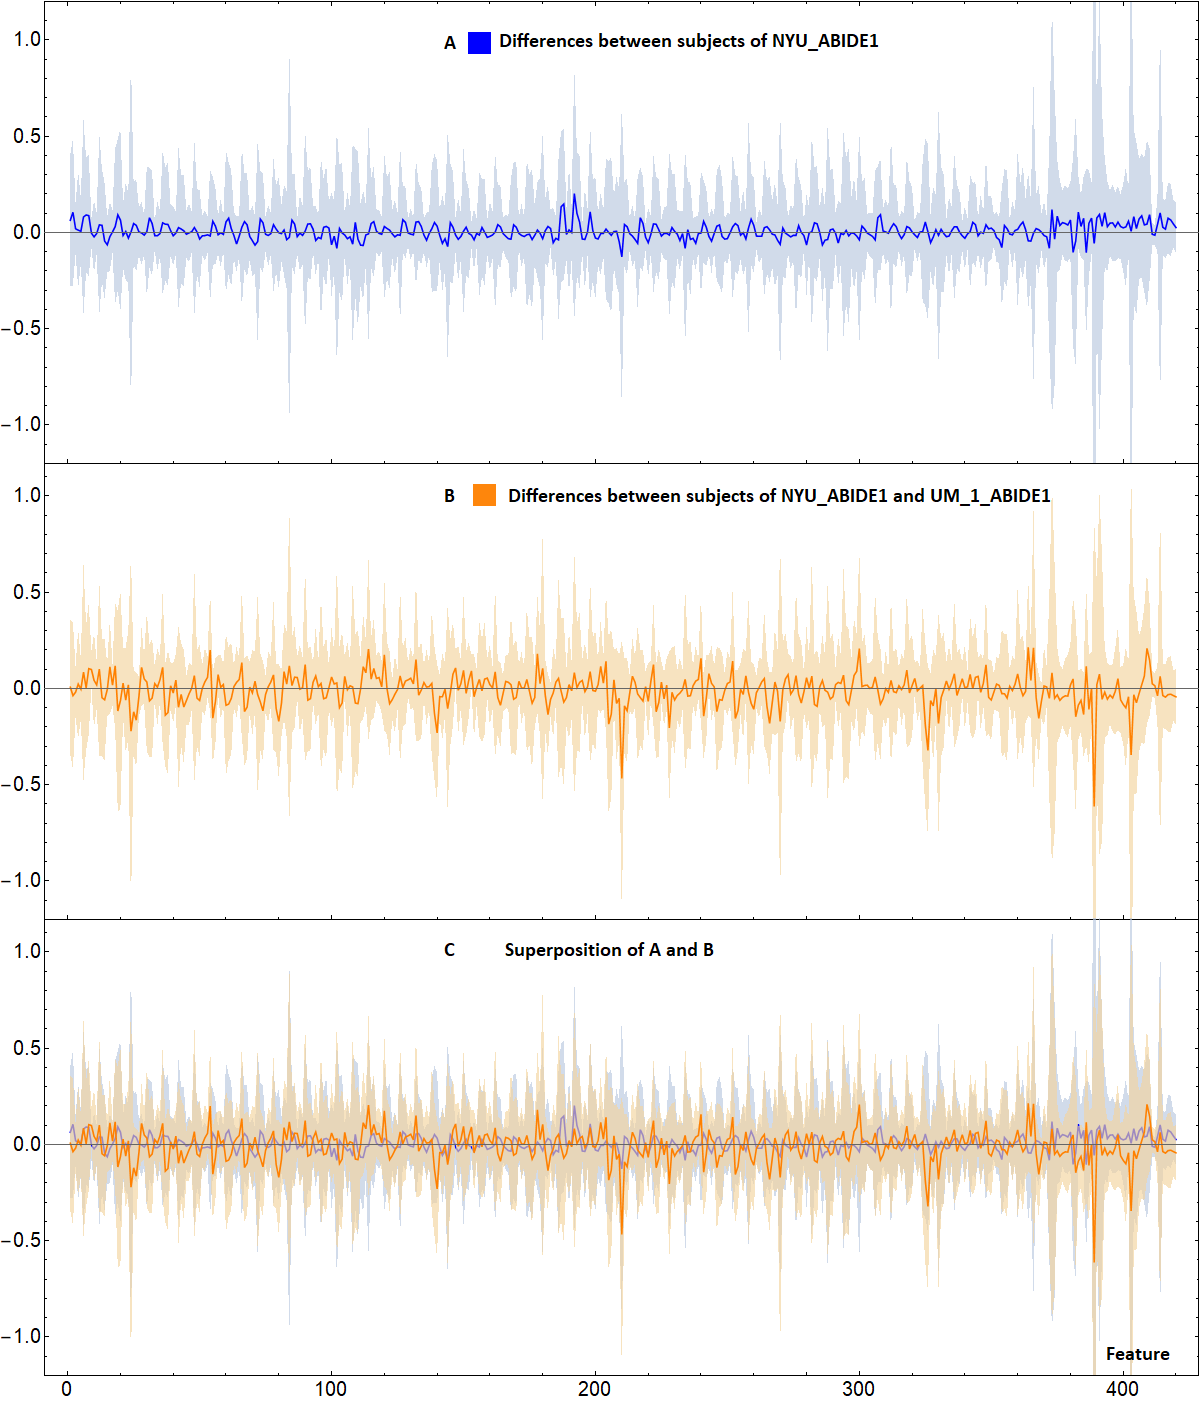
Fig.3
A: Blue line represents the difference between the mean value of the features of two subgroups of subjects taken randomly from the NYU_ABIDE1 site. Differences are small and contained in the blue band (representing the standard deviation).
B: Plot similar to A, but the subjects belong to different sites: NYU_ABIDE1 and UM_1_ABIDE1. This analysis shows that the differences between the single features are not particularly relevant, contrary to what ML show.
C: Superposition between A and B. The differences between different sites (orange line) are still included in the normal variability range of the features of the subjects of a single site (blue band).
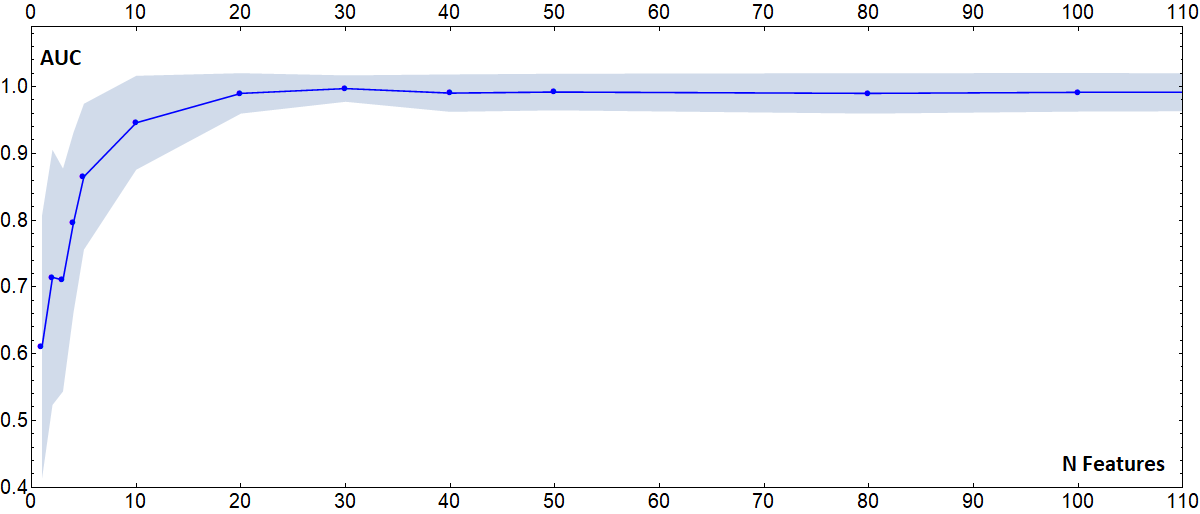
Fig.4
Plot of the average value of 100 AUCs of classifiers trained to distinguish subjects coming from the NYU_ABIDE1 and UM_1_ABIDE1 sites, as a function of the number of features taken into consideration. The features dropped are random (and different in each of the 100 runs). When less than 10 features are used, the differences due to the acquisition site lose relevance. However, using such a small number of features to extract biomarkers can be extremely limiting.