0775
Predictive Cytological Topography (PiCT): a Radio-Pathomics Approach to Mapping Prostate Cancer1Biophysics, Medical College of Wisconsin, Wawautosa, WI, United States, 2Radiology, Medical College of Wisconsin, Wawautosa, WI, United States, 3Pathology, Medical College of Wisconsin, Wawautosa, WI, United States, 4Biostatistics, Medical College of Wisconsin, Wawautosa, WI, United States, 5Urologic Surgery, Medical College of Wisconsin, Wawautosa, WI, United States, 6Radiation Oncology, Medical College of Wisconsin, Wawautosa, WI, United States
Synopsis
We present a machine learning technique for mapping prostate cancer cellular features into MRI space. 39 patients were prospectively recruited for imaging prior to prostaectomy. Tissue was aligned with the MRI using a non-linear control point warping technique. Pathologist annotations were likewise transformed into MRI space. A partial least squares regression (PLS) algorithm was trained on two sets of 10 patients and applied to 19 test patients, using MRI values as the input to predict epithelial and lumen density. The output maps are new interpretable image contrasts predictive of prostate cancer presence.
Introduction
One in seven men will be diagnosed with prostate cancer, though not all cases are clinically significant[1]. Differentiation of indolent from aggressive disease is a major focus of ongoing radiological studies. Rad-path correlation is the integration of radiology and pathology, where diagnostic information from tissue is aligned with medical imaging to validate imaging technology[2,3]. This study applies machine learning to two training datasets of quantitatively characterized whole mount prostate histology aligned to noninvasive imaging to test the hypothesis that predictive maps of pathological features indicative of high-grade cancer can be generated using non-invasive imaging alone.[4,5]Methods
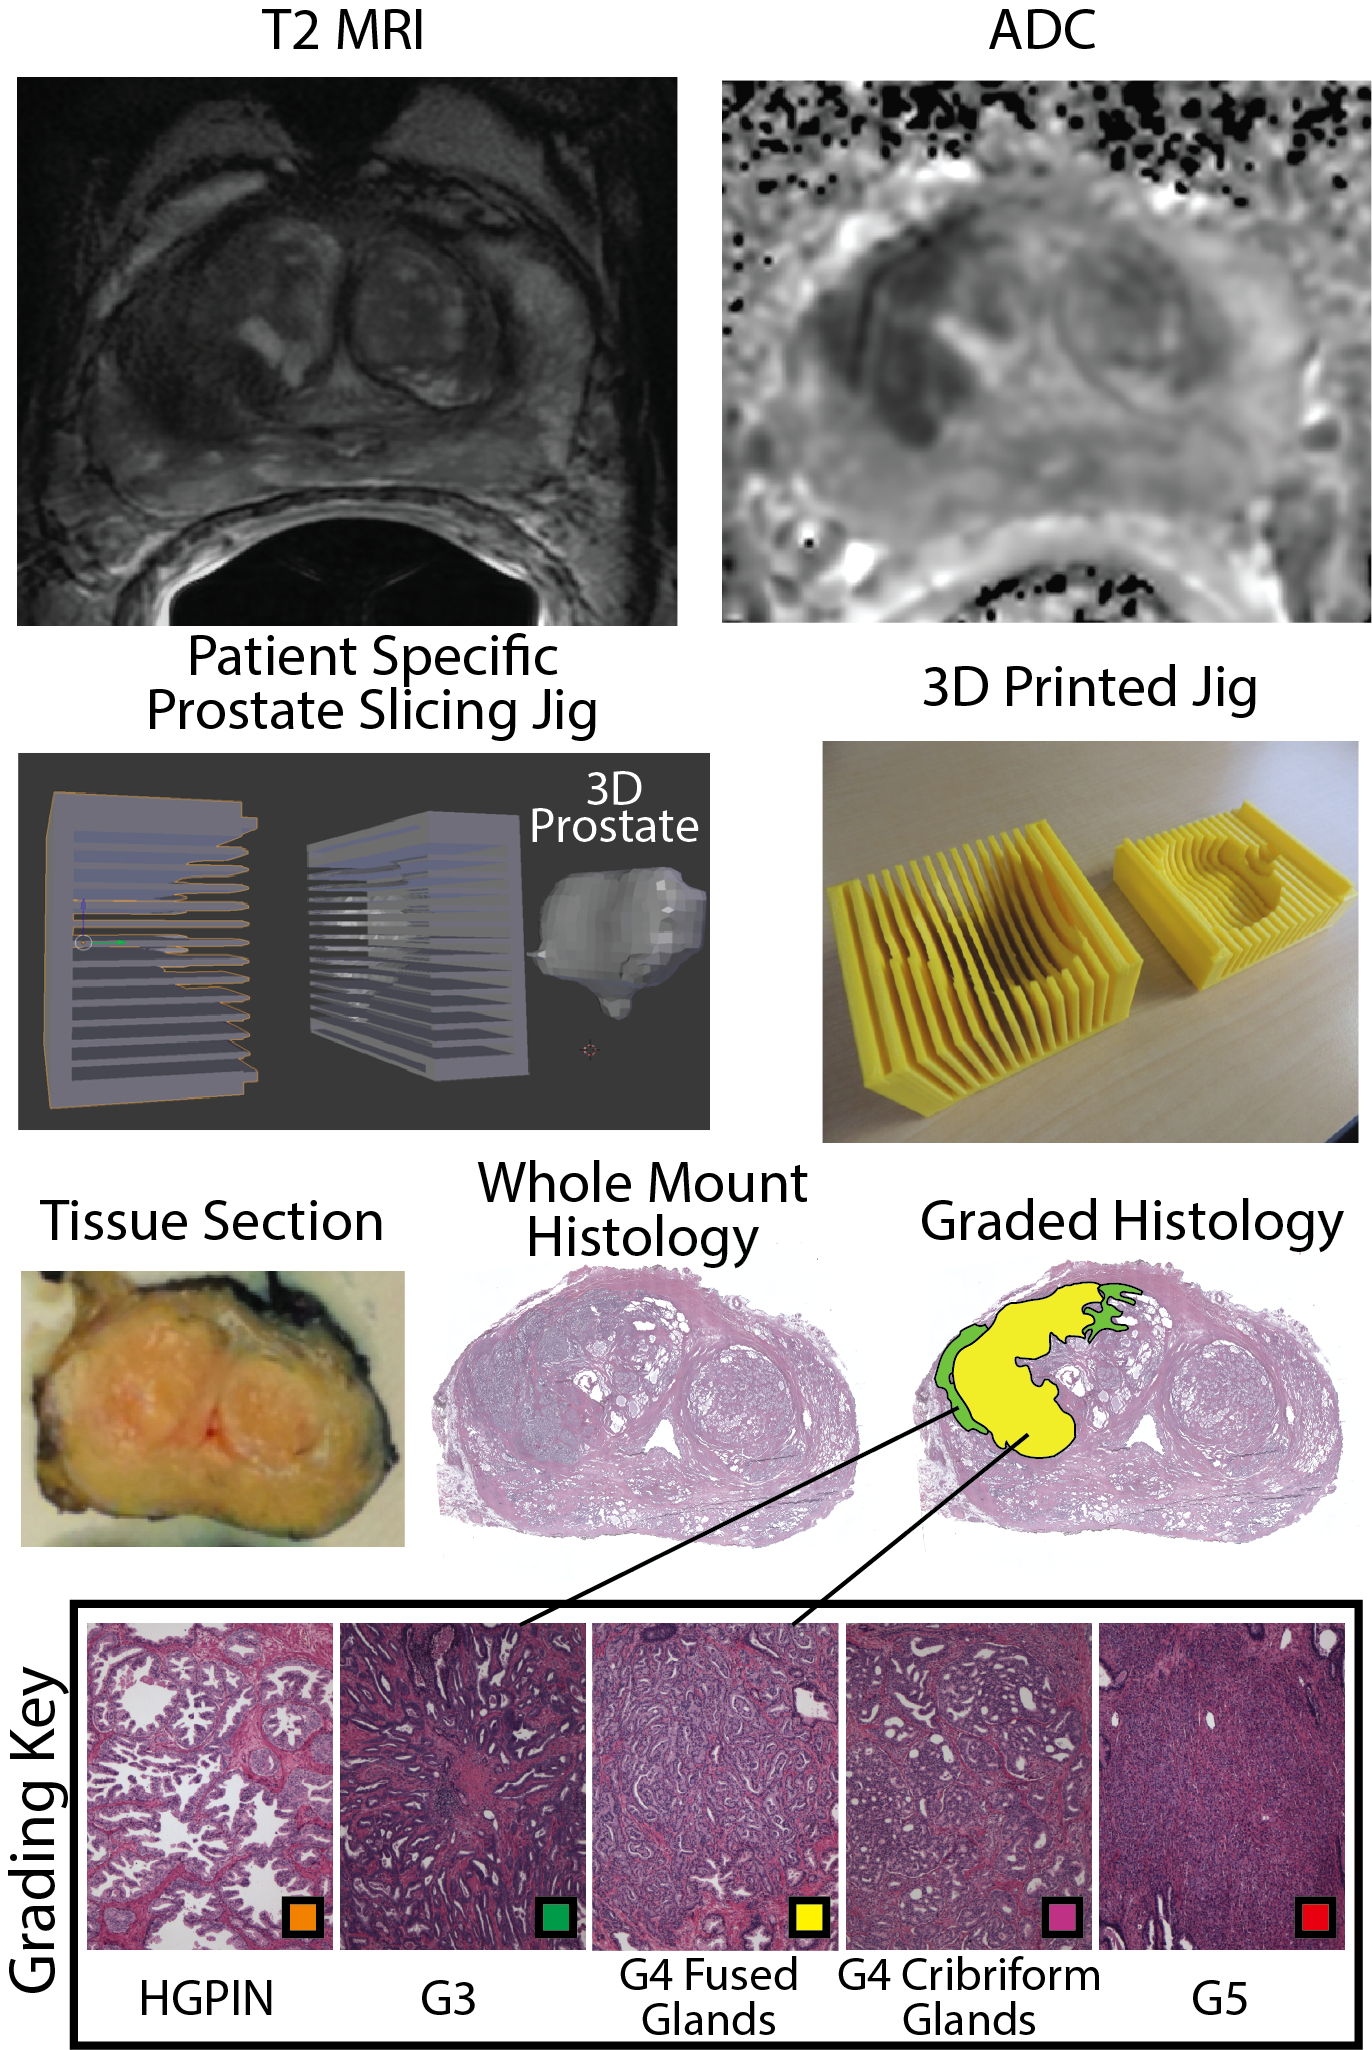
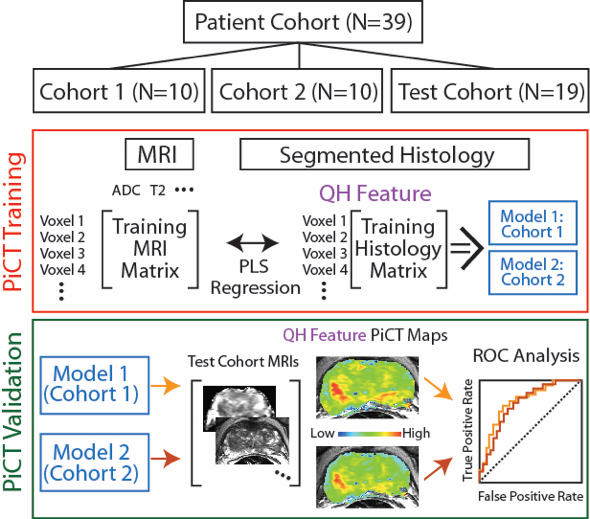
We prospectively recruited thirty-nine patients undergoing prostatectomy for this institutional review board (IRB) approved study. Patients underwent MP-MRI prior to prostatectomy on a 3T MRI scanner (General Electric, Waukesha, WI) using an endorectal coil. MP-MRI included field-of-view (FOV) optimized and constrained undistorted single shot (FOCUS) diffusion weighted imaging (DWI) with ten b-values (b=0, 10, 25, 50, 80, 100, 200, 500, 1000, and 2000), dynamic contrast enhanced (DCE) imaging, and T2-weighted imaging. T2 weighted images were intensity normalized and apparent diffusion coefficient maps were calculated. The DCE data was used to calculate the percent change in signal intensity before and after contrast injection. All images were aligned to the T2 weighted image. Robotic prostatectomy was performed within 2 weeks of imaging. Prostate samples were sliced using a custom 3D printed slicing jigs matching the slice profile of the T2 weighted image. Whole mount samples were hematoxylin and eosin stained, digitized, and annotated by a board certified pathologist (Figure 1). A total of 210 slides were included in this study. Lumen and epithelium density were automatically segmented from the histology using a custom algorithm written in MATLAB. The algorithm was validated by comparing manual to automatic segmentation on 18 samples. Slides were aligned with the T2 weighted image using a non-linear control point warping technique.[6] Lumen and epithelium density and the expert annotation were likewise transformed into MRI space. To determine the optimal number of patients required to train the algorithm, a learning curve was generated using a PLS algorithm trained on 150 random permutations of patients incrementing from 1 to 29 patients. Slides were stratified such that all slides from a single patient were in the same cohort. Three cohorts were generated, with tumor burden balanced across all cohorts. A PLS algorithm was trained on two independent training sets (cohorts 1 and 2) and applied to Test cohort 3. The input vector consisted of MRI values and the target variable was lumen and epithelium density. The algorithm was trained lesion-wise. Each model was then applied to the MRI data from the Test cohort 3 to generate predictive cytological topography (PiCT) maps of epithelium and lumen density. Mean lesion values were compared between high grade, low grade, and healthy tissue using an ANOVA. An ROC analysis was performed lesion-wise on the test set.Results
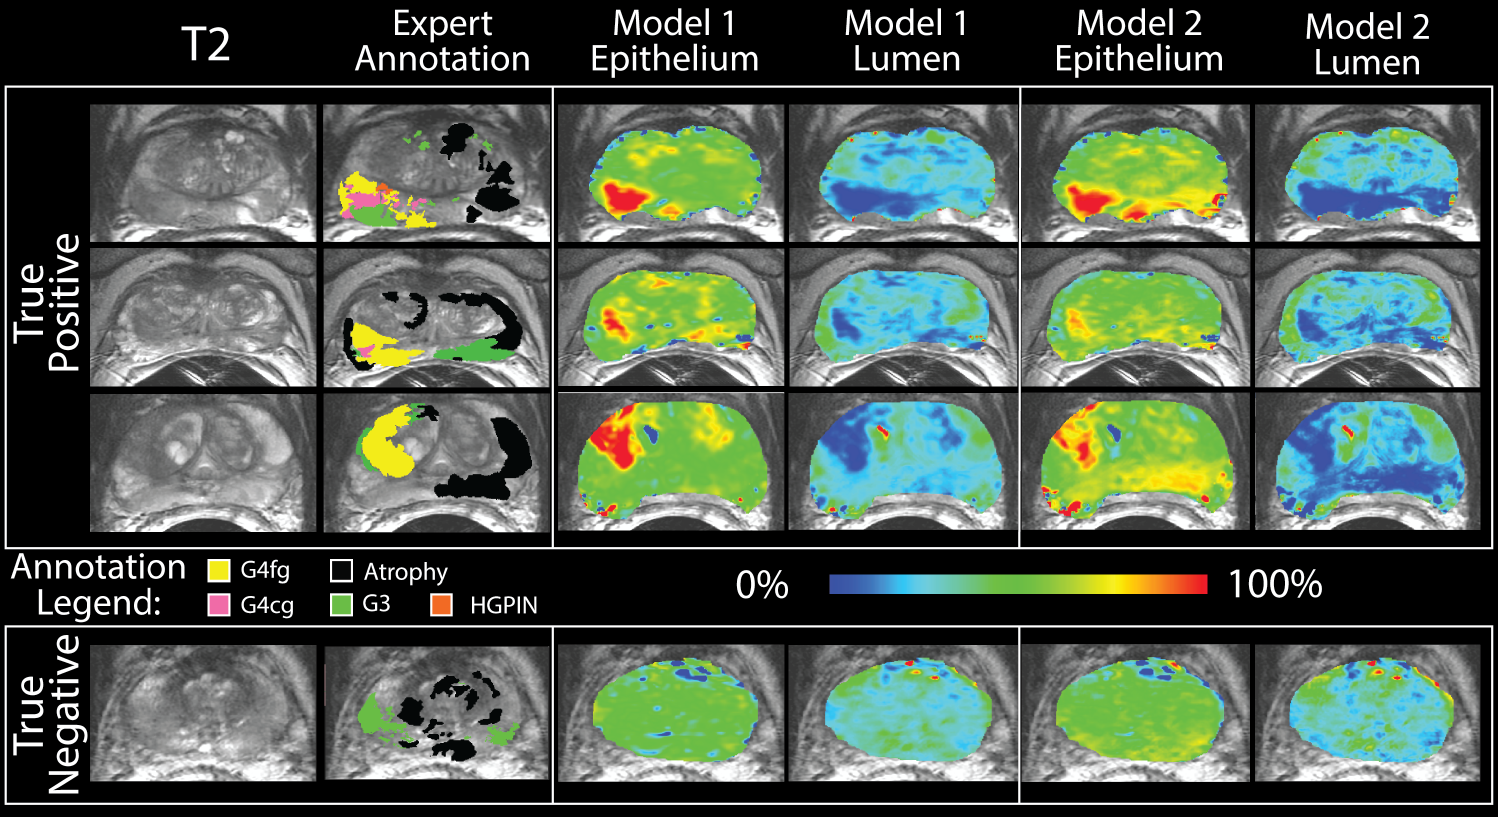
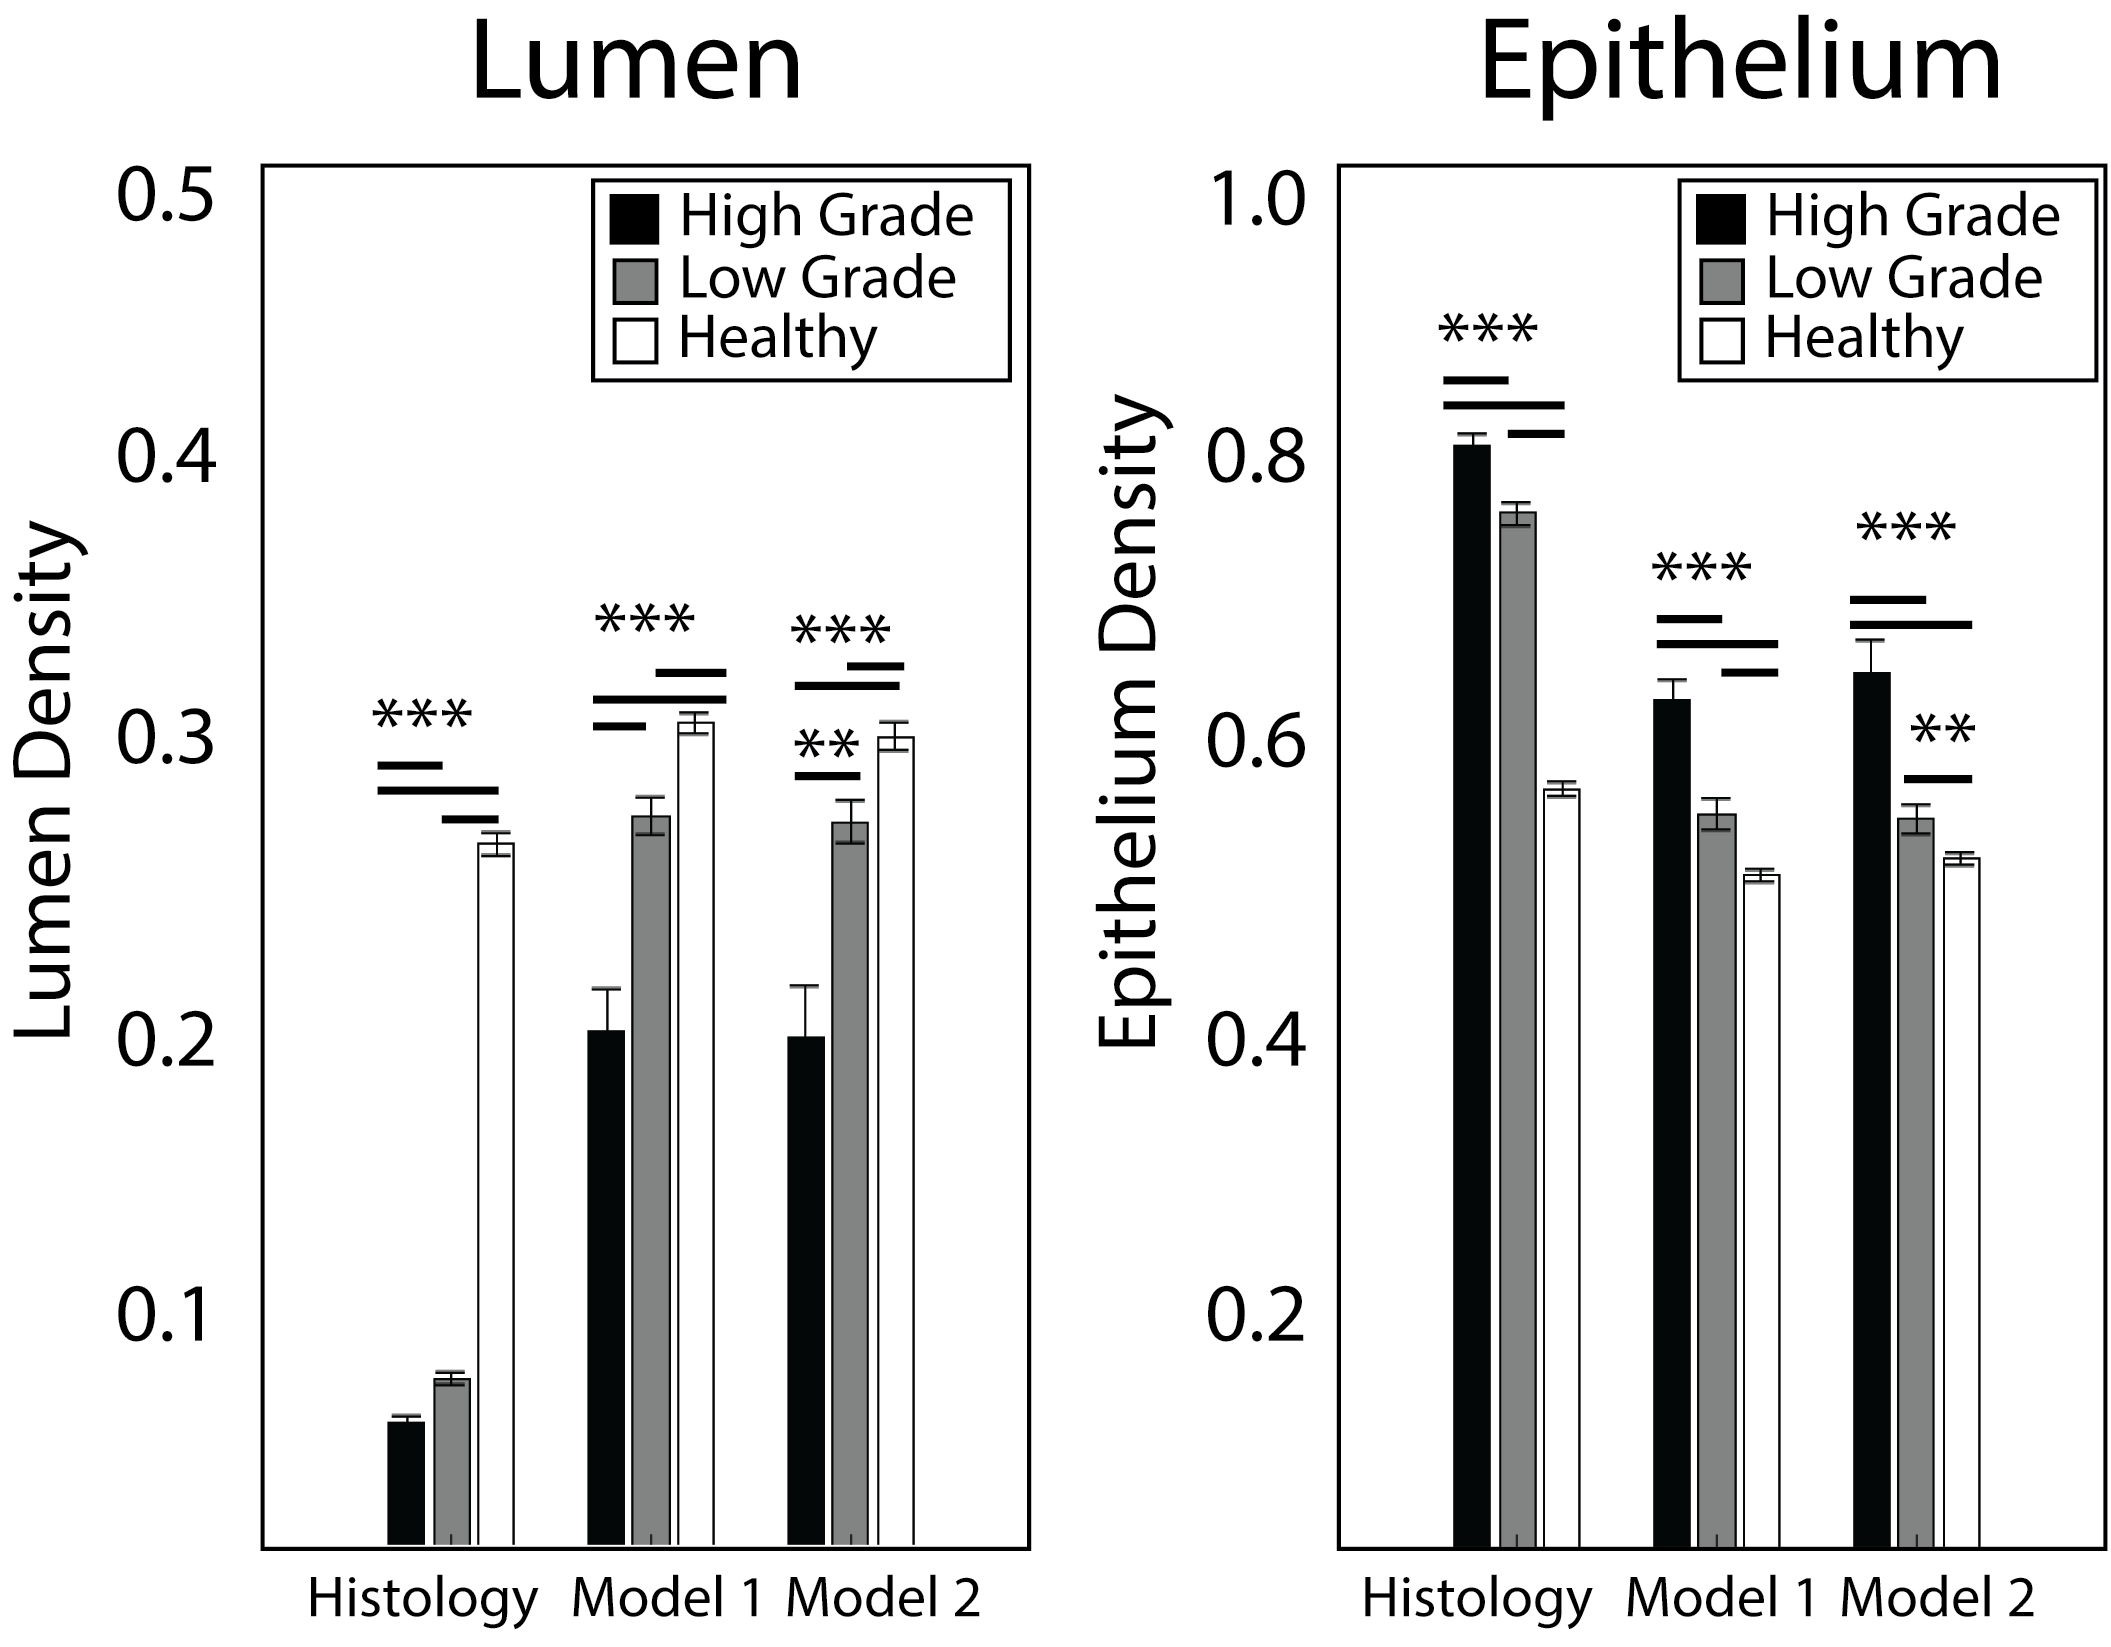
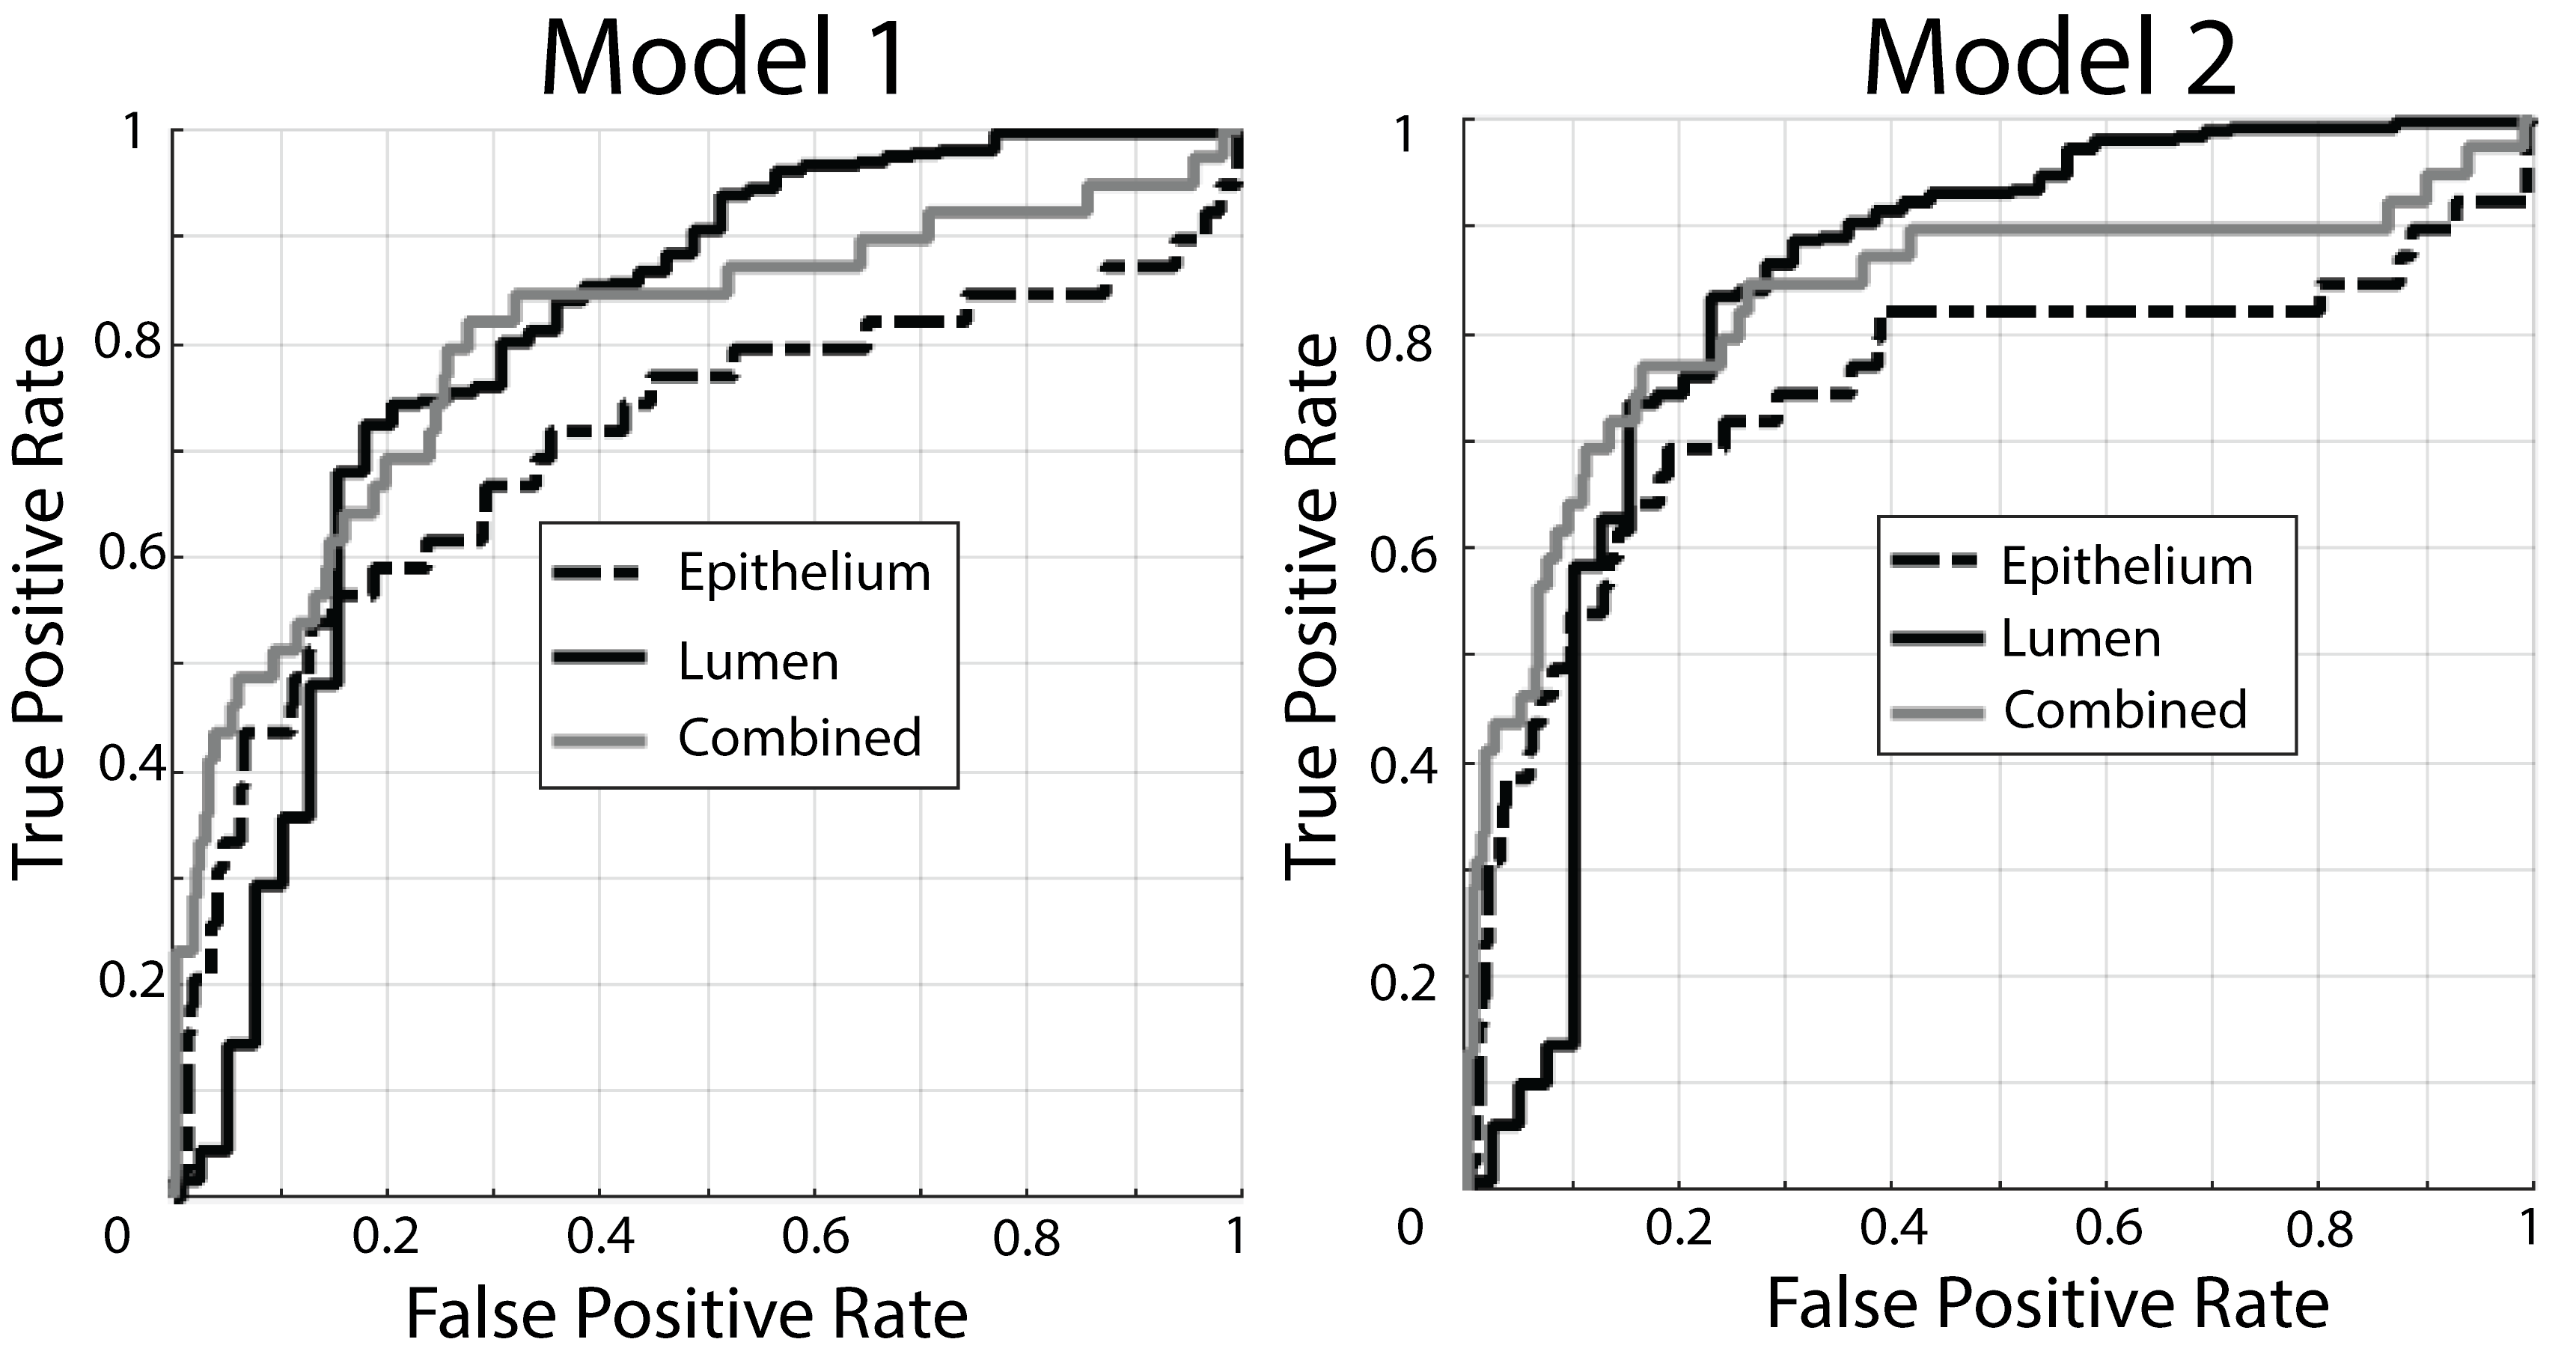
The segmentation accuracy validation (automatic vs. manual) revealed R=0.99 and R=0.72 (p<0.001) for lumen and epithelium respectively. The learning curve stabilized at 10 patients with a minimized root mean square error of 0.14, thus the size of the two independent training cohorts was set to 10, leaving 19 for test cohort 3. Figure 3 shows PiCT maps from 4 representative patients, where regions of increased epithelium density and decreased lumen density correspond with regions of high-grade cancer. All ANOVA comparisons were significant (p<0.05) and the resulting trends matched the trends from the histology (Figure 4). The ROC analysis performed on test cohort 3 to quantify differentiation of high grade tumors from other tissues yielded an AUC of 0.74 and 0.82 for Model 1 epithelium and lumen density respectively, and 0.82 when combined. Model 2 had an AUC of 0.70 and 0.80, for epithelium and lumen density respectively and a AUC of 0.80 for a combination of the two (Figure 5).Discussion
We present a radio-pathomics approach to mapping the predicted histo-pathological features using non-invasive imaging alone. This voxel-wise approach effectively generates new image contrasts for radiologist interpretation, which can potentially increase diagnostic confidence and guide biopsy and radiation treatment.Acknowledgements
Advancing a Healthier Wisconsin and the State of Wisconsin Tax Check off Program for Prostate Cancer Research. National Center for Advancing Translational Sciences, NIH UL1TR001436 and TL1TR001437, and RO1CA218144References
1. Siegel RL, Miller KD, Jemal A. Cancer statistics, 2016. CA Cancer J Clin. 2016;66(1):7-30.
2. Nguyen HS, Milbach N, Hurrell SL, et al. Progressing Bevacizumab-Induced Diffusion Restriction Is Associated with Coagulative Necrosis Surrounded by Viable Tumor and Decreased Overall Survival in Patients with Recurrent Glioblastoma. AJNR Am J Neuroradiol. 2016;37(12):2201-2208.
3. Pokorny MR, de Rooij M, Duncan E, et al. Prospective study of diagnostic accuracy comparing prostate cancer detection by transrectal ultrasound-guided biopsy versus magnetic resonance (MR) imaging with subsequent MR-guided biopsy in men without previous prostate biopsies. Eur Urol. 2014;66(1):22-29.
4. Kwak JT, Sankineni S, Xu S, et al. Correlation of magnetic resonance imaging with digital histopathology in prostate. Int J Comput Assist Radiol Surg. 2016;11(4):657-666.
5. Fehr D, Veeraraghavan H, Wibmer A, et al. Automatic classification of prostate cancer Gleason scores from multiparametric magnetic resonance images. Proc Natl Acad Sci U S A. 2015;112(46):E6265-6273.
6. Nguyen HS, Milbach N, Hurrell SL, et al. Progressing Bevacizumab-Induced Diffusion Restriction Is Associated with Coagulative Necrosis Surrounded by Viable Tumor and Decreased Overall Survival in Patients with Recurrent Glioblastoma. AJNR Am J Neuroradiol. 2016.
Figures