0770
Investigating the use of non-contrast enhanced Magnetic Resonance Multi-Sequence Thrombus Imaging (MSTI) to direct therapy in patients with acute iliofemoral Deep Vein Thrombosis1Academic Department of Vascular Surgery, King's College London, London, United Kingdom, 2Vascular Surgery Department, Guy's and St Thomas' NHS Foundation Trust, London, United Kingdom, 3School of Medicine, Pontificia Universidad Católica de Chile, Santiago, Chile, 4School of Biomedical Engineering and Imaging Sciences, King's College London, London, United Kingdom
Synopsis
Deep vein thrombosis (DVT) affects 1 in 1000 people and when the ilio-femoral segment is involved, over half will develop post-thrombotic syndrome (PTS). PTS can be debilitating for the patients and carries a huge health cost burden. Thrombolysis reduces the incidence of PTS, but is only successful in 60% of patients. There is no reliable method of identifying thrombi susceptible to lysis. We have developed a non-contrast-enhanced magnetic resonance multi-sequence thrombus imaging (MSTI) protocol that provides information on the structural composition of the thrombus and may be a reliable method of predicting thrombus lysability.
Introduction
Deep vein thrombosis (DVT) is a major public health issue with 10 million new cases globally each year1. It can lead to post-thrombotic syndrome (PTS), characterised by pain, swelling and when severe, ulceration, which is associated with a reduced quality of life and a significant socio-economic burden (~£1billion in the UK2).
Approximately 50% of patients develop PTS when the iliofemoral venous segment is affected. Catheter-directed thrombolysis (CDT) reduces the incidence of PTS in some patients with a fresh thrombus and short history of symptoms3,4. However, thrombus age, based on history, is often unreliable and may explain why lysis is currently only successful in 60% of patients. Prolonged lysis is also associated with bleeding complications in up to 20% of the cases3. A non-invasive imaging modality that distinguishes fresh fibrin-rich thrombi (those most likely to respond to lytic therapy) from more organised collagen-rich thrombi that are resistant to lysis, would therefore improve patient selection.
Thrombus T1 relaxation times correlate strongly with fibrin content and the amount of free ferric iron in a murine DVT model5. Magnetisation transfer ration (MTR) increases with thrombus age and is associated with thrombus protein (fibrin and collagen) content6. Apparent Diffusion Coefficient (ADC) also displays temporal change with thrombus age and is reflective of water diffusivity6.
The aim of this study was to assess whether multi-sequence thrombus imaging could improve clinical decision making by identifying venous thrombi that are more likely to lyse.
Methods
A multi-sequence thrombus imaging (MSTI) consisting of T1 mapping, magnetisation transfer and diffusion weighted imaging was carried out on patients with acute iliofemoral DVTs prior to thrombolysis. Patients were imaged using a 32-channel cardiac coil and a 3-Tesla MR scanner. The acquisition parameters are shown in Table 1.
Regions of interest were segmented manually. T1 relaxation time, magnetisation transfer ratio (MTR) and apparent diffusion coefficient (ADC) were calculated. Venography was used to assess success of lysis.
Results
33 patients recruited from the vascular unit were imaged (17 male, 16 female). Mean age was 43±14.7 years. Mean T1 relaxation time of non-lysed thrombi was higher compared to lysed thrombi (938±20ms and 786±32ms, P<0.001), mean MTR was similar between the groups (39±2 and 41±2, P=0.27) and mean ADC was higher in non-lysed compared to lysed thrombi (1.6±0.1 and 1.3±0.1, P=0.05) (Figure 1).
Receiver-operating characteristic (ROC) analysis showed a T1 area under the curve (AUC) of 0.72±0.02 (95%CI 0.67; 0.75), P< 0.001; MTR AUC of 0.59±0.02 (95% CI 0.55; 0.63), P<0.001 and ADC AUC of 0.61±0.02 (95% CI 0.56; 0.65), P<0.001 (Figure 2).
Based on the above analysis, the cut off values that best detect lysed thrombi for the three MRI measurements were calculated (710.8 ms for T1, 38.6% for MTR and 1.105 mm2/s for ADC). A combination of all three sequences had a higher sensitivity (74%) and specificity (95%) than any individual sequence alone. An example of MSTI images in patients with lysed and non-lysed thrombi and cut off values are illustrated in Figure 3.
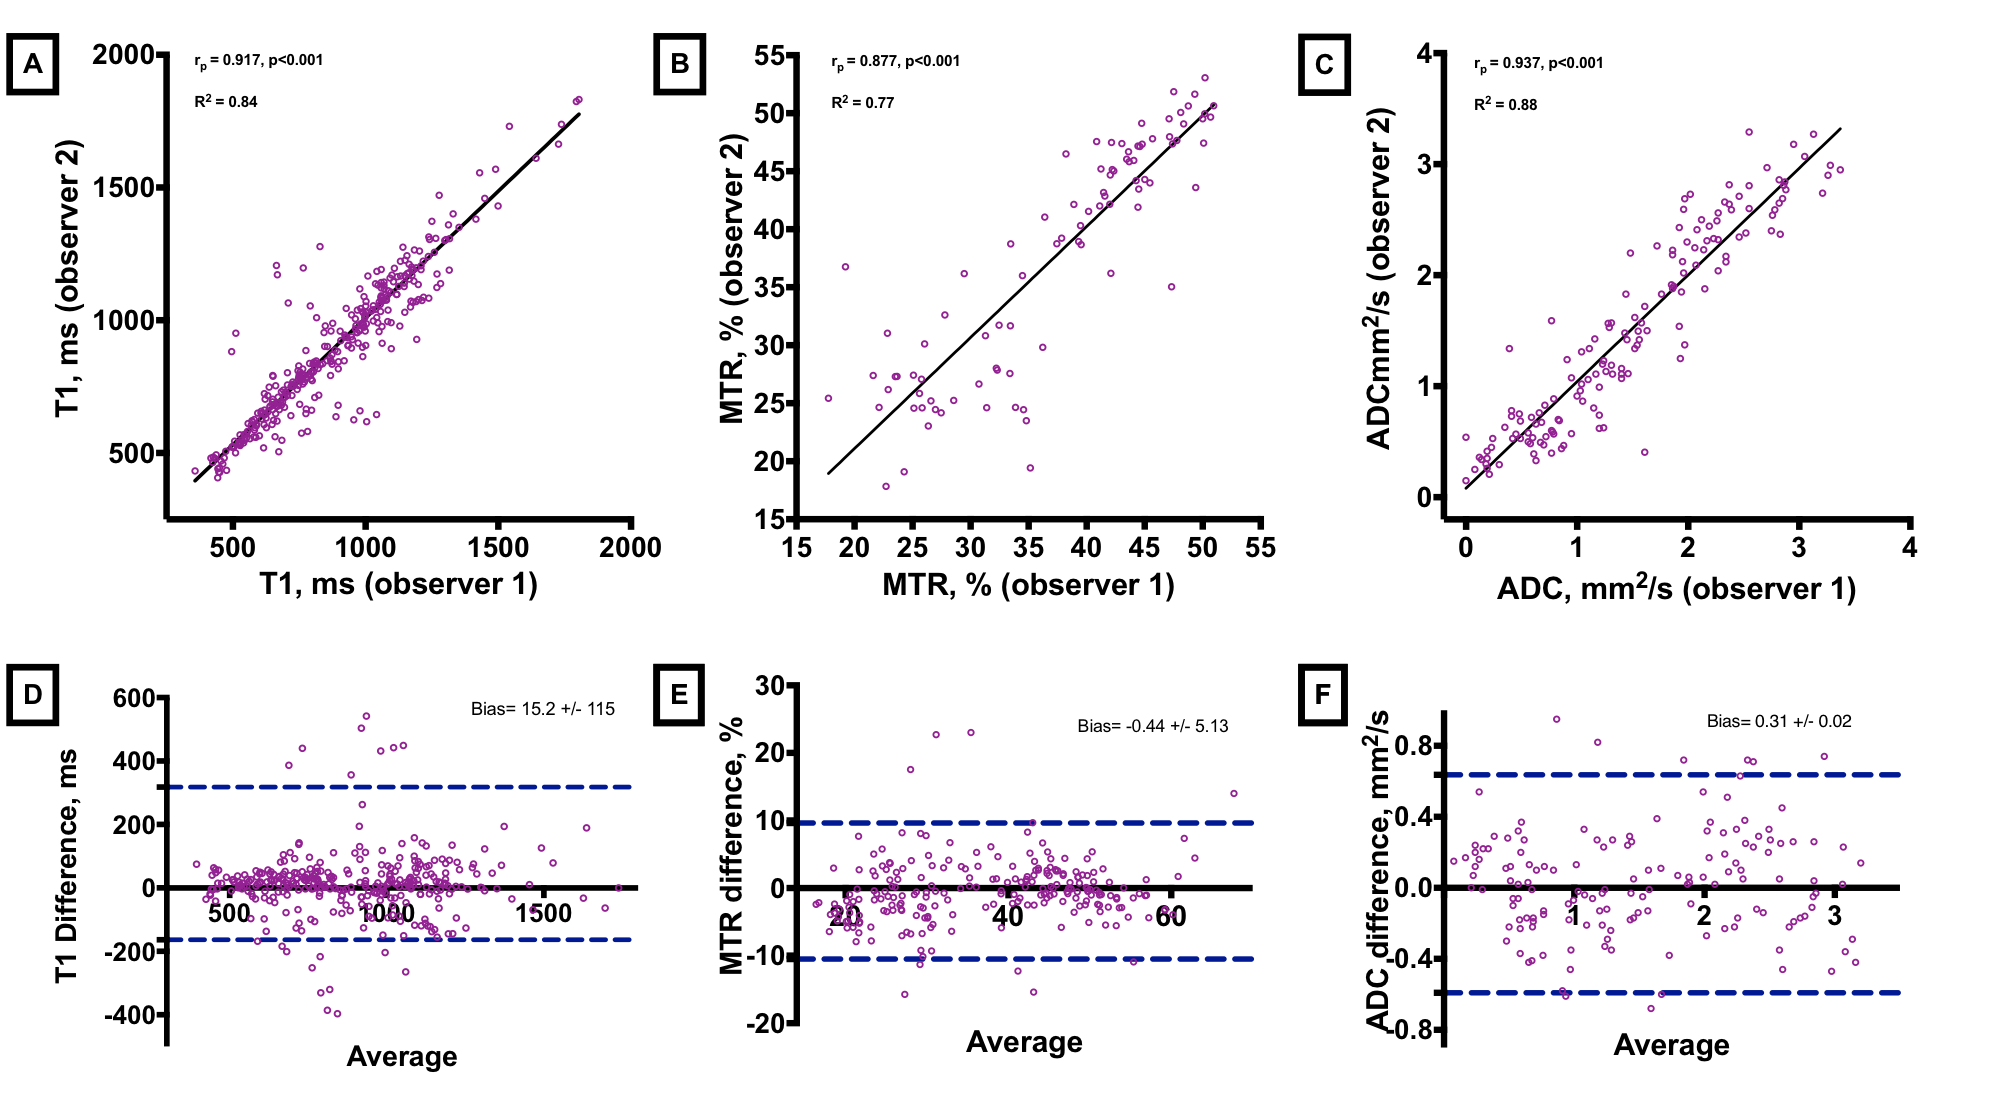
To test the accuracy of the image analysis protocol, a subset of 12 patients was analysed by two independent assessors. 2-tailed Pearson’s correlation (r) for T1 measurements was r=0.92 (P< 0.001), MTR r=0.88 (P<0.001) and ADC r=0.94 (P<0.001). Bland-Altman analysis showed strong agreement for T1, MTR and ADC with only 5.6%, 7% and 4.3% of measured pairs falling outside of two standard deviations respectively (Figure 4). Inter-observer agreement for assessing success of lysis on contrast venography was also good, Cohen k = 0.66 (95% CI, 0.58 to 0.74), P<0.001.
Discussion
We have translated MSTI, developed in our murine model of DVT, into patients with iliofemoral DVT and showed that it is possible to identify which thrombi would be susceptible to lysis. T1 relaxation time and ADC values were significantly different between fibrin-rich thrombi that responded to thrombolytic therapy and collagen-rich thrombi that did not. A predictive model incorporating T1, MTR and ADC appears to have a high sensitivity (74%) and specificity (95%) for assessing thrombus lysability. Examining the utility of this will be the focus of future studies. We hope that this non-invasive ‘virtual histology’ of the thrombus could reduce bleeding complications associated with lysis and shorten hospital stay by identifying patients that may not benefit from this treatment.Conclusion
A single non-contrast-enhanced MSTI scan appears to provide information regarding the structural composition of the thrombus in man and may have utility in identifying patients who would respond to lytic therapy.Acknowledgements
No acknowledgement found.References
1. Di Nisio M, van Es N, BULLER HR. Deep vein thrombosis and pulmonary embolism. The Lancet. June 2016.
2. Cohen AT, Agnelli G, Anderson FA, et al. Venous thromboembolism (VTE) in Europe. The number of VTE events and associated morbidity and mortality. Thromb Haemost. 2007;98(4):756-764.
3. Enden T, Haig Y, Kløw N-E, et al. Long-term outcome after additional catheter-directed thrombolysis versus standard treatment for acute iliofemoral deep vein thrombosis (the CaVenT study): a randomised controlled trial. Lancet. 2012;379(9810):31-38.
4. Haig Y, Enden T, Slagsvold C-E, Sandvik L, Sandset PM, Kløw N-E. Determinants of Early and Long-term Efficacy of Catheter-directed Thrombolysis in Proximal Deep Vein Thrombosis. Journal of Vascular and Interventional Radiology. 2013;24(1):17-24.
5. Saha P, Andia ME, Modarai B, et al. Magnetic resonance T1 relaxation time of venous thrombus is determined by iron processing and predicts susceptibility to lysis. Circulation. 2013;128(7):729-736.
6. Phinikaridou A, Andia ME, Saha P, Modarai B, Smith A, Botnar RM. In vivo magnetization transfer and diffusion-weighted magnetic resonance imaging detects thrombus composition in a mouse model of deep vein thrombosis. Circ Cardiovasc Imaging. 2013;6(3):433-440.
Figures