0769
Prediction for development of cerebral hyperperfusion after carotid endarterectomy using cerebral oxygen extraction fraction map based on quantitative susceptibility mapping at 7T1Neurosurgery, Iwate Medical university, Morioka, Japan, 2Ultrahigh Field MRI, Institute for Biomedical Sciences, Iwate Medical university, Yahaba, Japan, 3Diagnostic and Interventional Radiology, Hokkaido University Hospital, Sapporo, Japan, 4Cyclotron Reserch Center, Iwate Medical university, Takizawa, Japan
Synopsis
The aim of this study was to validate whether preoperative QSM-based OEF (OEFQSM) map at 7T could predict the development of postoperative hyperperfusion (HP) after carotid endarterectomy (CEA) in patients with internal carotid artery stenosis. In quantitative assessment, OEFQSM was significantly higher in the presence group than that in the absence group of HP. Receiver operating characteristic analysis showed the OEFQSM was a good indicator for predicting the development of HP after CEA when the suitable cut-off value. Finally, the present study demonstrated that preoperative OEFQSM map at 7T can identify patients at risk for HP after CEA.
PURPOSE
Cerebral hyperperfusion has been defined as a significant increase in ipsilateral cerebral blood flow (CBF) over baseline metabolic demand following carotid endarterectomy (CEA) in patients with carotid stenosis.1,2 Hyperperfusion tends to occur when CEA has been performed under conditions of misery perfusion, which is defined as elevation of the cerebral oxygen extraction fraction (OEF).3 A previous study reported that cerebral OEF maps based on quantitative susceptibility mapping (OEFQSM) using 7T magnetic resonance imaging (MRI) correlated with OEF maps on positron emission tomography.4 This study aimed to determine whether preoperative OEFQSM mapping at 7T could identify patients at risk for cerebral hyperperfusion after CEA.METHODS
We evaluated 77 patients with chronic ischemia due to unilateral internal carotid artery stenosis (≧70%). In all patients, 3-dimensional spoiled gradient recalled acquisition (TR/TE = 30/15 ms; flip angle = 20°; field of view = 256 mm2; matrix = 512×256; slice thickness = 2 mm; number of slices = 160; final voxel size after zero-fill interpolation = 0.5 mm3 ; scan time, 3 m 25 s) was performed with 7T MRI (Discovery MR950, GE Healthcare, Milwaukee, WI, USA) with quadrature transmission and 32-channel receive head coils. The slab was aligned in an orthogonal axial direction covering from the level of the superior cerebellar peduncle to the high convexity. QSM images were generated from all (magnitude as well as real/imaginary phase) source images using an in-house program with a multiple dipole-inversion combination with k-space segmentation.5 Regularization enabled sophisticated harmonic artifact reduction for phase data6 methods. Each OEFQSM value was calculated voxel-by-voxel according to the susceptibility difference defined by the following formula4,7:
OEFQSM=Δχ ×Pv / Δχdo× Hct
where Δχ (= QSM values) is the susceptibility difference between venous structures and surrounding brain tissues, Δχdo (= 0.18 ppm) is the difference in the susceptibility per unit hematocrit between fully deoxygenated and fully oxygenated blood,Hct (=0.45) is hematocrit, and Pv (= 7.0) is a correlation factor for partial volume effects7. The affected/normal ratio of OEFQSM values in the middle cerebral artery (MCA) region was calculated and defined as the OEFQSM ratio. To identify hyperperfusion, N-isopropyl-p-[123I]-iodoamphetamine single-photon emission computed tomography (123I-IMP SPECT) was performed within 14 days before and immediately after CEA. For each patient, post-CEA hyperperfusion was defined as CBF increase of ≧100% on 123I-IMP SPECT when compared with preoperative values for the MCA region ipsilateral to the side of surgery. We examined the difference in preoperative OEFQSM ratio between groups with the presence or absence of postoperative hyperperfusion. The accuracy (sensitivity, specificity, and positive- and negative-predictive values) of the OEFQSM ratio for prediction of the development of hyperperfusion was assessed with receiver operating characteristic (ROC) curve analyses.
RESULTS
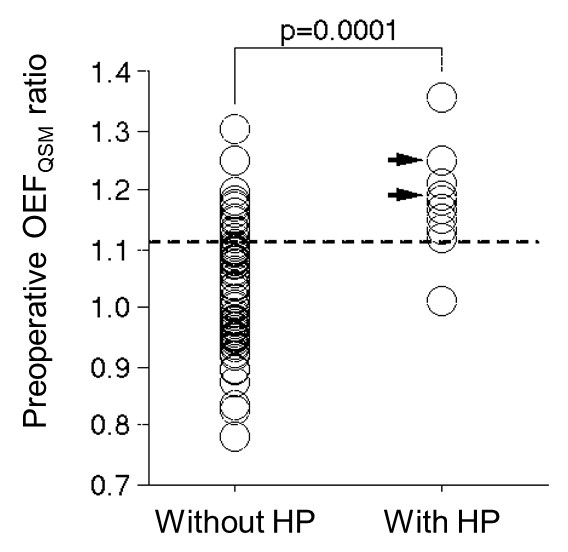
Ten patients (13%) showed post-CEA hyperperfusion on the postoperative hyper-perfusion on 123I-IMP SPECT. OEFQSM map was successfully obtained in all patients (Fig.1). In quantitative analysis, OEFQSM ratio was significantly higher in the presence group (1.18±0.090) than that in the absence group (1.03±0.102) of the hyper-perfusion (p=0.0001, Fig.2). From the ROC analysis, OEFQSM ratio showed the good accuracy (area under curve: 0.882 [95% CI, 0.788 to 0.944]) and it was a good indicator for predicting the development of the postoperative hyper-perfusion after CEA when the cut-off value was 1.12 (sensitivity: 90% [71 to 100]; specificity: 84% [75 to 92]; positive predictive value: 45% [23 to 67]; negative predictive value: 98% [95 to 100]).DISCUSSION
The high sensitivity and high negative predictive value suggest that the OEFQSM ratio is a suitable screening test for preoperative prediction of hyperperfusion after CEA. However, one patient with a false-negative result had hyperperfusion despite the absence of increased preoperative OEFQSM in the affected hemisphere. These findings suggest that hyperperfusion after CEA can even occur in patients with stage 1 ischemia; in these patients, precapillary resistance vessels dilate to maintain CBF when cerebral perfusion pressure is reduced, even when OEF is not yet elevated.8 The OEFQSM ratio showed a relatively low positive-predictive value (45%), suggesting that intraoperative acute global ischemia is involved in the pathogenesis of hyperperfusion after CEA.9CONCLUSION
Preoperative OEFQSM mapping at 7T can identify patients at risk for cerebral hyperperfusion after CEA.Acknowledgements
This work was partly supported by grants-in-aid for Strategic Medical Science Research (S1491001, 2014-2018) from the Ministry of Education, Culture, Sports, Science and Technology of Japan and a grant-in-aid for Scientific Research (15K10313) from the Japan Society for the Promotion of Science.References
1. Piepgras DG, et al. J Neurosurg 1988; 68:532–536.
2. Sundt TM, et al. Mayo Clin Proc 1981; 56:533–543
3. Ogasawara K, et al. J Neurosurg 2003; 99:504–510.
4. Uwano I, et al. Stroke 2017; 48:2136-2141.
5. Sato R, et al. Magn Reson Med Sci 2017;16:340-350.
6. Sun H, et al. Magn Reson Med. 2014;71:1151–1157.
7. Kudo K, et al. J Cereb Blood Flow Metab 2016;36:1424-1433.
8. Oshida S, et al. Neurol Med Chir (Tokyo) 2015; 55: 141-148.
9. Suga, et al. Stroke 2007;38:2712-2717.
Figures
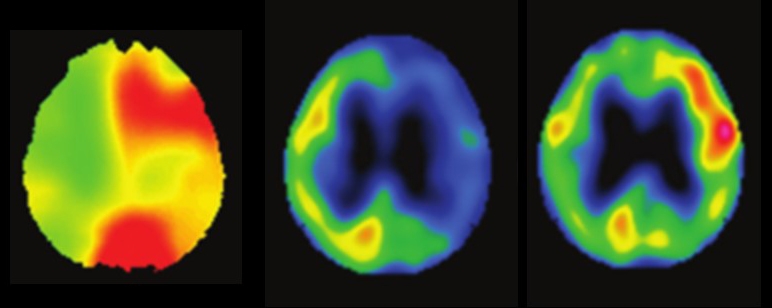
Fig.1 Typical case showing increased OEFQSM and 123I-IMP SPECT images of pre- and post-CEA. The postoperative image showed cerebral hyperperfusion. (77-year-old man with symptomatic left unilateral internal carotid artery stenosis)