0766
Rapid Carotid Artery T2 and T1 Mapping Using a Radial TSE and IR-FLASH Approach1Department of Medical Imaging, University of Arizona, Tucson, AZ, United States, 2Department of Biomedical Engineering, University of Arizona, Tucson, AZ, United States, 3Electrical and Computer Engineering, University of Arizona, Tucson, AZ, United States, 4Siemens Medical Solutions, Tucson, AZ, United States, 5Department of Surgery, University of Arizona, Tucson, AZ, United States
Synopsis
Defining carotid plaque characteristics predictive of stroke using non-invasive MR imaging is clinically relevant, but has been mostly limited to qualitative visualization of signal intensity in multi-contrast MR images. Here we present two robust and fast T2 and T1 mapping techniques based on radial data acquisition and demonstrate them in terms of carotid plaque characterization.
Introduction
Multi-contrast MRI provides unique information on plaque components associated with vulnerability to rupture (e.g., lipid rich necrotic core (LRNC), intraplaque hemorrhage (IPH), calcification)1-2. T2 and T1 mapping techniques are improvements over multi-contrast MRI because plaque features can be quantified3-7. Most T2 and T1 mapping techniques, however, suffer from low temporal resolution (2-4 time points), affecting accuracy of parameter estimation, or require long acquisition times (6-15 min), exacerbating artifacts due to motion and requiring registration over time points. Moreover, current T2 mapping techniques are based on multi-echo spin-echo methods resulting in T2 estimates affected by indirect echoes, and T1 mapping methods are based on variable flip angle acquisitions needing B1 field estimation.
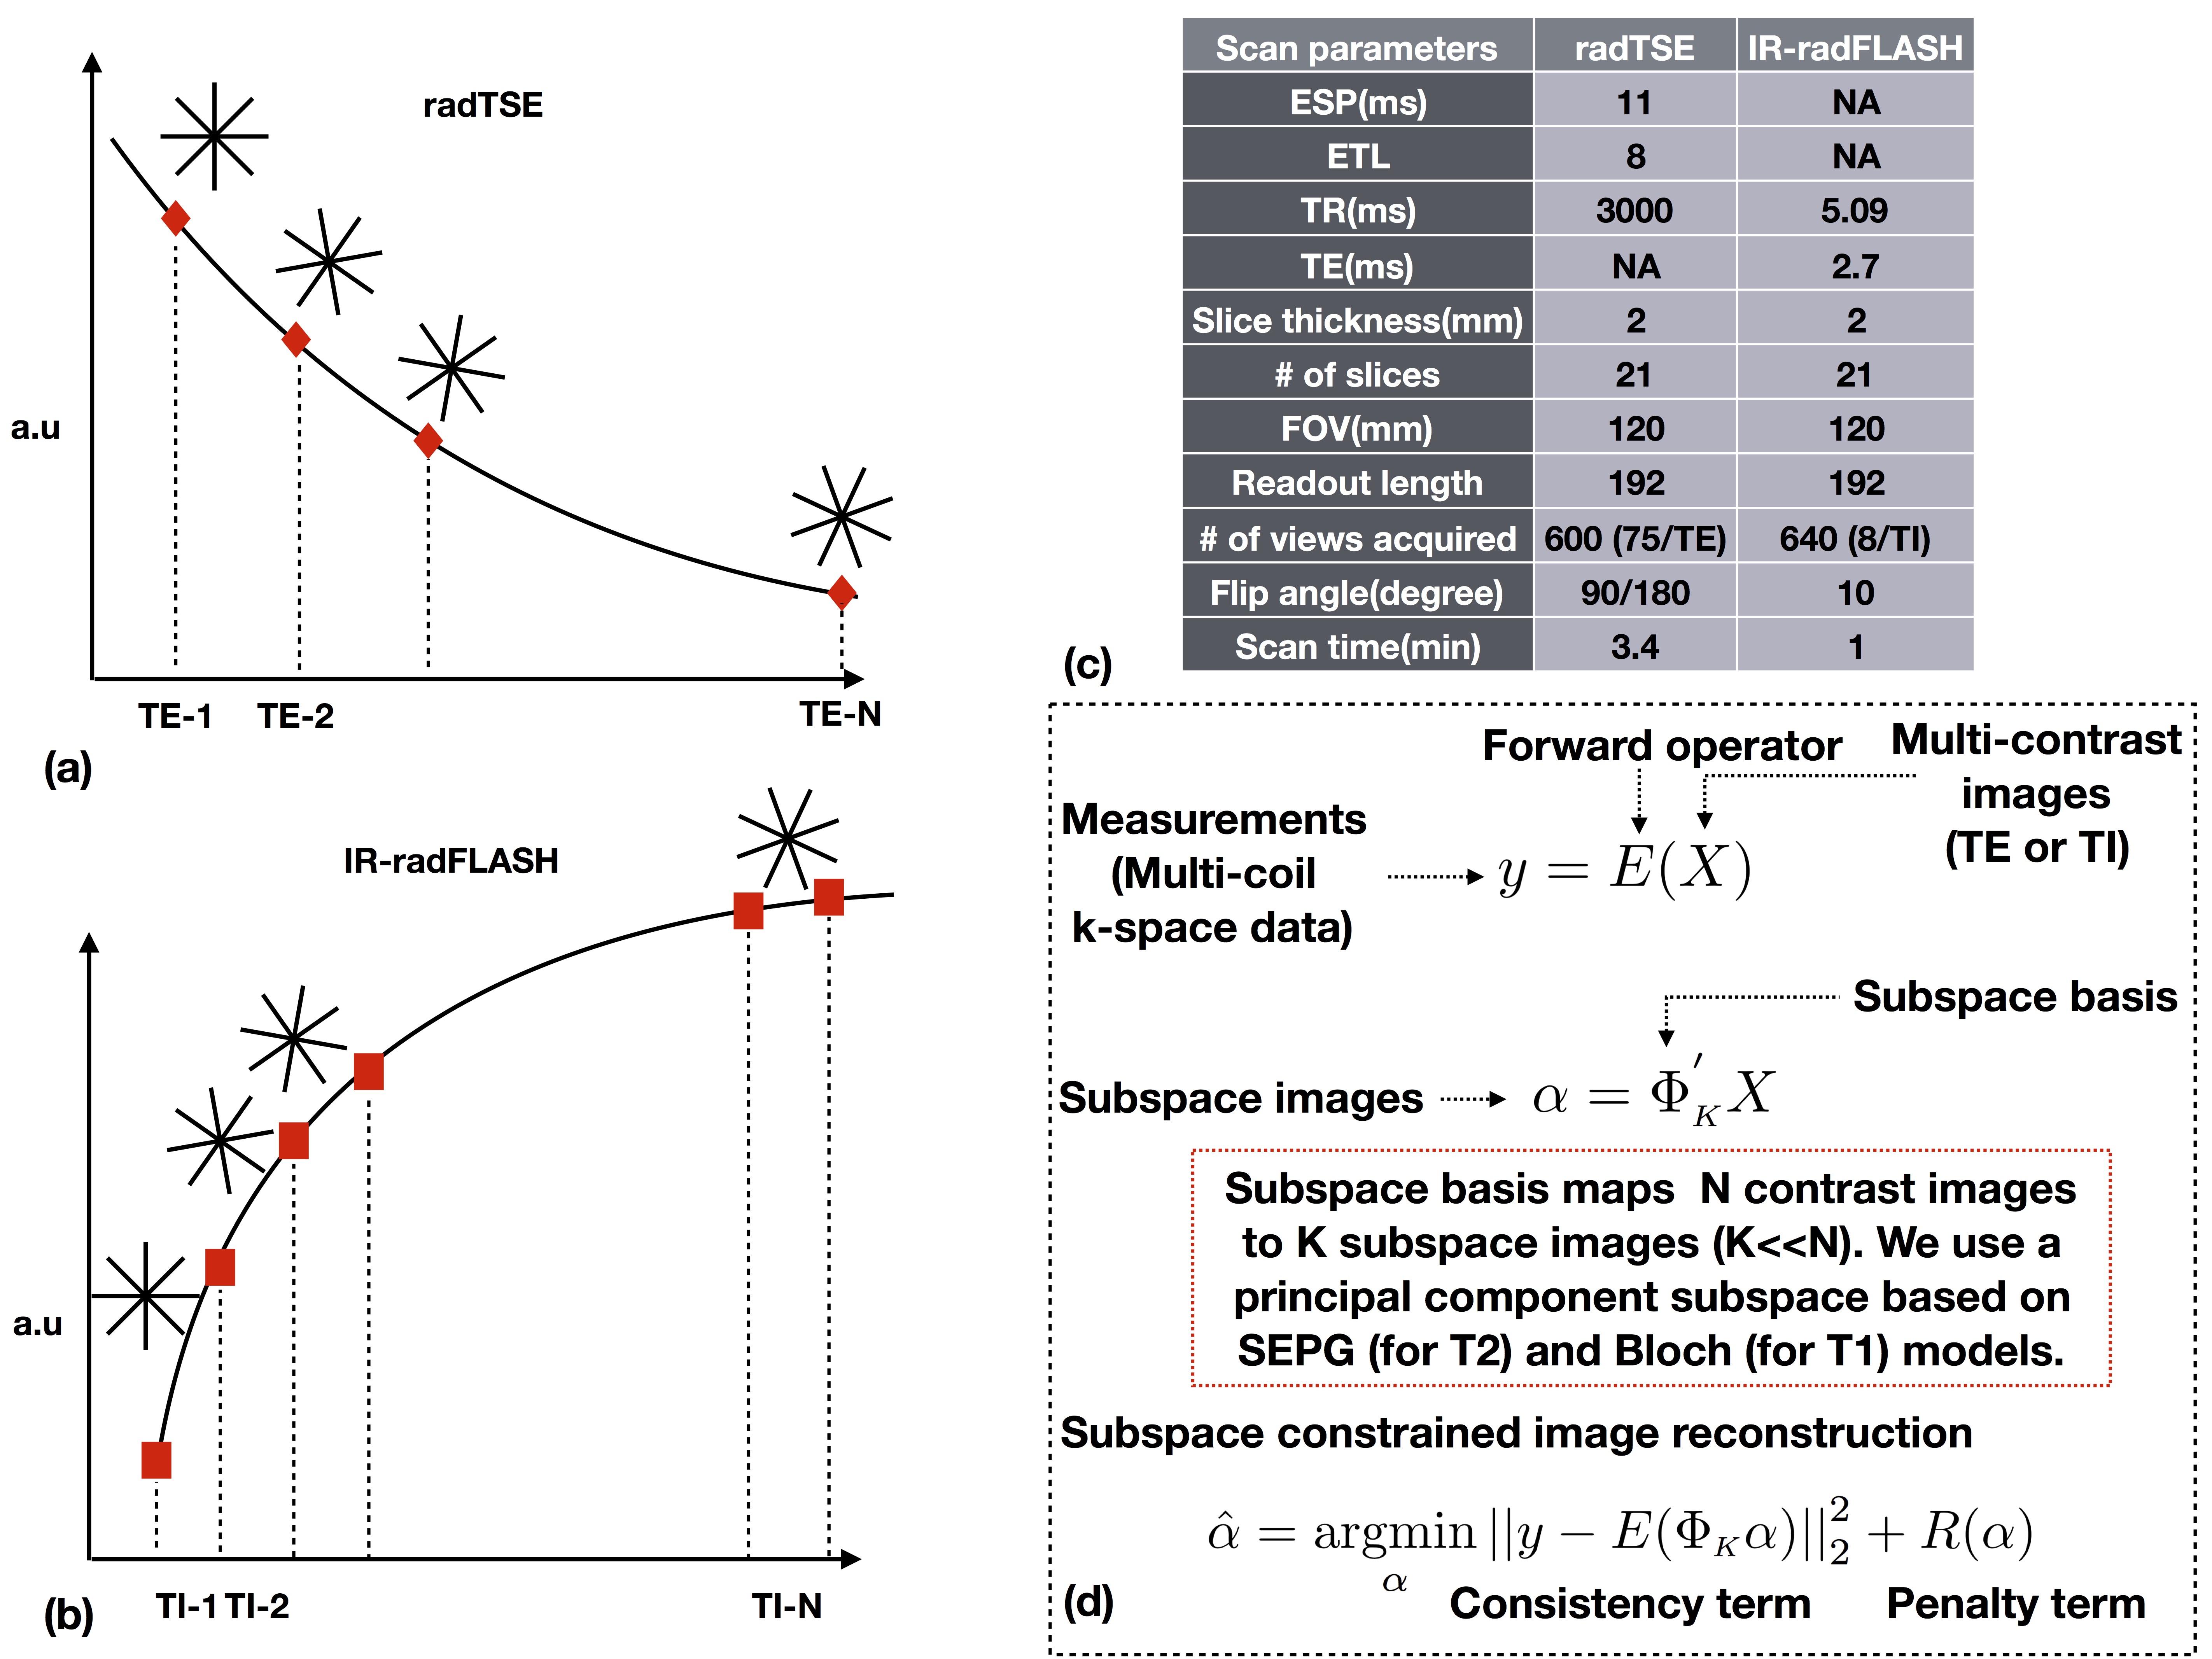
Here we present two techniques for parametric mapping of the vessel wall: a radial turbo spin-echo (radTSE) for T2 mapping and a radial inversion-recovery FLASH (IR-radFLASH) for T1 mapping. Both use a model-based reconstruction to extract T2 and T1 maps from highly undersampled data providing an efficient way for parametric mapping with high spatiotemporal resolution and excellent coverage (21 slices in 3.4 min for radTSE and 1 min for IR-radFLASH). TE (or TI) data sets are registered by the nature of the acquisition simplifying data processing. The signal model for T2 mapping accounts for indirect echoes, and, since we use constant flip angles for T1 mapping, there is no need for B1 correction. Radial sampling has the added advantage of being motion robust.
Methods
As illustrated in Figure 1, in radTSE, data for all TEs and all slices are acquired on each TR with all k-space data collected after multiple TRs. In IR-radFLASH, all radial views for each slice are continuously acquired after the inversion pulse; before reconstruction, 8 views are grouped into TI groups and the TI is approximated to the average of the group8. Image reconstruction is based on an iterative algorithm designed to exploit redundancy in the contrast images via a principal component subspace constraint (Figure 1d) 8,9. For radTSE, T2 decay is modeled using the slice-resolved extended phase graph (SEPG) model9 which accounts for imperfections in the refocusing pulses thus, incorporates the signal from indirect echoes. For IR-radFLASH, T1 recovery is modeled using the Bloch equation and pulse sequence parameters8. Subjects undergoing carotid endarterectomy (CEA) were imaged with radTSE and IR-radFLASH (implemented on a 3T Siemens-Skyra scanner), before surgery. Signal detection was achieved with a 7-element phased-array neck RF coil built for carotid imaging10. Plaques collected during surgery were fixed in formalin, partitioned lengthwise into ~2 mm segments and embedded in paraffin. Histology cross-sections sampled throughout the plaque were stained with H&E or trichrome.Results
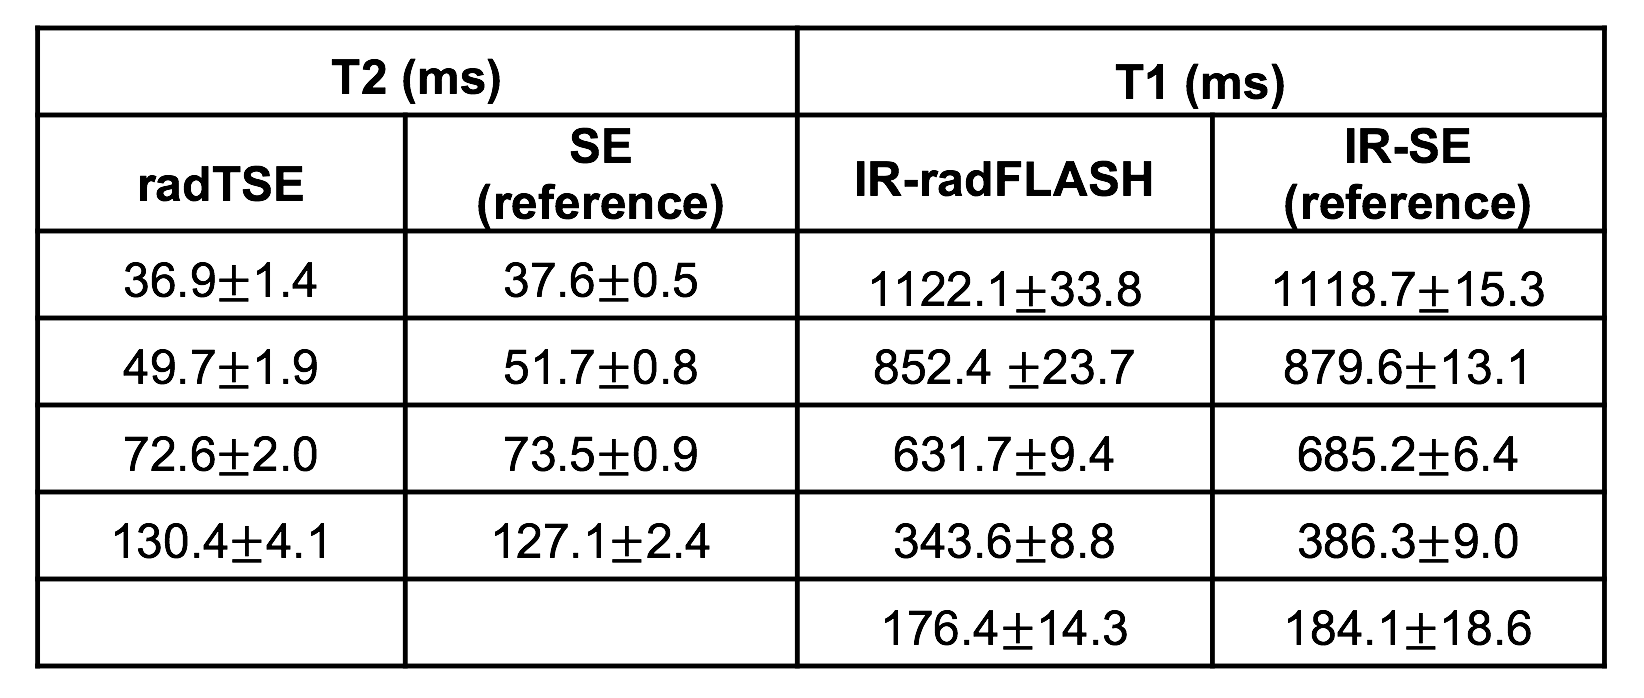
Table 1 shows T2 and T1 estimates obtained with radTSE and IR-radFLASH in gel/NiCl2 phantoms covering the T2/T1 range found in atherosclerotic plaques. T2 and T1 estimates match reference values.
Figure 2 shows a representative T2-weighted image (anatomical reference), and plaque T2, T1 and histology images for a symptomatic subject undergoing CEA on the left carotid artery. The MR images show a thrombus extending from the plaque into the lumen. Histology (which excludes the thrombus) reveals a large IPH, a fibrous cap and areas of fibrous tissue within the atheroma. The IPH has low T1 and T2 values relative to the rest of the plaque consistent with recent findings for a fresh IPH4. The thrombus T2/T1 values are higher than other plaque components.
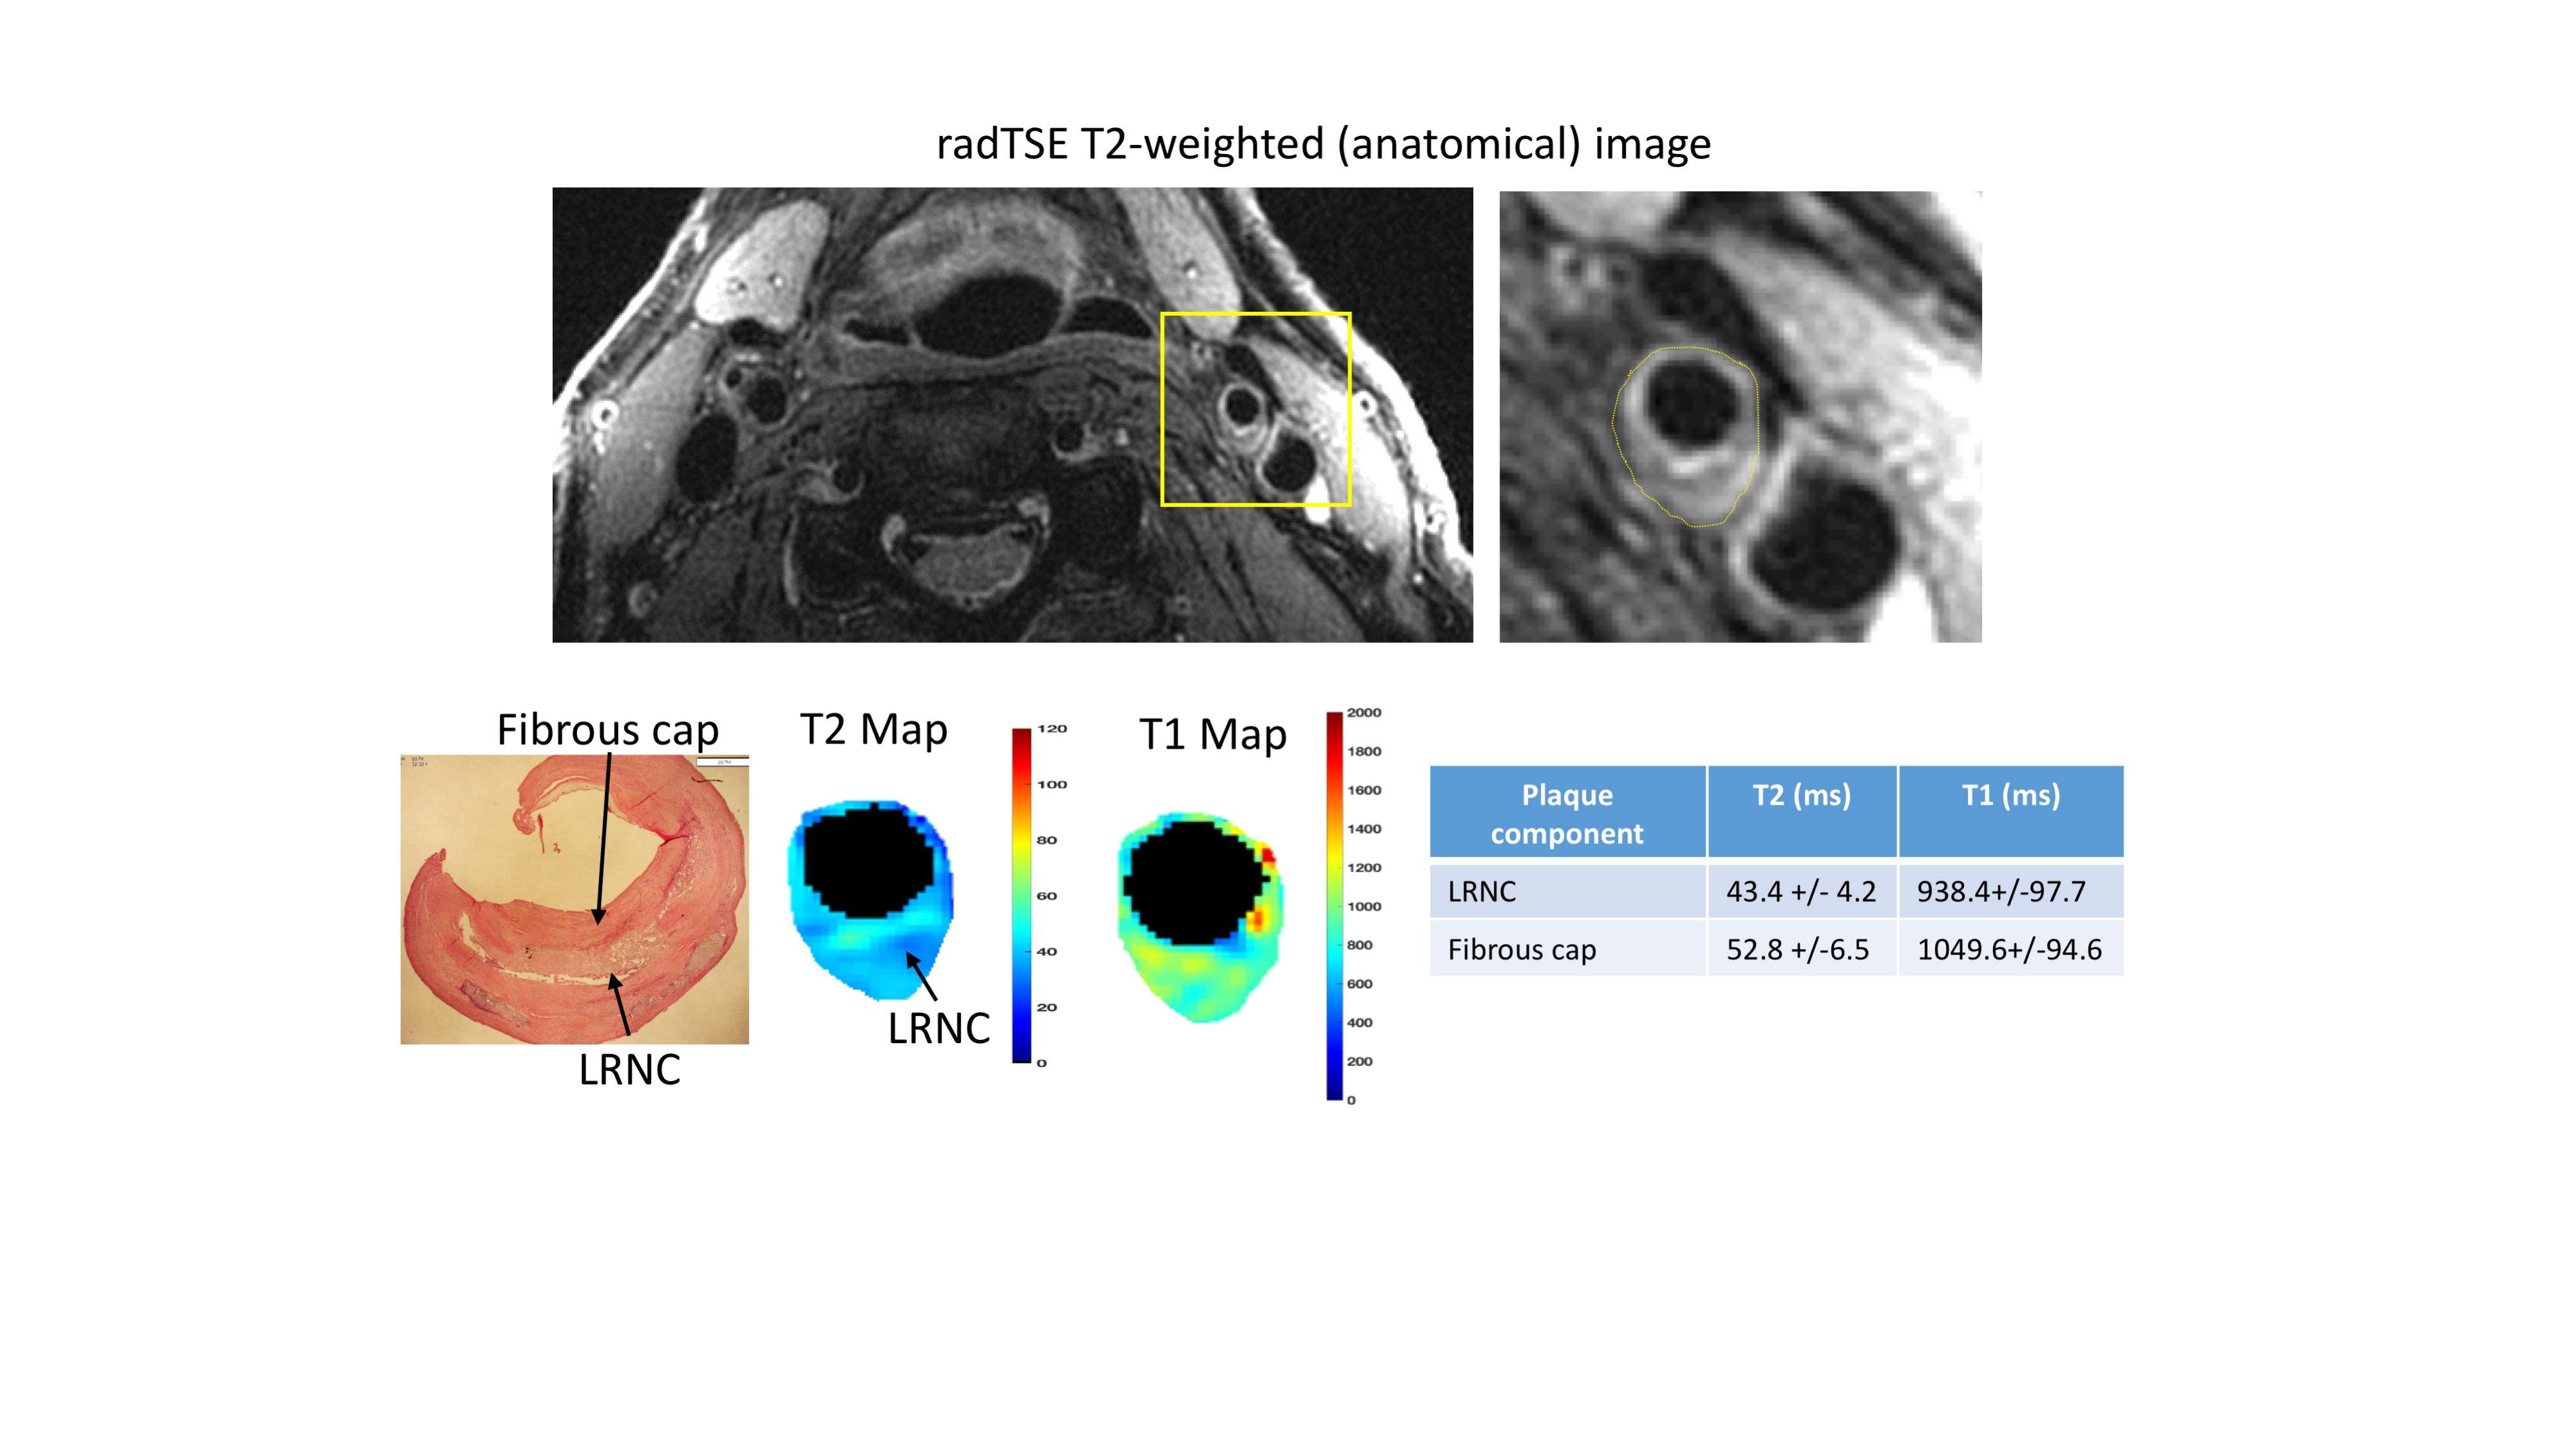
Figure 3 shows images from an asymptomatic subject. Histology shows a thick fibrous cap covering a LRNC; the latter has lower T2 values compared to the fibrous tissue, consistent with literature findings4,6.
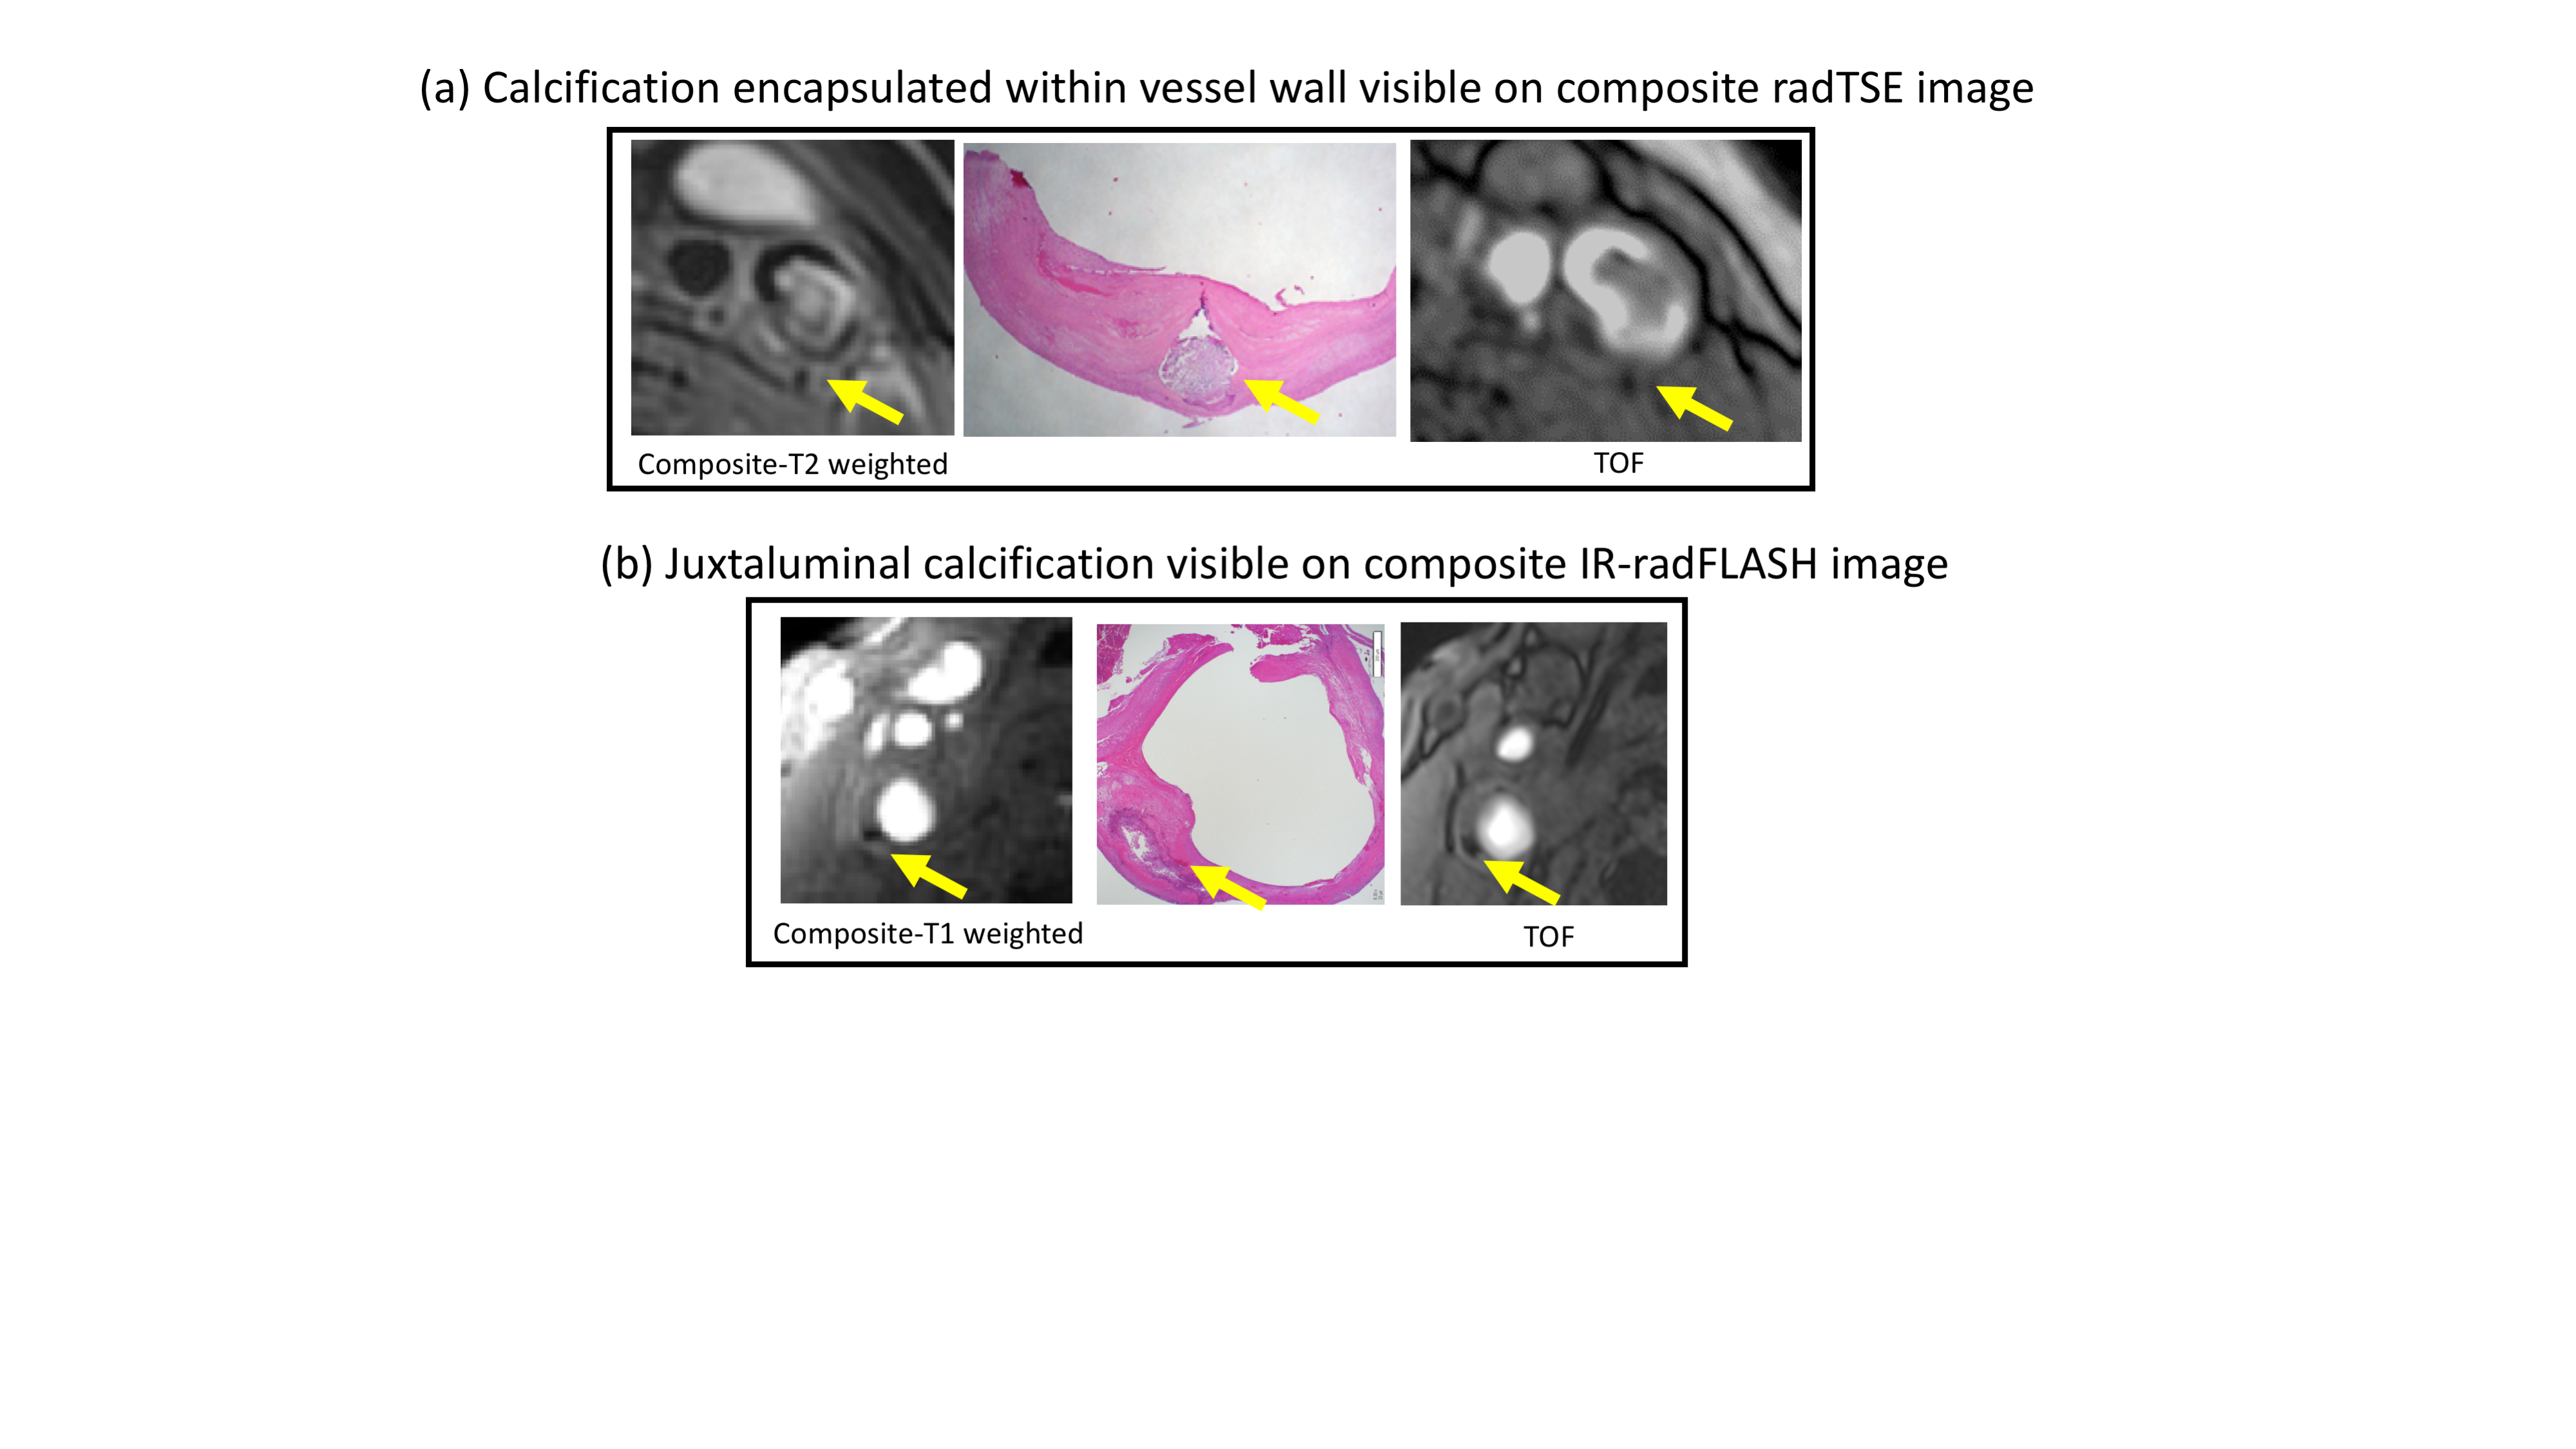
K-space data from radTSE (or IR-radFLASH) can be combined to generate a composite T2 (or T1) weighted image. This image is ideal for evaluating calcification because it captures the lack of signal of calcium better than any single TE (or TI) image. This is illustrated in Figure 4 where the composite T2 image identifies calcium when it is resolved from the (dark) signal from lumen, whereas the composite T1 image identifies calcium closer to the lumen due to its excellent contrast against the high signal from blood.
Conclusion
We showed two techniques for carotid imaging that take advantage of undersampled radial data to yield T2 and T1 maps from data acquired with high spatial and temporal resolution in less than 5 minutes. The high temporal resolution of the techniques, combined with accurate signal modelling, render accurate parameter estimation. The speed of the techniques, robustness to motion, and accuracy of parameter estimation makes them attractive for clinical translation.Acknowledgements
This work was supported by the Arizona Health Sciences Center Translational Imaging Program Project Stimulus (TIPPS) Fund and by the Technology and Research Initiative Fund (TRIF) Improving Health Initiative. The authors would also like to thank Dennis Parker, PhD and J. Rock Hadley, PhD from the University of Utah for building the anterior neck RF coil used in this study.References
1] Cai J-M, Hatsukami TS, Ferguson MS, Small R, Polissar NL, Yuan C. Classification of human carotid atherosclerotic lesions with in vivo multicontrast magnetic resonance imaging. Circulation 2002;106:1368–73.
[2] Usman A, Sadat U, Graves MJ, Gillard JH. Magnetic resonance imaging of atherothrombotic plaques. J Clin Neurosci 2015;22:1722–6.
[3] Mihai G, Giri S, Sharkey-Toppen TP, Raman SV, Rajagopalan S, Simonetti OP. Quantitative T1, T2 and T2* mapping of carotid artery normal wall and atherosclerotic plaque. ISMRM, 2011, 3311.
[4] Biasiolli L, Lindsay AC, Chai JT, Choudhury RP, Robson MD. In-vivo quantitative T2 mapping of carotid arteries in atherosclerosis patients: segmentation and t2 measurements of plaque components. JCMR, 2013, 15(69), 1-9.
[5] Chai JT, Biasiolli L, et al. Quantification of lipid-rich core in carotid atherosclerosis using magnetic resonance T2 mapping. JACC: Cardiovascular Imaging, 2017, 10, 747-756.
[6] Alkhalil M JT, Biasiolli L, et al. Quantification of carotid plaque lipid content with magnetic resonance T2 mapping in patients undergoing carotid endarterectomy. Plos One, 2017, https://doi.org/10.1371/journal.pone.0181668.
[7] Coolen BF, Poot DHJ, Liem MI, Smits LP, Gao S, Kotek G, Klein S, Nederveen AJ. Three-dimensional T1 and T2 mapping of the carotid artery: Sequence design and in vivo feasibility. MRM, 2016, 75, 1008-1017.
[8] Li Z, Berman BP, Galons JP, Bilgin A, Altbach MI, Martin DR. Rapid high-resolution T1 mapping using highly accelerated radial steady-state free-precession acquisition. ISMRM, 2016, 4196.
[9] Huang C, Bilgin A, Barr T, Altbach MI. T2 relaxometry with indirect echo compensation from highly undersampled data. MRM, 2013; 70(4):1026-1037.
[10] Beck MJ, Parker DL, et al. Interchangeable neck shape-specific coils for a clinically realizable anterior neck phased array system. MRM, 2017, DOI 10.1002/mrm.26632
Figures