0765
Automated 4D Flow Conservation Utilizing Adjacency MatricesCarson Anthony Hoffman1, Oliver Wieben1,2, and Gabe Shaughnessy1
1Medical Physics, University of Wisconsin Madison, Madison, WI, United States, 2Radiology, University of Wisconsin Madison, Madison, WI, United States
Synopsis
4D flow magnetic resonance imaging (MRI) can provide a way to analyze both the anatomical and hemodynamic properties related to complex vessel networks. Using basic principles related to flow conservation the entire vessel networks data can be used to help improve local flow calculations. A Bayesian approach is utilized with a Markov Chain Monte Carlo where flow conservation is enforced to obtain, for a complete vascular network, estimates of mean flow and flow uncertainty. The estimated data results in a lower flow uncertainty overall and can allow for localization of potential erroneous branches in the initial data.
Purpose
4D flow magnetic resonance imaging (MRI) enables the acquisition of complex velocity fields in-vivo from intricate vascular networks. The recent addition of product 4D flow sequences from multiple vendors has increased the need for improved post-processing tools to analyze and visualize these complex and dense data sets, preferably in semi-automated manner and with consistency checks. Common post-processing techniques utilize local information from planes in the computation of parameters such as flow, area, mean velocity, etc. Here we expand on our previous work utilizing adjacency matrices with complex vessel networks for flow conservation1 to improve local flow calculations by using the entire vessel network. This novel method has the ability to identify vessel branches with erroneous flow while computing the best-fit flow network, which enforces flow conservation throughout the entire system. This can allow for a reduction in the uncertainty of all flow measurements in the vessel network and help increase the precision of local flow quantities.Methods
Three cranial
scans were acquired with patient consent and IRB approval. Imaging was
performed on a clinical 3T scanner (MR750, GE Healthcare) using 4D flow MRI
with an under-sampled radial acquisition, PC VIPR2 with large
coverage (22x22x22cm) and high spatial resolution (0.67 mm isotropic). The
post-processing chain is shown in Figure 1. Segmentation of the left and right
arterial vessel networks were completed with Mimics (Materialize). Vessel
centerlines were computed and labeled automatically using a vessel thinning
algorithm in a custom Matlab tool. Flow quantification at all centerline
locations was computed from automatically generated orthogonal planes from the
centerlines. The average flow values and associated standard deviation per
branch were computed using all centerline values. Associated directed adjacency
matrices with flow directionality were created based on the labeled centerline
vessel network and velocity information. Vessel thinning, flow quantification
and adjacency matrices formation were completed all with in-house software
tools (MATLAB 2016a). A Bayesian approach is utilized with a Markov Chain Monte
Carlo (MCMC) to fit the data to a model enforcing flow conservation at each
vessel junction. The flow conservation
restriction effectively reduces the number of independent degrees of freedom,
thereby tightening the uncertainty in each vessel. The outputs from the best
fit model include estimated flow values and an attached uncertainty of the estimation.
The best fit results were then compared to the initial flow values in both a
quantitative and qualitative manner. Results
Best fit flow estimations for all of the vessel networks were successfully computed using the MCMC method. Initial flow values were compared to the estimated flow values for every branch segment. We computed the pull, uncertainty improvement, and fractional deviation for all networks with the pull RMS and average improvement values reported in Table 1. Visualization of the calculated statistical parameters was completed with bar graph plots, color and data encoded node networks, and color encoded anatomical vessels. Examples of each display method can be seen in Figures 2 – 4. The uncertainty improvements in flow calculations ranged from 1.45 to 1.77 with an average of 1.58. Larger variations between the input flows and estimated flows occurred with higher frequency in shorter vessel segments. The overall reduction of flow uncertainty and initial branches with high variation can easily be seen with the color encoded anatomical vessel display (Figure4).Discussion
We were able to compute a best fit flow conservation network with associated uncertainties from complex vessel flow systems acquired using 4D flow MRI. In all of the cranial cases analyzed there was an average reduction in the uncertainty of flow measurements allowing for better flow quantification. Multiple visualizations of the dense data sets allowed for easy identification and localization of potential erroneous branch segments in the initial input data. The uncertainty associated with the flow measurements has not been separated into to area and velocity components. This does not affect the overall estimations of best fit as long as majority of the system has reliable flow measurements.Conclusion
The application of this new method to flow networks allows for both conservation of flow and reduction in measurement uncertainty. With majority of vessel networks being structured as a branching tree this novel technique can be easily adapted for use throughout the body (cardiac, hepatic, renal, etc.). Identification of suspicious flow vessel segments is highlighted by the use of this technique and display methods. Using the data from an entire vessel network to help improve local flow measurements was completed successfully in this work. The extension of this method to improve other variables related to flow parameters is currently in progress.Acknowledgements
No acknowledgement found.References
1) Hoffman, C. ISMRM. 2017; Abstract ID 4758 2) Johnson, K. M. et al Magnetic Resonance in Medicine. 2008; 60(6), 1329-1336.Figures
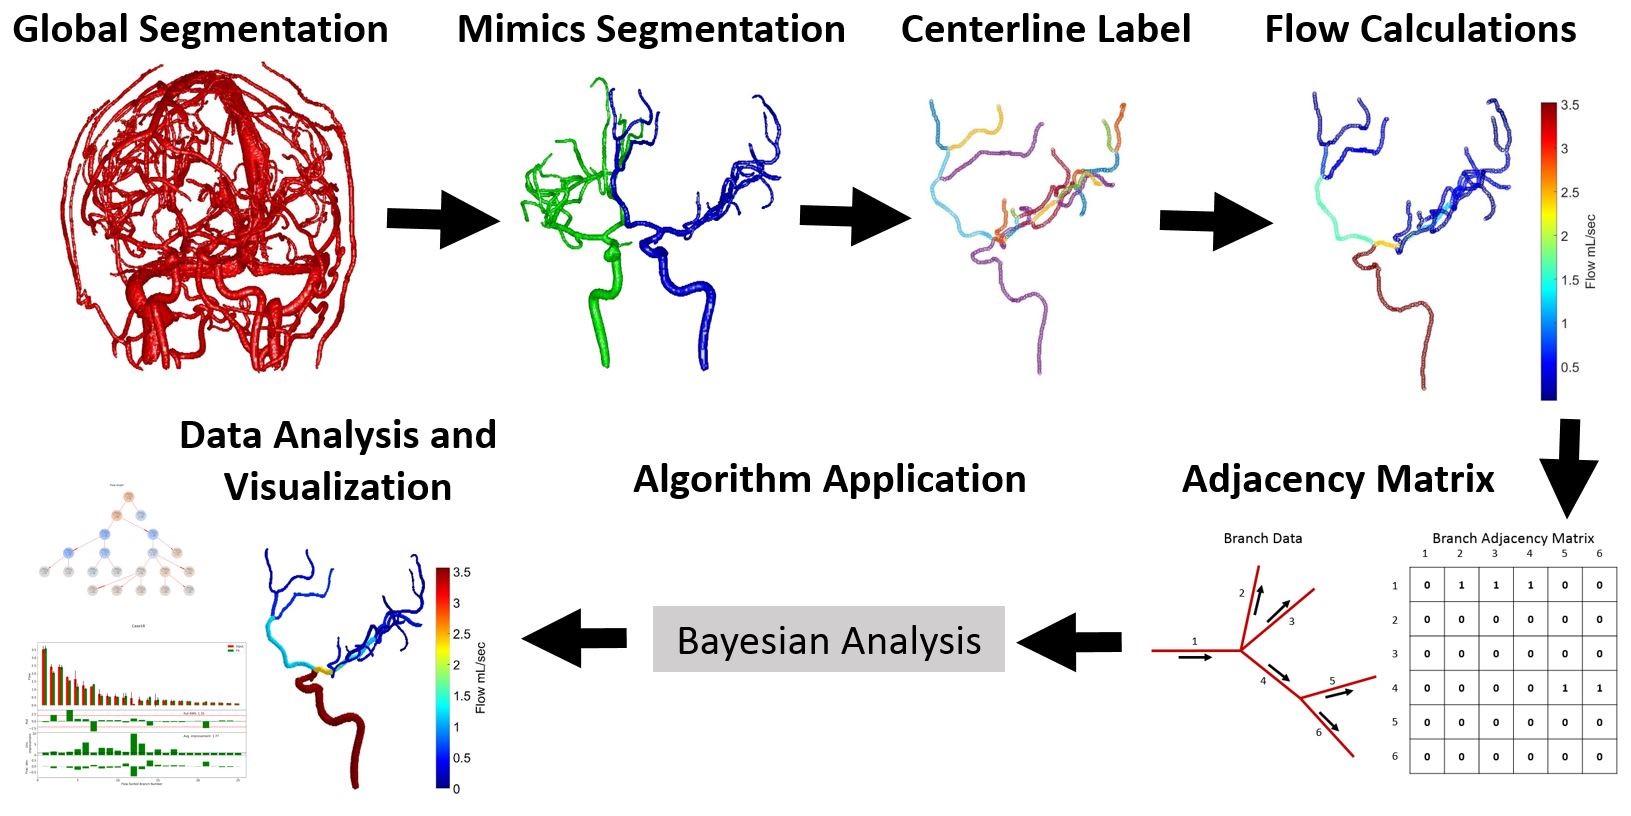
Figure 1: The
Initial segmentation is completed with a global threshold then manual
segmentation in order to get a vessel branching that is expected to conserve
flow. Average flow calculations, flow uncertainties, and the directed adjacency
matrix are fed into a Bayesian fit which applies a Markov Chain Monte Carlo
algorithm. Visualization and quantification of output data is then completed by
three different methods: bar graph plots, color and data encoded node networks,
and color encoded anatomical vessels.
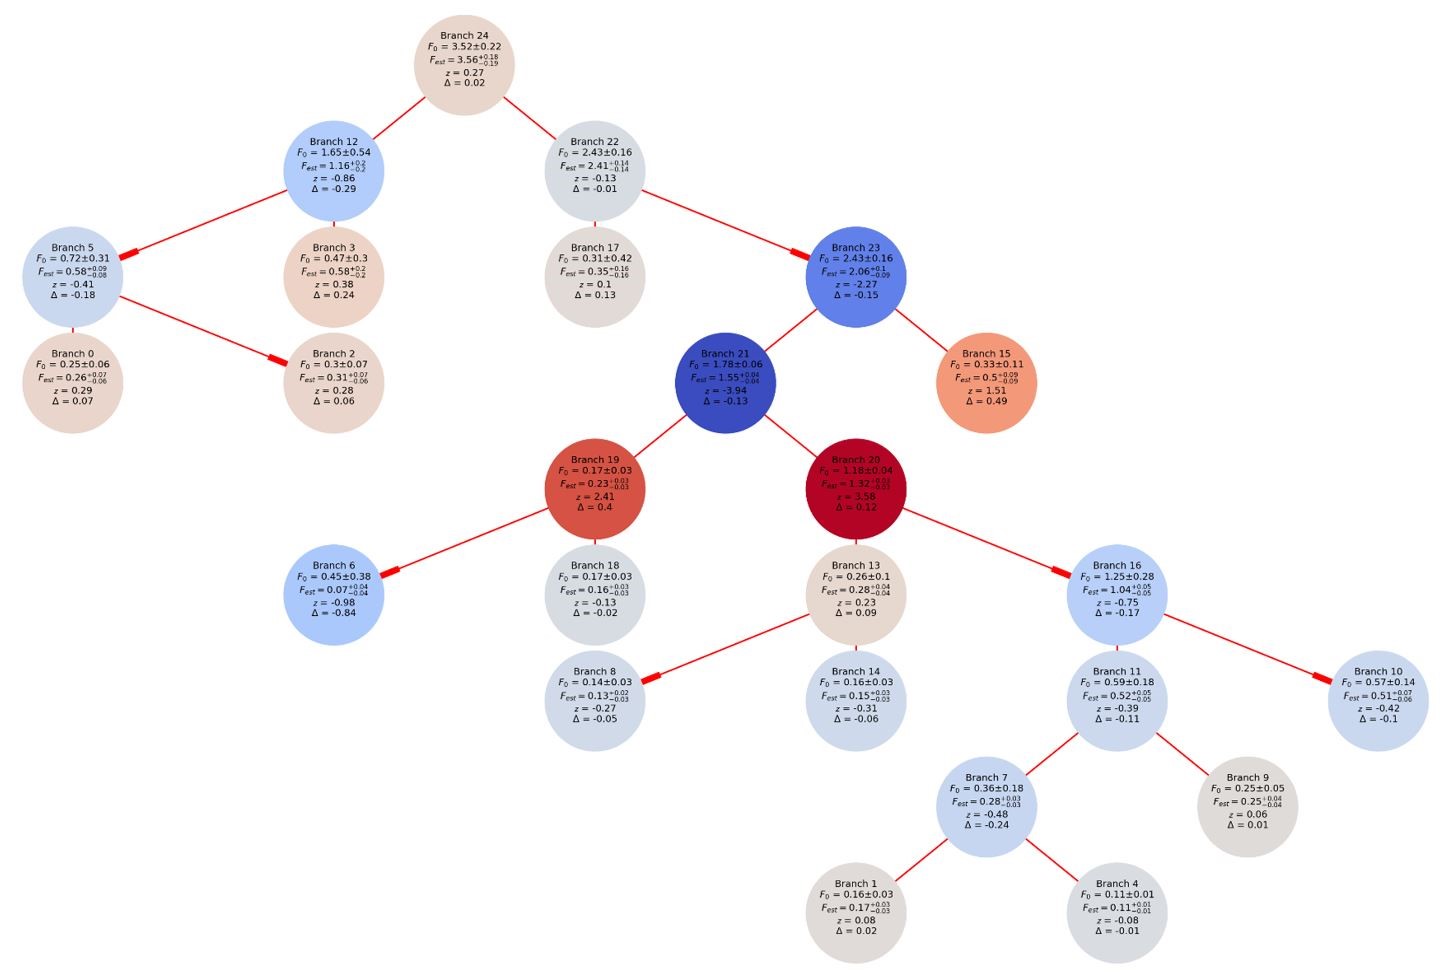
Figure
2 Color and data encoded branch networks provided a way to present all of the
computed variables in a single figure. The circles represent branches and the
red lines indicate the connections between branches. The color intensity
represents the level of deviation from the initial input flow value. The red or
blue coloration indicates if the variation was in a positive or negative
direction. All of the input and estimated flow values with associated statistics
are presented as text in each circle.
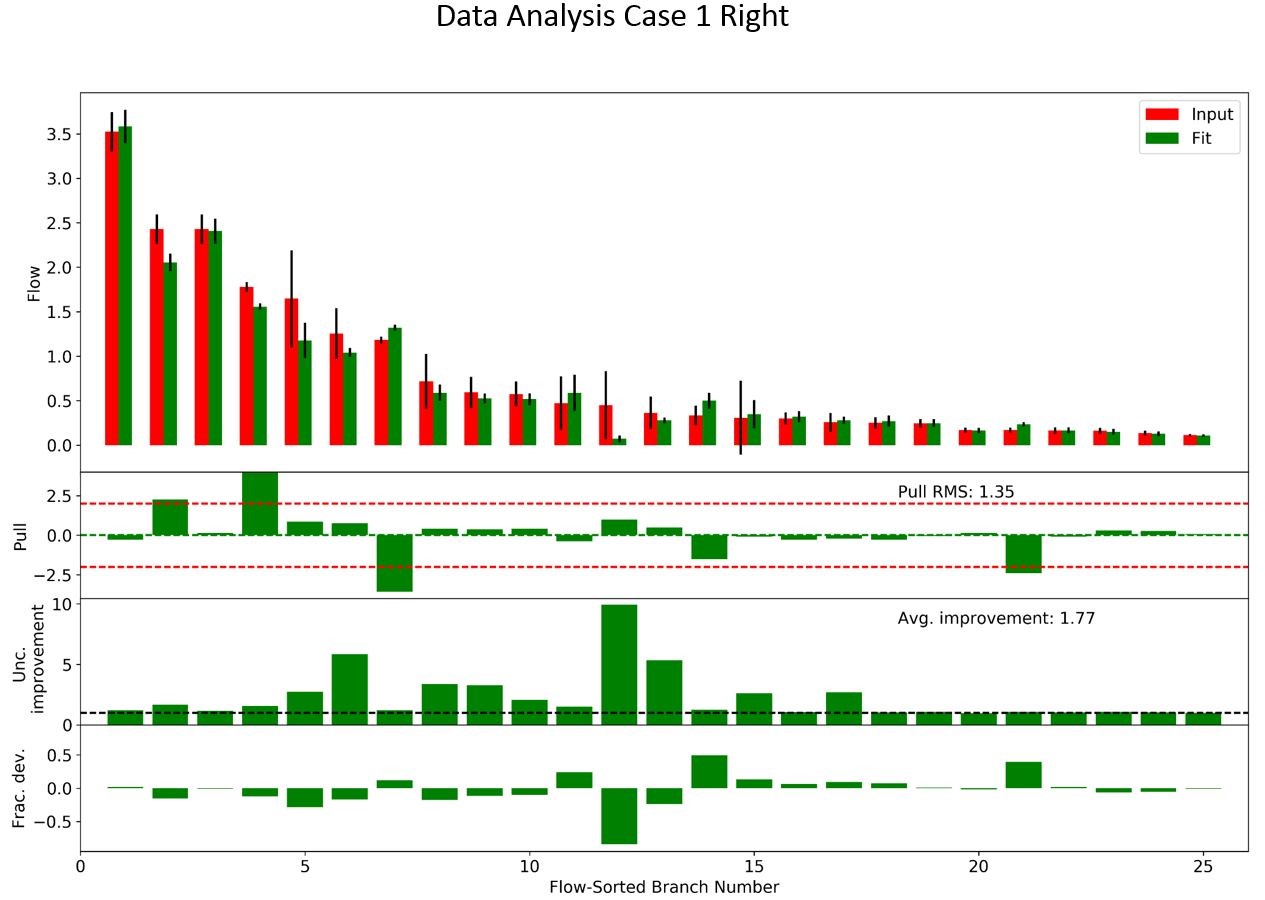
Figure 3 The
bar charts show the comparison between input flow values and best fit flow
values with an ordering which is based on the initial flow estimate. The pull is computed as the difference of
input and fit flow values divided by the initial standard deviation. The
uncertainty improvement is the ratio of the initial standard deviation to the
fit standard deviation, and is a measure of the improvement afforded from the
Bayesian fit. The fractional deviation is the relative change of the fit flow
estimate relative to the initial flow.
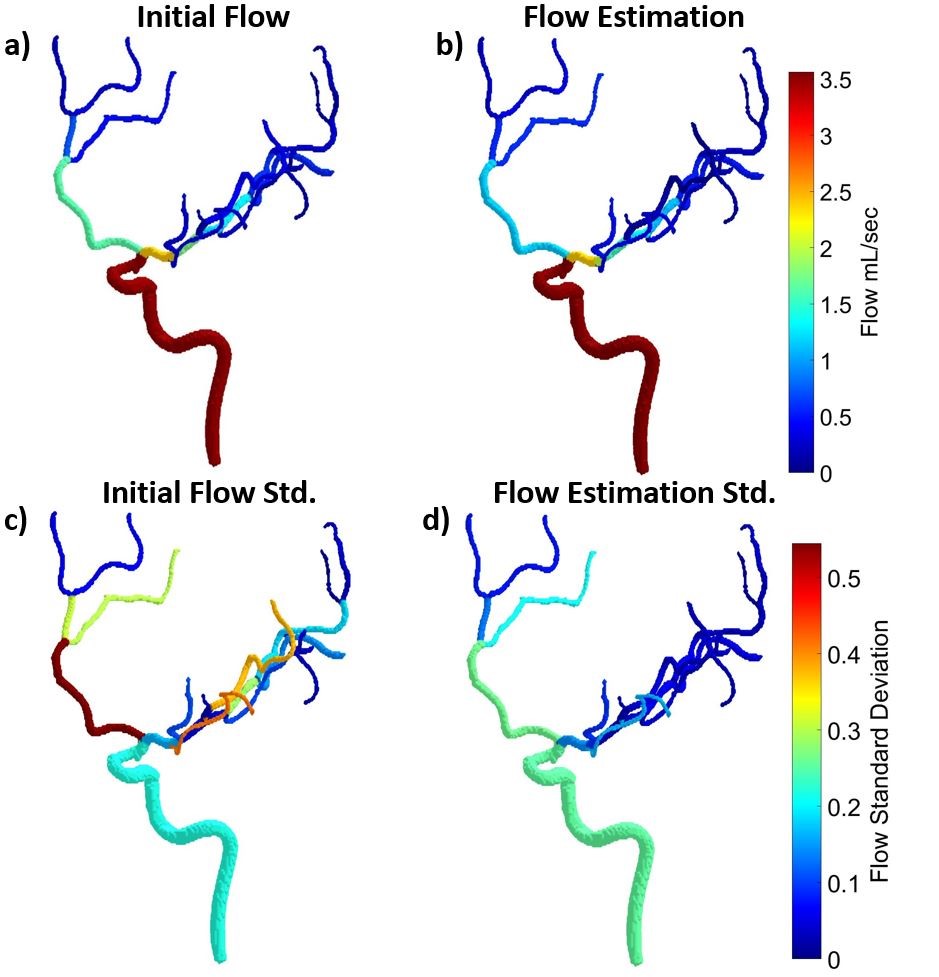
Figure
4: A color encoded mask for (a) input flow and (b) best fit flow estimations were
completed for all cases to localize where major flow changes were occurring. The
initial standard deviation of flow for each branch (c) and the uncertainty
estimate from the fit (d) were computed to highlight initial branches with
large variation in flow through the vessel. A global reduction in uncertainty
in flow measurements can clearly be seen between (c) and (d).
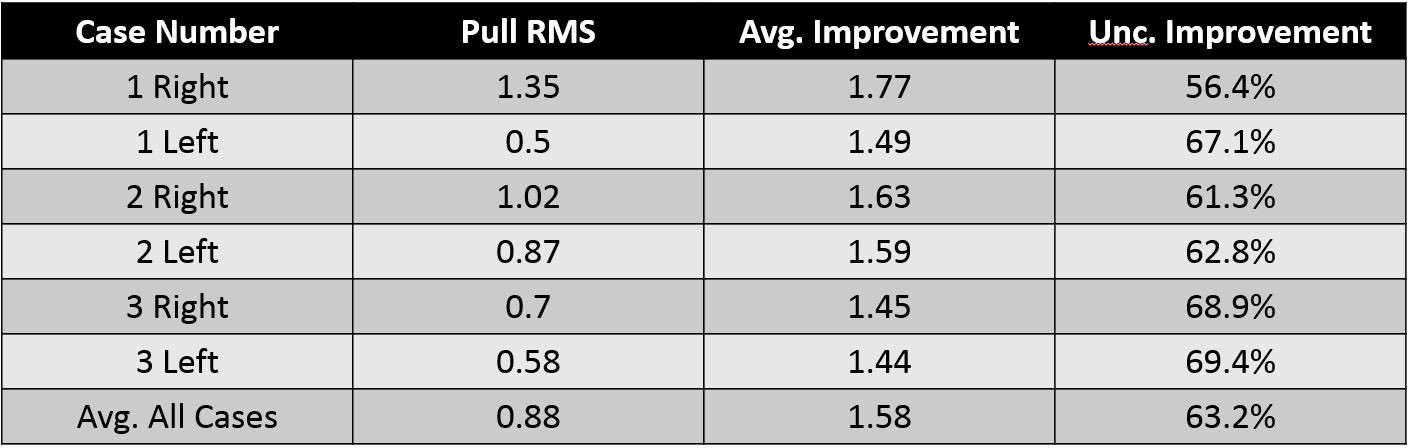
Table 1: The
average improvement in uncertainty and pull root mean square (RMS) was computed
for all cases. It is expected that the pull RMS should be not much larger than
unity, indicating that the potential flow measurements are balanced by the
statistical uncertainty. Over the cases, an overall uncertainty improvement was
found to be 63.2%.