0757
Validation of the VERDICT MRI Framework using a Novel Computational Model of Diffusion and Flow in Real-World Tumours.1Centre for Advanced Biomedical Imaging, University College London, London, United Kingdom, 2University College London, London, United Kingdom, 3University of Bologna, Bologna, Italy
Synopsis
Compartmental models are increasingly being used to quantify diffusion MRI signals from tumours. We have developed a complex, multiscale mathematical modelling platform for simulating tumour pathophysiology, using high-resolution optical imaging data from complete tumour samples. Diffusion MRI signals from these tumours were simulated, including vascular flow and intra- and extracellular diffusion. These data were fitted to the VERDICT compartmental model, and the resulting parameters compared against ground truth simulation values. Cell radius and intra/extracellular fractional volume parameters and respective ground truth values were strongly correlated. A more complex relationship was found in vascular volume fractions.
PURPOSE
Compartmental diffusion models are becoming increasingly popular for studying the microstructural properties of tissue. Recently-developed models such as VERDICT (Vascular, Extracellular and Restricted Diffusion for Cytometry in Tumours) provide powerful tools for accessing histologic features such as cell radius, intracellular volume fraction and vascular volume fraction1–3. The increasingly complex nature of such models makes thorough validation essential. We have developed a complex, multiscale mathematical modelling platform for simulating tumour pathophysiology, using high-resolution optical imaging data from complete tumour samples. The multi-bvalue, multi-direction diffusion MRI signal from these tissue simulations was synthesised using Monte Carlo simulations, which were then fitted to the VERDICT model. This allowed us to evaluate the accuracy of VERDICT model parameters, in a realistic and controlled setting, which we compare with previously acquired in-vivo data from the same tumours.METHODS
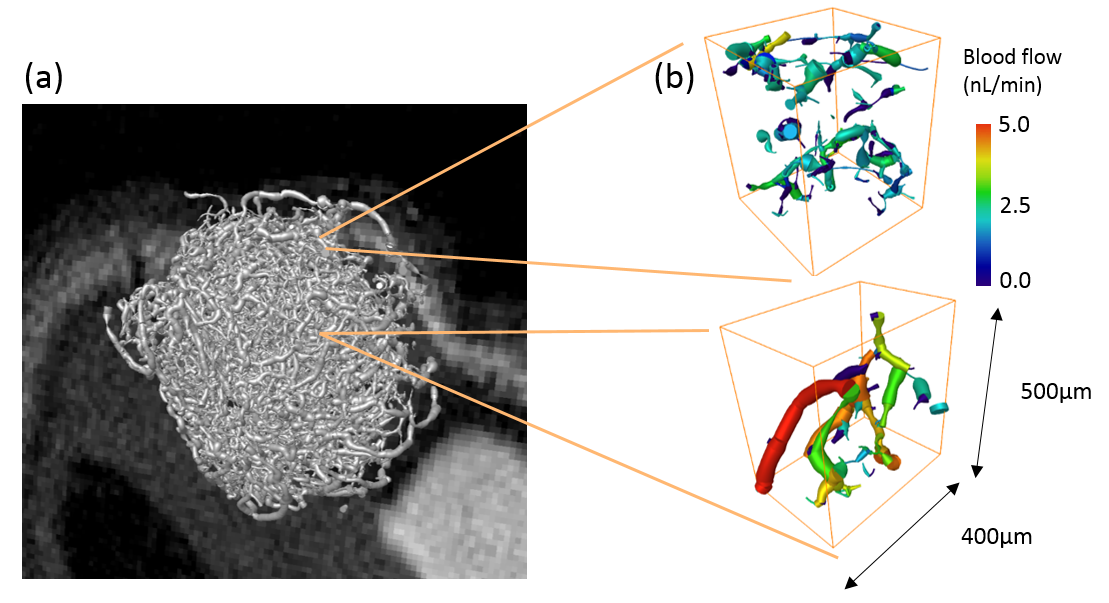
Substrate Generation: The vascular compartment of the simulation substrates (figure 1) was generated from optical projection tomography data (5-10μm resolution) acquired from optically-cleared LS174T tumours grown subcutaneously on balb/c nu/nu mice, with vessels labelled with fluorescently conjugated lectin4,5. Optical clearing was performed with benzyl alcohol benzyl benzoate (BABB). The vessel structures were segmented by applying a Frangi vesselness filter6, binary threshold and skeletonisation algorithm. Volumetric blood flow values were estimated throughout the networks using a discrete-network model simulating Poiseuille flow with conservation of flux at network bifurcations7. Four voxel-sized sections were randomly isolated for separate Monte Carlo simulations. The intracellular and extracellular compartments of the simulation were created by randomly generating spherical cells with a sphere-packing algorithm, which packed non-overlapping cells of a specified radii around the vessel network.
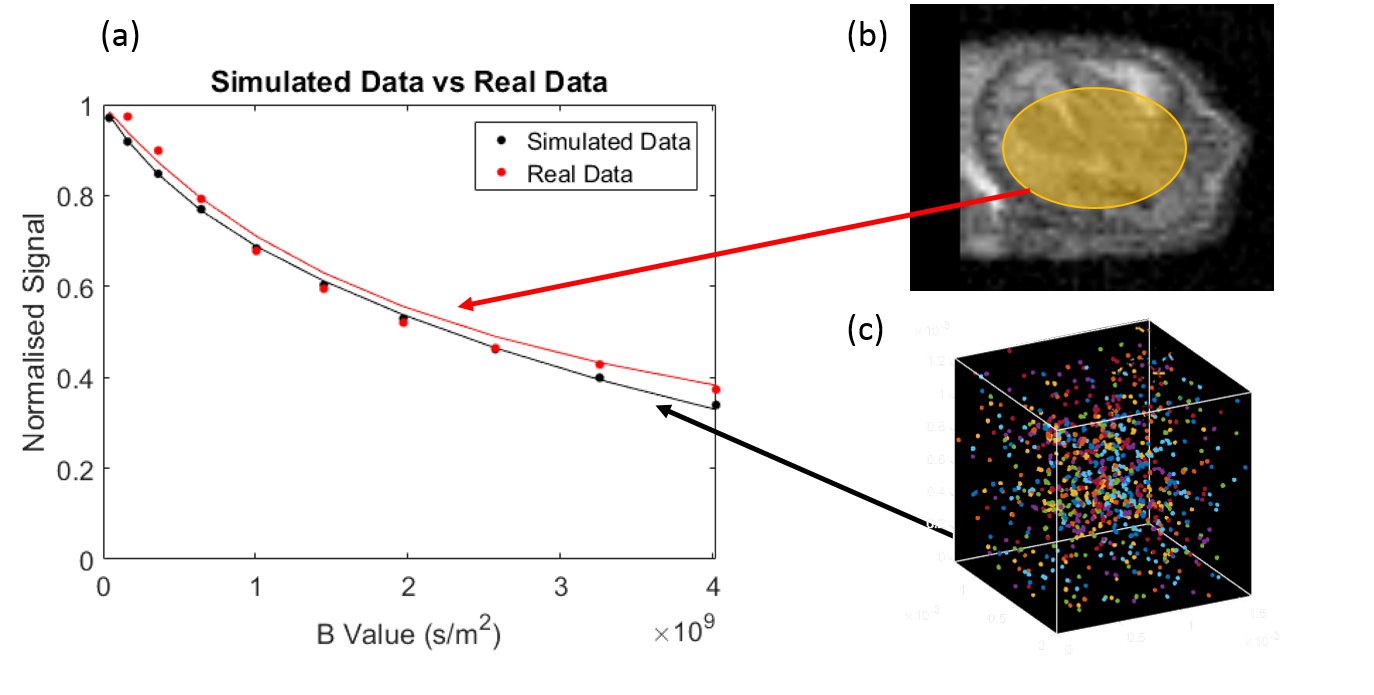
Synthetic MRI Data Generation: Walkers, representing water molecules, were initialised in one of the three compartments within the substrate, with the total in each compartment weighted by pre-specified volume fractions. In the intra/extracellular space the walker position was updated at each time-step using a random-walk protocol8 (figure 2(c)). In the vascular compartment, the walkers followed the flow velocity of their current vessel segment. Once all the walkers had been propagated, synthetic VERDICT data (46 b-value, 3 direction PGSE) was generated from their recorded trajectories using the Camino Diffusion MRI Toolkit9.
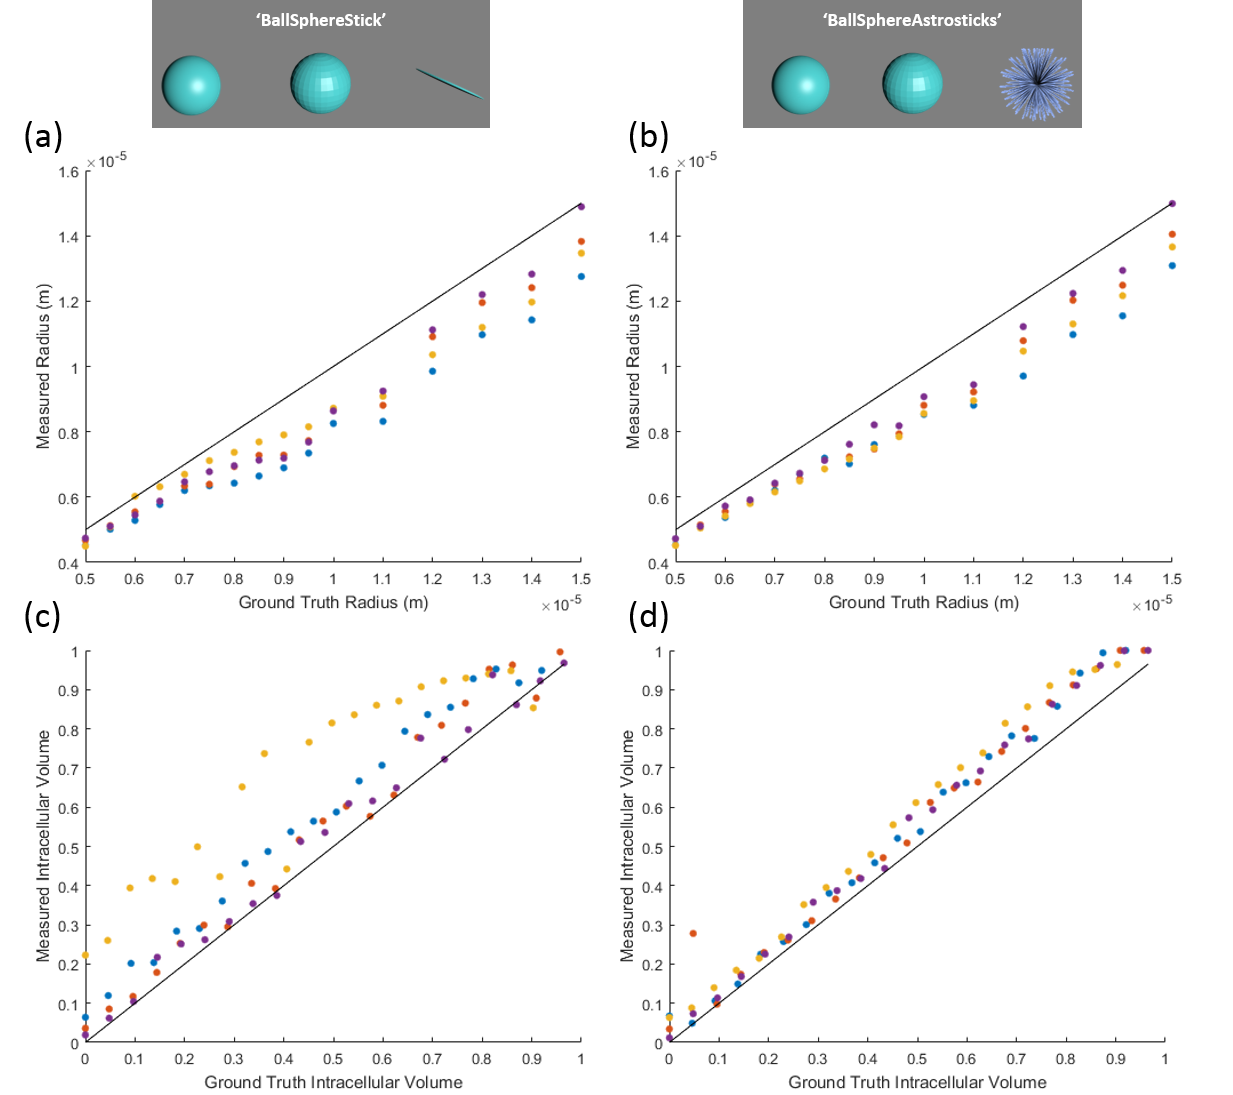
VERDICT Parameter Validation: The VERDICT models ‘BallSphereStick’ (Anisotropic vascular compartment) and ‘BallSphereAstrosticks’ (Isotropic vascular compartment) were each fitted to the synthetic data. The model parameters produced from these fits were then compared against the ground truth values specified in the simulation. This process was repeated for a range of simulation parameters to ascertain the correspondence between the VERDICT parameter estimates and the ground truth, over a wide range of values. The synthetic data produced by the simulation was also compared against subject-matched in-vivo data acquired previously.
RESULTS
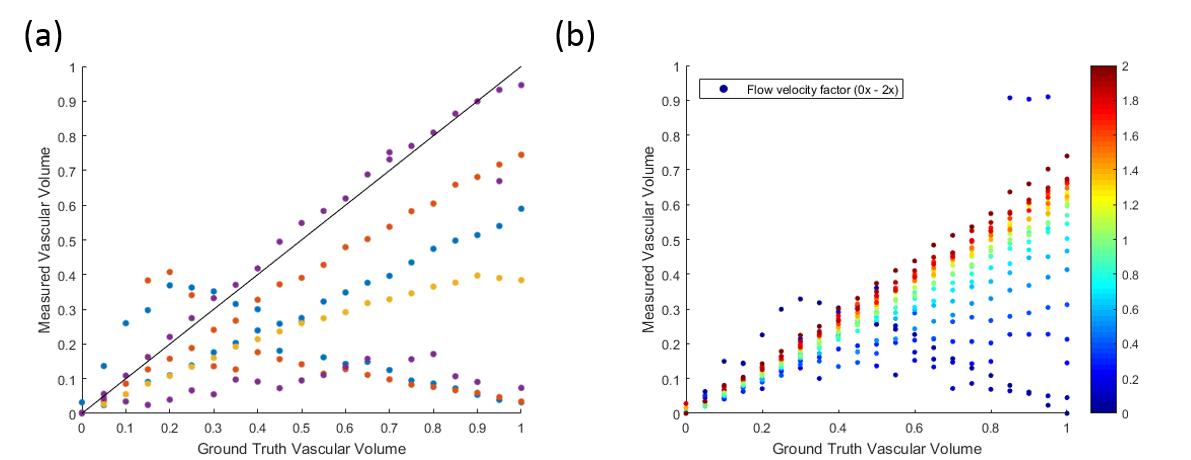
Plots of subject-matched (vascular structure) in-vivo data, averaged over an ROI (figure 2(b)) and the synthetic MR data generated shows a good level of agreement between the simulated and real data. A strong correlation is shown between the ground truth and measured values of cell radius and intracellular volume fraction (figure 3), with a close to 1-1 correspondence in many cases. The ‘BallSphereAstrosticks’ model performed better that the ‘BallSphereStick’ in most cases. Ground truth and VERDICT estimates of vascular volume fraction showed a more complex relationship, and a poorer correlation(figure 4(a)). A similarly complex relationship can be seen in figure 4(b), in which results from a single vascular structure are shown, and where the average flow velocity was varied in each batch of simulations.DISCUSSION AND CONCLUSIONS
This study aimed to demonstrate the utility of a novel computational model of diffusion and flow for validating the mathematical models used by the VERDICT MRI framework. The results presented above show that the parameters produced by the VERDICT method, such as cell radius and intra/extracellular volume fractions, are strongly correlated with the ground truth values and suggest that these are truly representative measures. The discrepancies seen in the vascular volume fraction estimates and ground truth values require further investigation. The result shown in figure 4(b) shows that the mean blood-flow velocity is a possible reason for this discrepancy.Acknowledgements
This work was supported by a Wellcome Trust Senior Research Fellowship (grant WT100247MA), KCL and UCL Comprehensive Cancer Imaging Centre CR-UK & EPSRC (In association with the DoH England), the EPSRC-funded UCL Centre for Doctoral Training in Medical Imaging (EP/L016478/1) and the Department of Health’s NIHR-funded Biomedical Research Centre at University College London Hospitals.References
1. Panagiotaki E, Walker-Samuel S, Siow B, Johnson SP, Rajkumar V, Pedley RB, Lythgoe MF, Alexander DC. Noninvasive quantification of solid tumor microstructure using VERDICT MRI. Cancer research. 2014 [accessed 2015 May 26];74(7):1902–12. http://cancerres.aacrjournals.org/content/74/7/1902.full
2. Zhang H, Schneider T, Wheeler-Kingshott CA, Alexander DC. NODDI: practical in vivo neurite orientation dispersion and density imaging of the human brain. NeuroImage. 2012 [accessed 2015 Mar 3];61(4):1000–16. http://www.sciencedirect.com/science/article/pii/S1053811912003539
3. Novikov DS, Fieremans E, Jensen JH, Helpern JA. Random walk with barriers: Diffusion restricted by permeable membranes. 2010 Apr 15 [accessed 2017 Jul 7]. http://arxiv.org/abs/1004.2701
4. Oldham M, Sakhalkar H, Oliver T, Wang YM, Kirpatrick J, Cao Y, Badea C, Johnson GA, Dewhirst M. Three-dimensional imaging of xenograft tumors using optical computed and emission tomography. Medical Physics. 2006 [accessed 2017 Jan 11];33(9):3193. http://www.ncbi.nlm.nih.gov/pubmed/17022212
5. d’Esposito A, Nikitichev D, Desjardins A, Walker-Samuel S, Lythgoe MF. Quantification of light attenuation in optically cleared mouse brains. Journal of biomedical optics. 2015 [accessed 2017 Jan 11];20(8):80503. http://www.ncbi.nlm.nih.gov/pubmed/26277988
6. Frangi AF, Niessen WJ, Vincken KL, Viergever MA. Multiscale vessel enhancement filtering. Springer, Berlin, Heidelberg; 1998. p. 130–137. http://link.springer.com/10.1007/BFb0056195
7. FRY BC, LEE J, SMITH NP, SECOMB TW. Estimation of Blood Flow Rates in Large Microvascular Networks. Microcirculation. 2012 [accessed 2017 Jun 30];19(6):530–538. http://www.ncbi.nlm.nih.gov/pubmed/22506980
8. Hall MG, Alexander DC. Convergence and Parameter Choice for Monte-Carlo Simulations of Diffusion MRI. IEEE transactions on medical imaging. 2009;28(9):1354–1364.
9. Cook, Bai Y, Gilani N, Seunarine K, Hall M, Parker G, Alexander D. Camino: Open-Source Diffusion-MRI Reconstruction and Processing. 14th Scientific Meeting of the International Society for Magnetic Resonance in Medicine. 2006 [accessed 2017 Jul 4]. http://www.citeulike.org/user/birdyyo/article/3805628
Figures