0755
Rapid Single Shot Whole Lung Acquisition of for Hyperpolarized Gas MRI Biomarkers of Airspace Enlargement.1Robarts Research Institute, London, ON, Canada, 2Department of Medical Biophysics, Western University, London, ON, Canada, 3Division of Respirology, Department of Medicine, Western University, London, ON, Canada
Synopsis
Hyperpolarized gas pulmonary MRI provides physiologically relevant biomarkers of obstructive lung disease including emphysema, bronchopulmonary dysplasia, congenital lobar emphysema and alpha-1 antitrypsin deficiency. Recently, a stretched-exponential-model combined with under-sampling in the imaging and diffusion directions was proposed for the evaluation of hyperpolarized gas multiple b-value diffusion-weighted MRI. The major advantage of this method is the possibility to significantly speed up the data acquisition using acceleration factors between 7 and 10. We hypothesize that this method can be extended to provide whole lung hyperpolarized gas MRI-based emphysema biomarkers including static-ventilation, T2* ADC and morphometry maps with high spatial image resolution.
Purpose
Hyperpolarized gas pulmonary MRI1,2 provides physiologically relevant biomarkers of obstructive lung disease including emphysema, bronchopulmonary dysplasia, congenital lobar emphysema and alpha-1 antitrypsin deficiency.3-5 Recently, a stretched-exponential-model6 combined with under-sampling in the imaging and diffusion directions7 was proposed for the evaluation of hyperpolarized gas multiple b-value diffusion-weighted MRI. The major advantage of this method is the possibility to significantly speed up the data acquisition using acceleration factors (AF) between 7 and 10.7 This is potentially more rapid than the compressed-sensing methods recently published for diffusion-weighted MRI6,8 and achieves high spatial resolution images. This approach provides a way to generate four non-zero b-values for diffusion-weighted 129Xe MRI. We hypothesize that a previous method7 can be extended to provide whole lung hyperpolarized gas MRI-based emphysema biomarkers including static-ventilation, T2*,9-11 ADC and morphometry maps with high spatial image resolution. Therefore, in this proof-of-concept evaluation, our objective was to develop this approach and generate emphysema biomarkers in a small group of ex-smokers with emphysema.Methods
As shown in Table 1, three ex-smokers with emphysema provided a written informed consent to an ethics-board approved study protocol and underwent spirometry, plethysmography, CT, and 3He MRI twice within 33 months. Imaging was performed at 3.0T (MR750, GEHC, WI) using whole-body gradients (5G/cm maximum) and a commercial, rigid linear human RF coil (Rapid Biomedical, Germany). For Visit-1 in a single breath-hold, five interleaved acquisitions (TE=4.1msec, TR=6.0msec, reconstructed matrix size=128x128, number of slices=15; slice thickness=15mm, and FOV=40x40cm2) with and without diffusion sensitization were acquired for a given line of k-space to ensure that RF depolarization (4o constant-flip-angle was used). The diffusion-sensitization gradient pulse ramp up/down time=500μs, constant time=460μs and diffusion time (Δ)=1.46ms resulted in images acquired at five different b-values: 0, 1.6, 3.2, 4.8 and 6.4s/cm2. For Visit-2 this sequence was accelerated (AF=7) by under-sampling in the imaging and diffusion direction .7 Additionally, a short-TE (TE=1.3ms) b=0 image was used to generate the static-ventilation image. A 7.4o constant-flip-angle (120 [20 per b-value] RF pulses per slice) was used while the matrix size was 128x128x15, FOV=40x40cm2, slice thickness=15mm, six b-values and duration of a single breath-hold whole lung scan was 12sec. The Visit-1 data were retrospectively under-sampled in both imaging and diffusion directions ensuring AF=7 to validate the reconstruction method.7 The ADC (b=0/b=1.6s/cm2) and morphometry maps (mean-airway-length-scale ((LmD)6,8), mean-linear-intercept (Lm)12,13) were generated as previously described7,12 and compared with corresponding maps calculated for the fully-sampled k-spaces. The Visit-2 data were reconstructed as previously described,7 and static-ventilation (short-TE image), T2* (TE1/TE2=1.3ms/4.1ms), ADC and morphometry (LmD/Lm) maps were generated. The diffusion-weighted data were corrected using regional T2* values to improve signal-to-noise before generating the diffusion-based biomarkers.Results
Figure 1 shows representative centre slice ADC/ADCA, LmD/LmDA and Lm/LmA ( where Aindicates under-sampled) maps for the three subjects (Visit-1) while Table 2 shows mean estimates and SNR values obtained for b=0/b=6.4s/cm2 images and static-ventilation image (Visit-1). For the Visit-1 subgroup, mean differences of 2.7%, 1.0% and 1.0% were observed between fully-sampled and under-sampled (AF=1/AF=7) k-space ADC, LmD and Lm values, respectively. Figure 2 shows representative centre slice static-ventilation, T2*, ADC, LmD and Lm maps for three COPD subjects (Visit-2) reconstructed from the originally under-sampled k-space (AF=7). Table 2 shows mean estimates of T2* ADC, LmD and Lm and the SNR values for b=0/b=6.4s/cm2 images (after T2* correction) and static-ventilation image (uncorrected) used to calculate ventilation-defect-percent3 (VDP).Discussion and Conclusion
In this proof-of-concept study we showed that the differences in ADC/LmD/Lm estimates from fully-sampled and retrospectively under-sampled k-space were similar to those observed with accelerated 3He multi-b diffusion-weighted MRI.7 Thus, VDP/T2*/ADC/morphometry estimates obtained for Visit-2 can be considered as a reliable. Table 2 indicates that ADC/morphometry estimates obtained for a small group of subjects during two visits were reasonably close. Diffusion-weighting MRI biomarkers suggested emphysema progression over the past 33 months for participant COPD-3. The T2*-results suggested that T2* values were in the 4-8ms interval for severe emphysema patients. Likely, T2* estimates depend on alveolar surface-to-volume ratio and, therefore, can be potentially used as biomarker. Another important role of T2* mapping is a signal correction. The SNR of static ventilation images (35-40) was more than adequate for the calculation of VDP and now can be generated alongside ADC values in a single rapid breath-hold.3Acknowledgements
A. Ouriadov was funded in part by a fellowship from the Alpha-1 Foundation (USA).References
1. Mugler, J. P., 3rd & Altes. J Magn Reson Imaging 37, 313-331, (2013).
2 . Driehuys, B. et al. Radiology 262, 279-289, 11102172 (2012).
3 . Kirby, M. et al. Radiology 265, 600-610, (2012).
4. Kaushik, S. S. et al. Magn Reson Med 65, 1154-1165, (2011).
5. Kirby, M. et al. Physiol Rep 2, doi:10.14814/phy2.12068 (2014).
6. Chan, H. F. et al.
Magn Reson Med,
(2016).
7. Abascal, J. F. P. J. et al. ArXiv e-prints 1702 (2017).
8 . Chan, H. F. et al. Magn Reson Med, (2017).
9. Parra-Robles, J. et al. J Magn Reson 192, 85-91, (2008).
10. Komlosi, P. et al. Magn Reson Med, (2016).
11. Xu, X. et al. Magn Reson Med 68, 1900-1904, (2012).
12. Ouriadov, A. et al. Magn Reson Med, (2017).
13. Yablonskiy, D. A. et al. J Appl Physiol 107, 1258-1265, (2009).
Figures

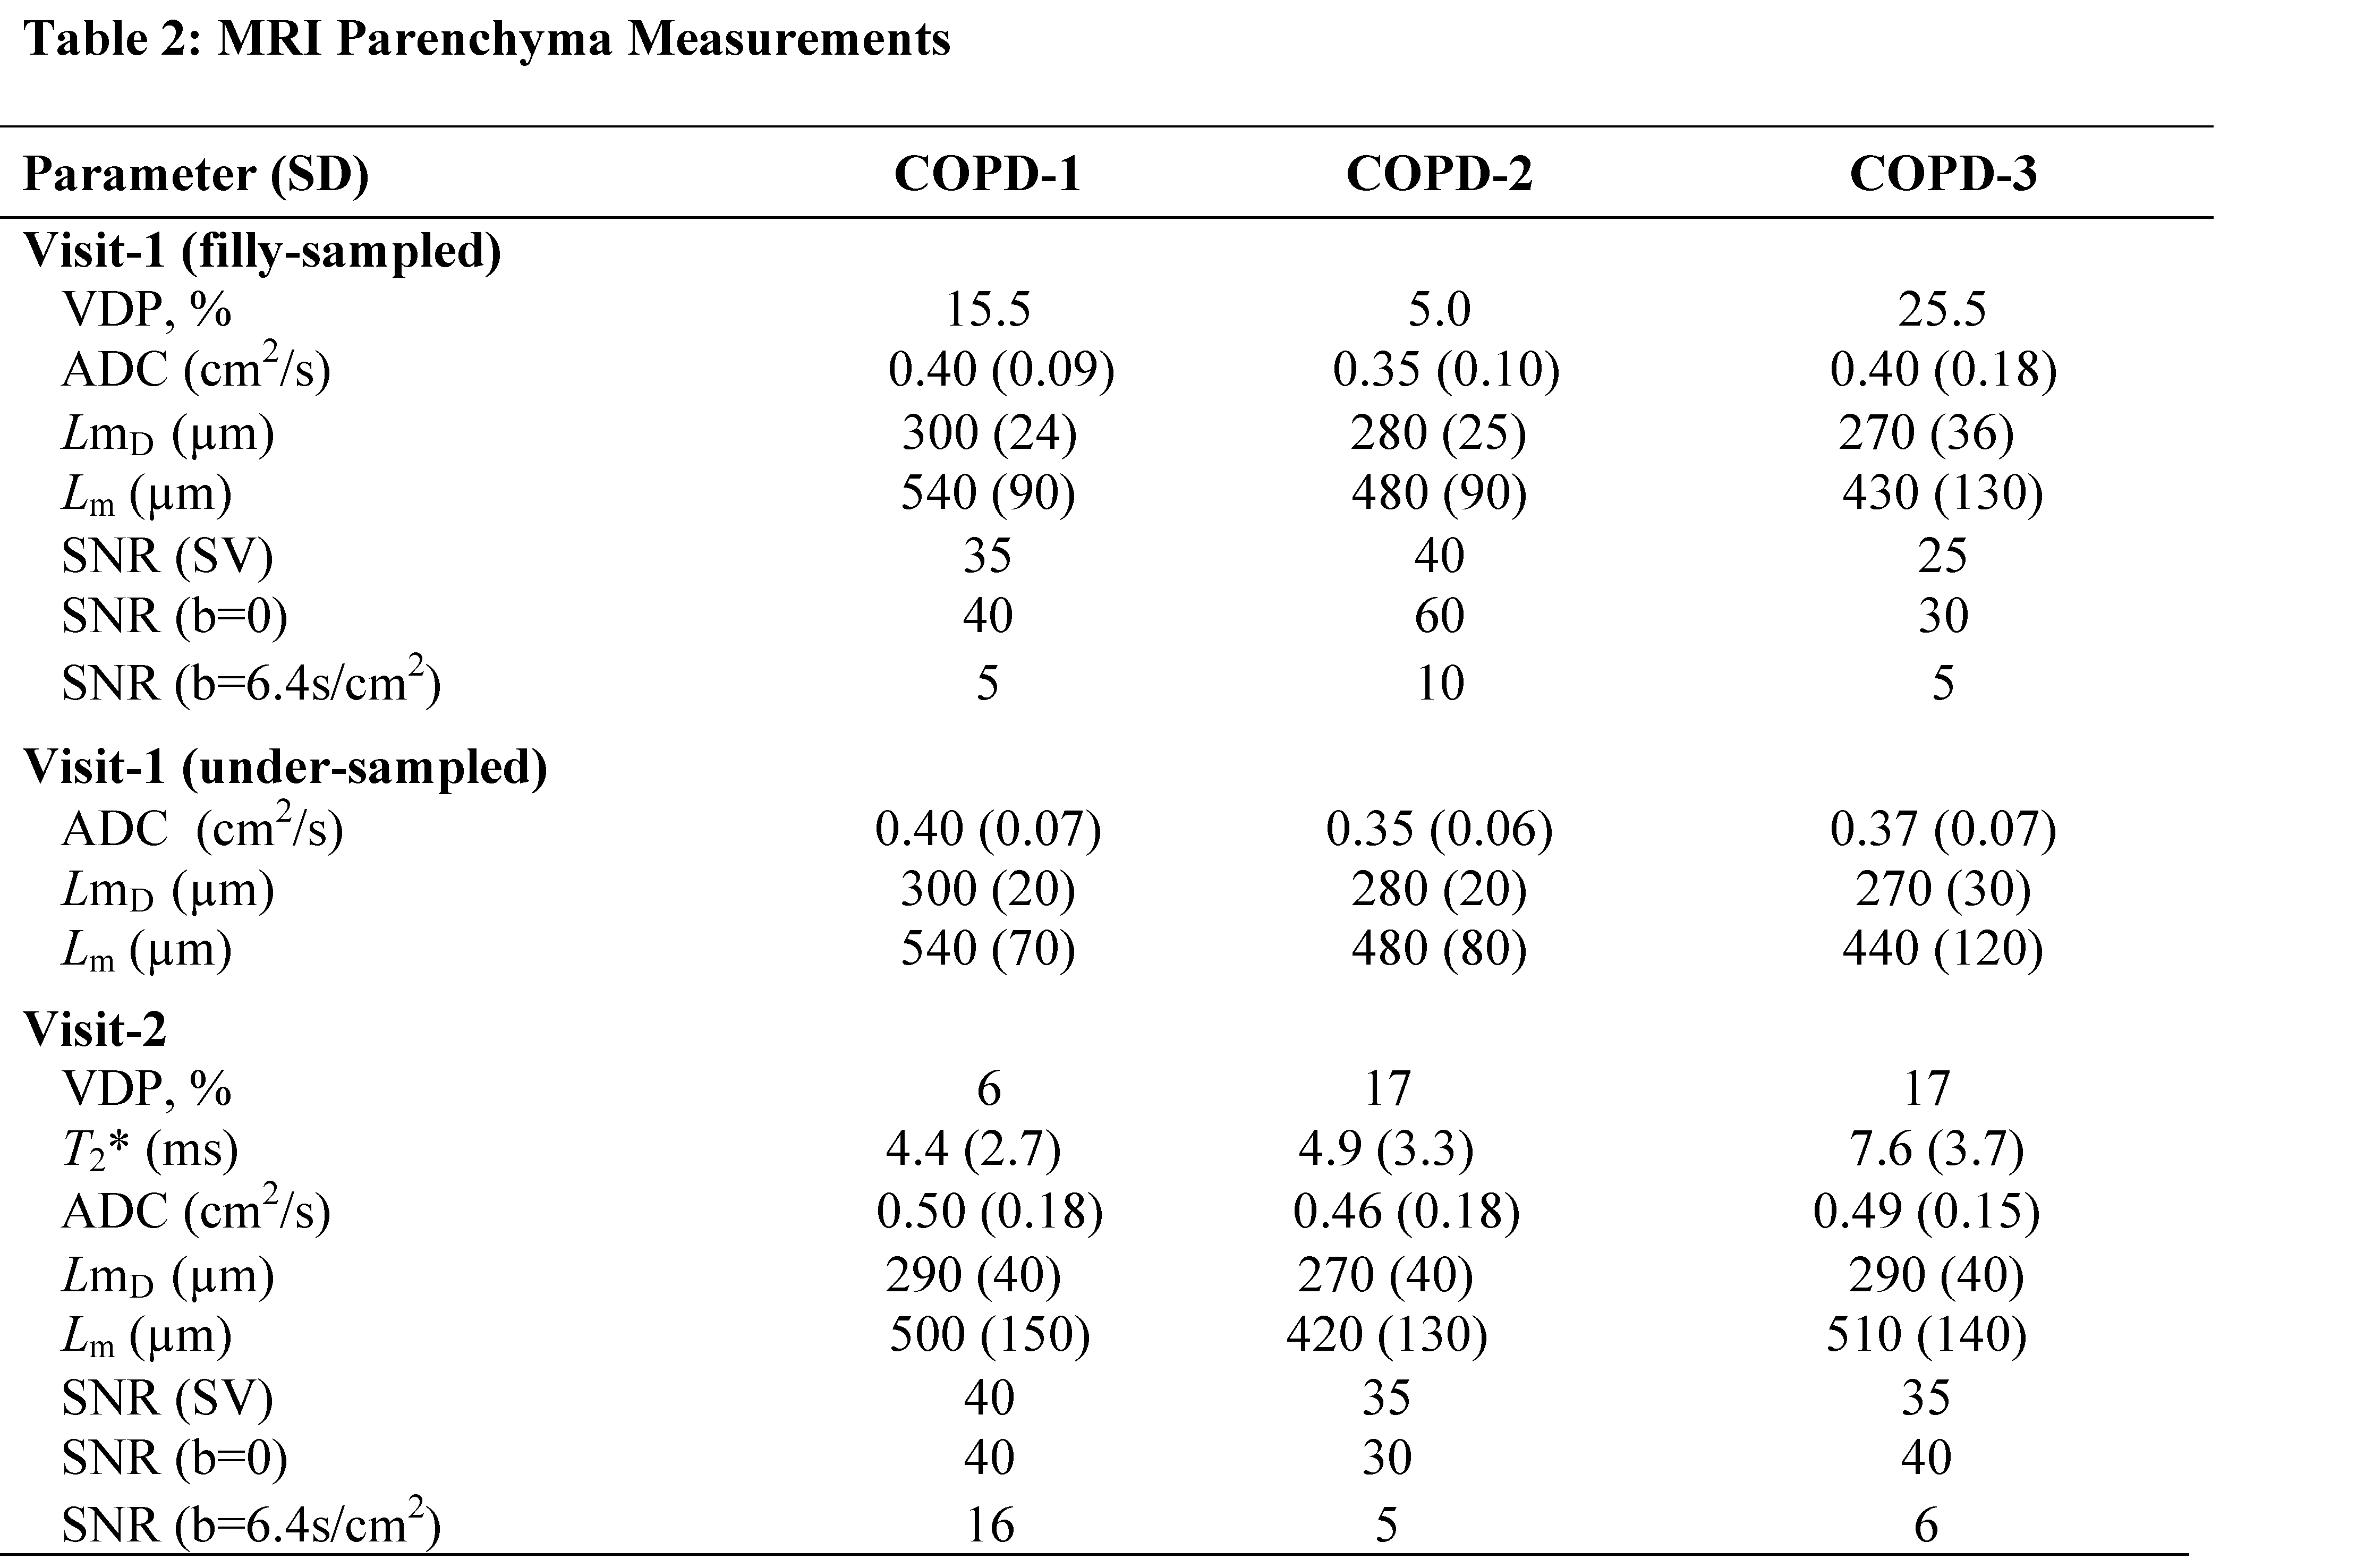
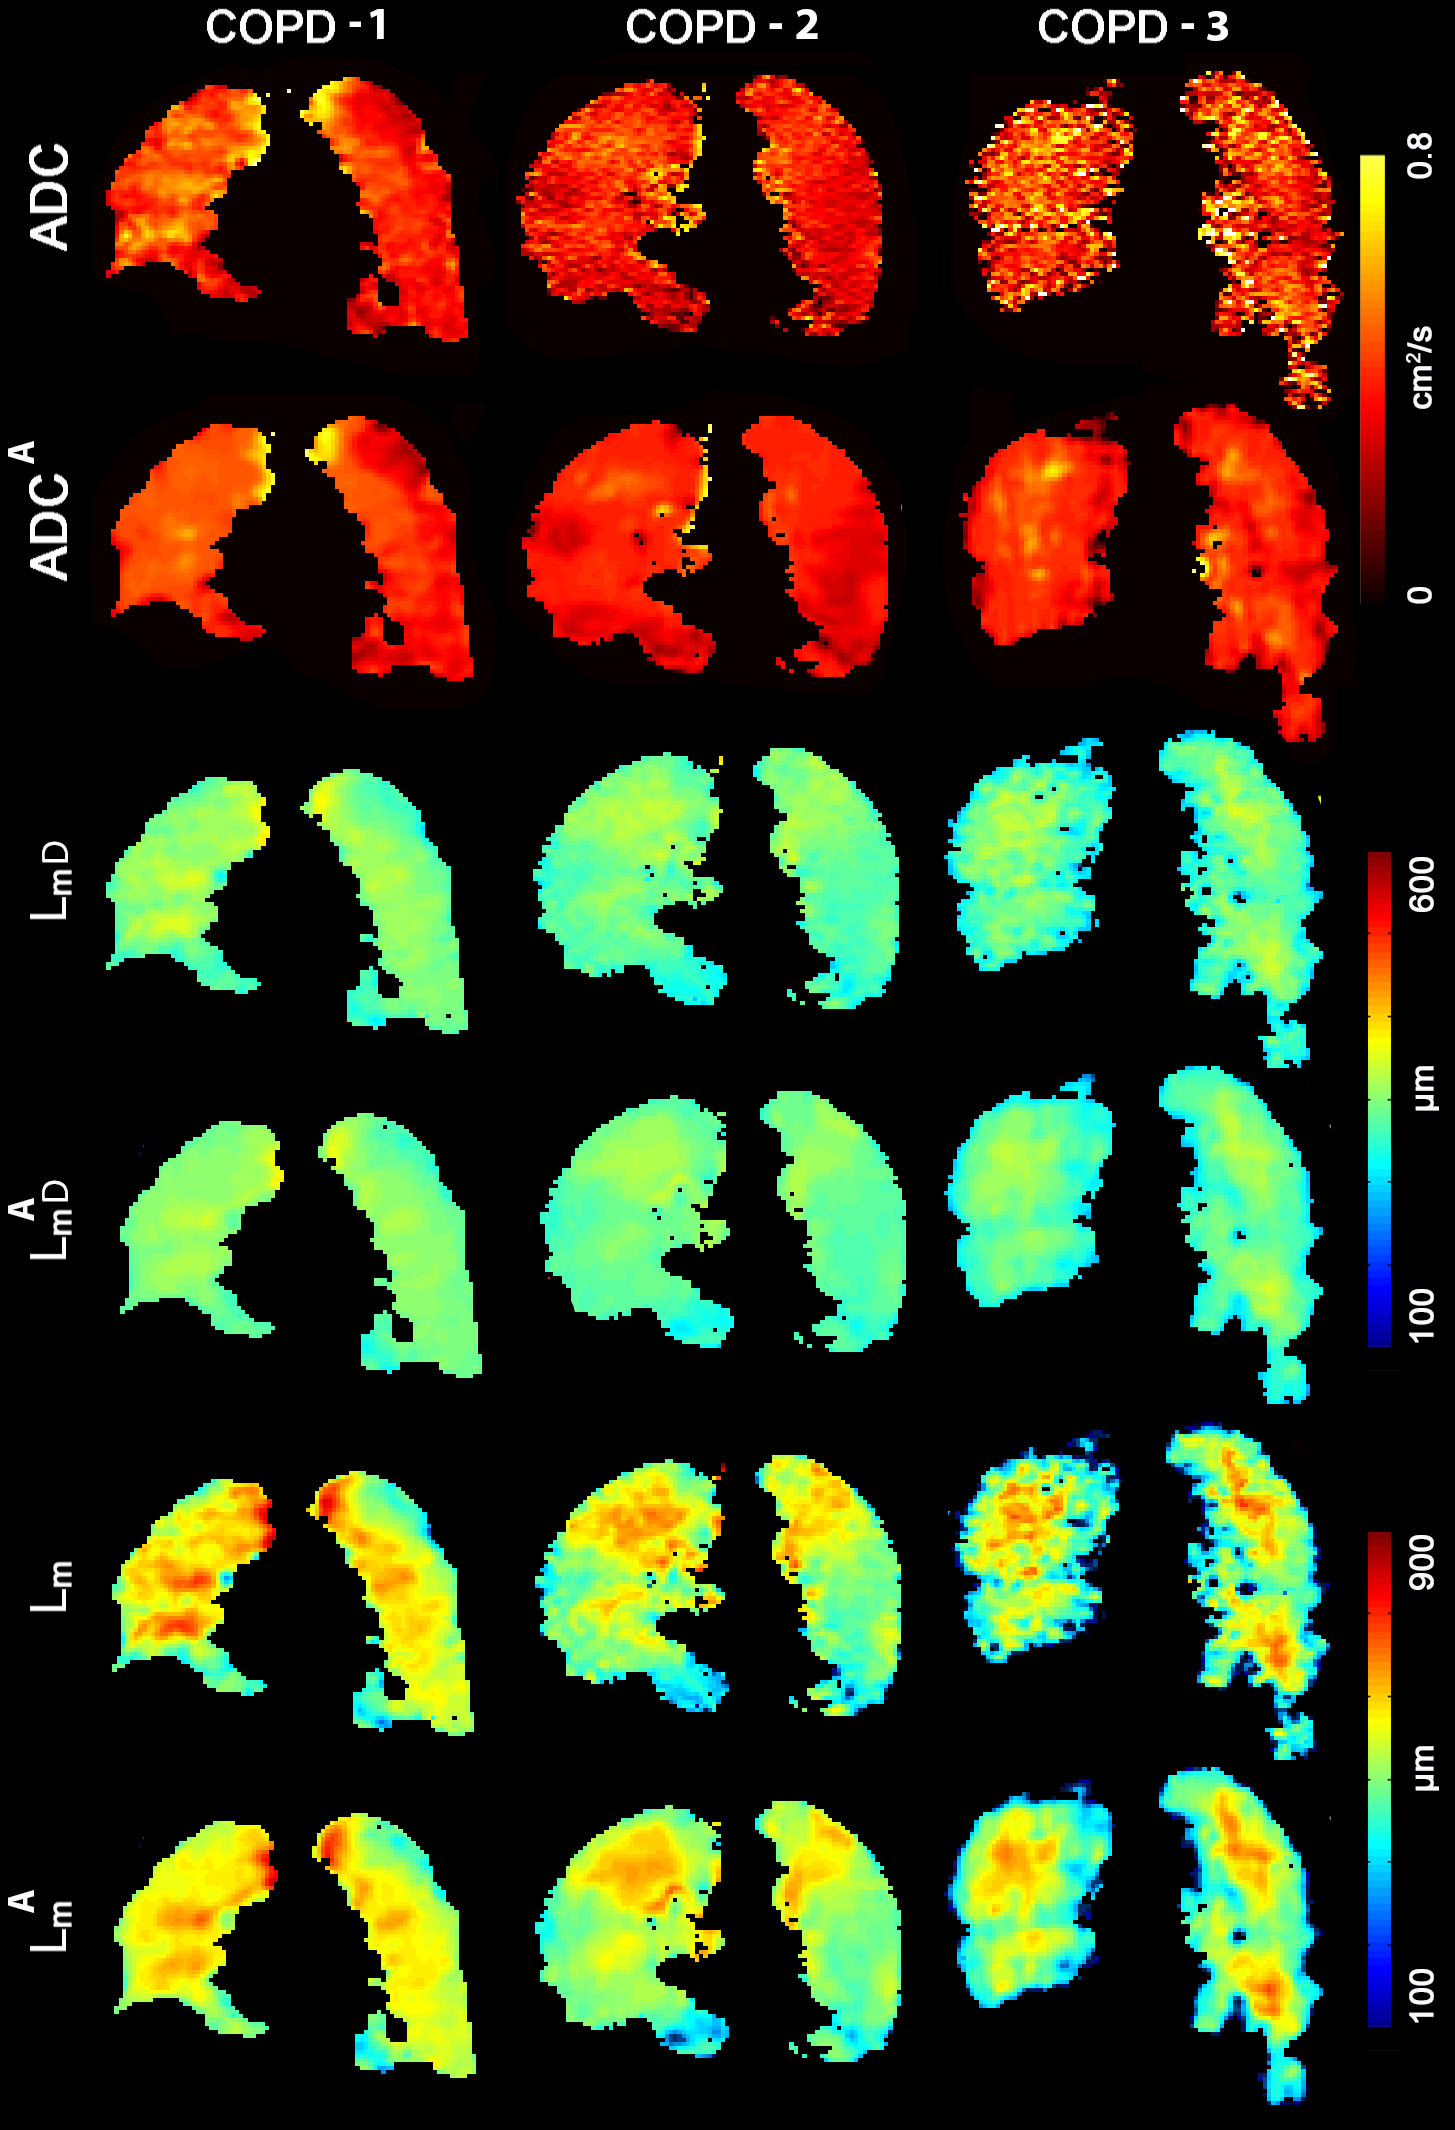
Figure 1. Representative 3He MRI Maps obtained for Visit-1.
ADC = MRI apparent-diffusion-coefficient; LmD = MRI mean-airway-length-scale; Lm = MRI mean-linear-intercept; ADCA=ADC obtained with accelerated approach; LmDA= LmD obtained with accelerated approach. LmA= Lm obtained with accelerated approach.
COPD=Ex-smoker with COPD
COPD-1: ADC/ADCA = 0.40cm2 s-1/0.40cm2s-1, LmD/LmDA=300µm/300µm, Lm/LmA=540µm/540µm.
COPD-2: ADC/ADCA = 0.35cm2s-1/0.35cm2s-1, LmD/LmDA=280µm/580µm, Lm/LmA=480µm/480µm.
COPD-3: ADC/ADCA = 0.40cm2s-1/0.37cm2s-1, LmD/LmDA=270µm/270µm, Lm/LmA=430µm/440µm.
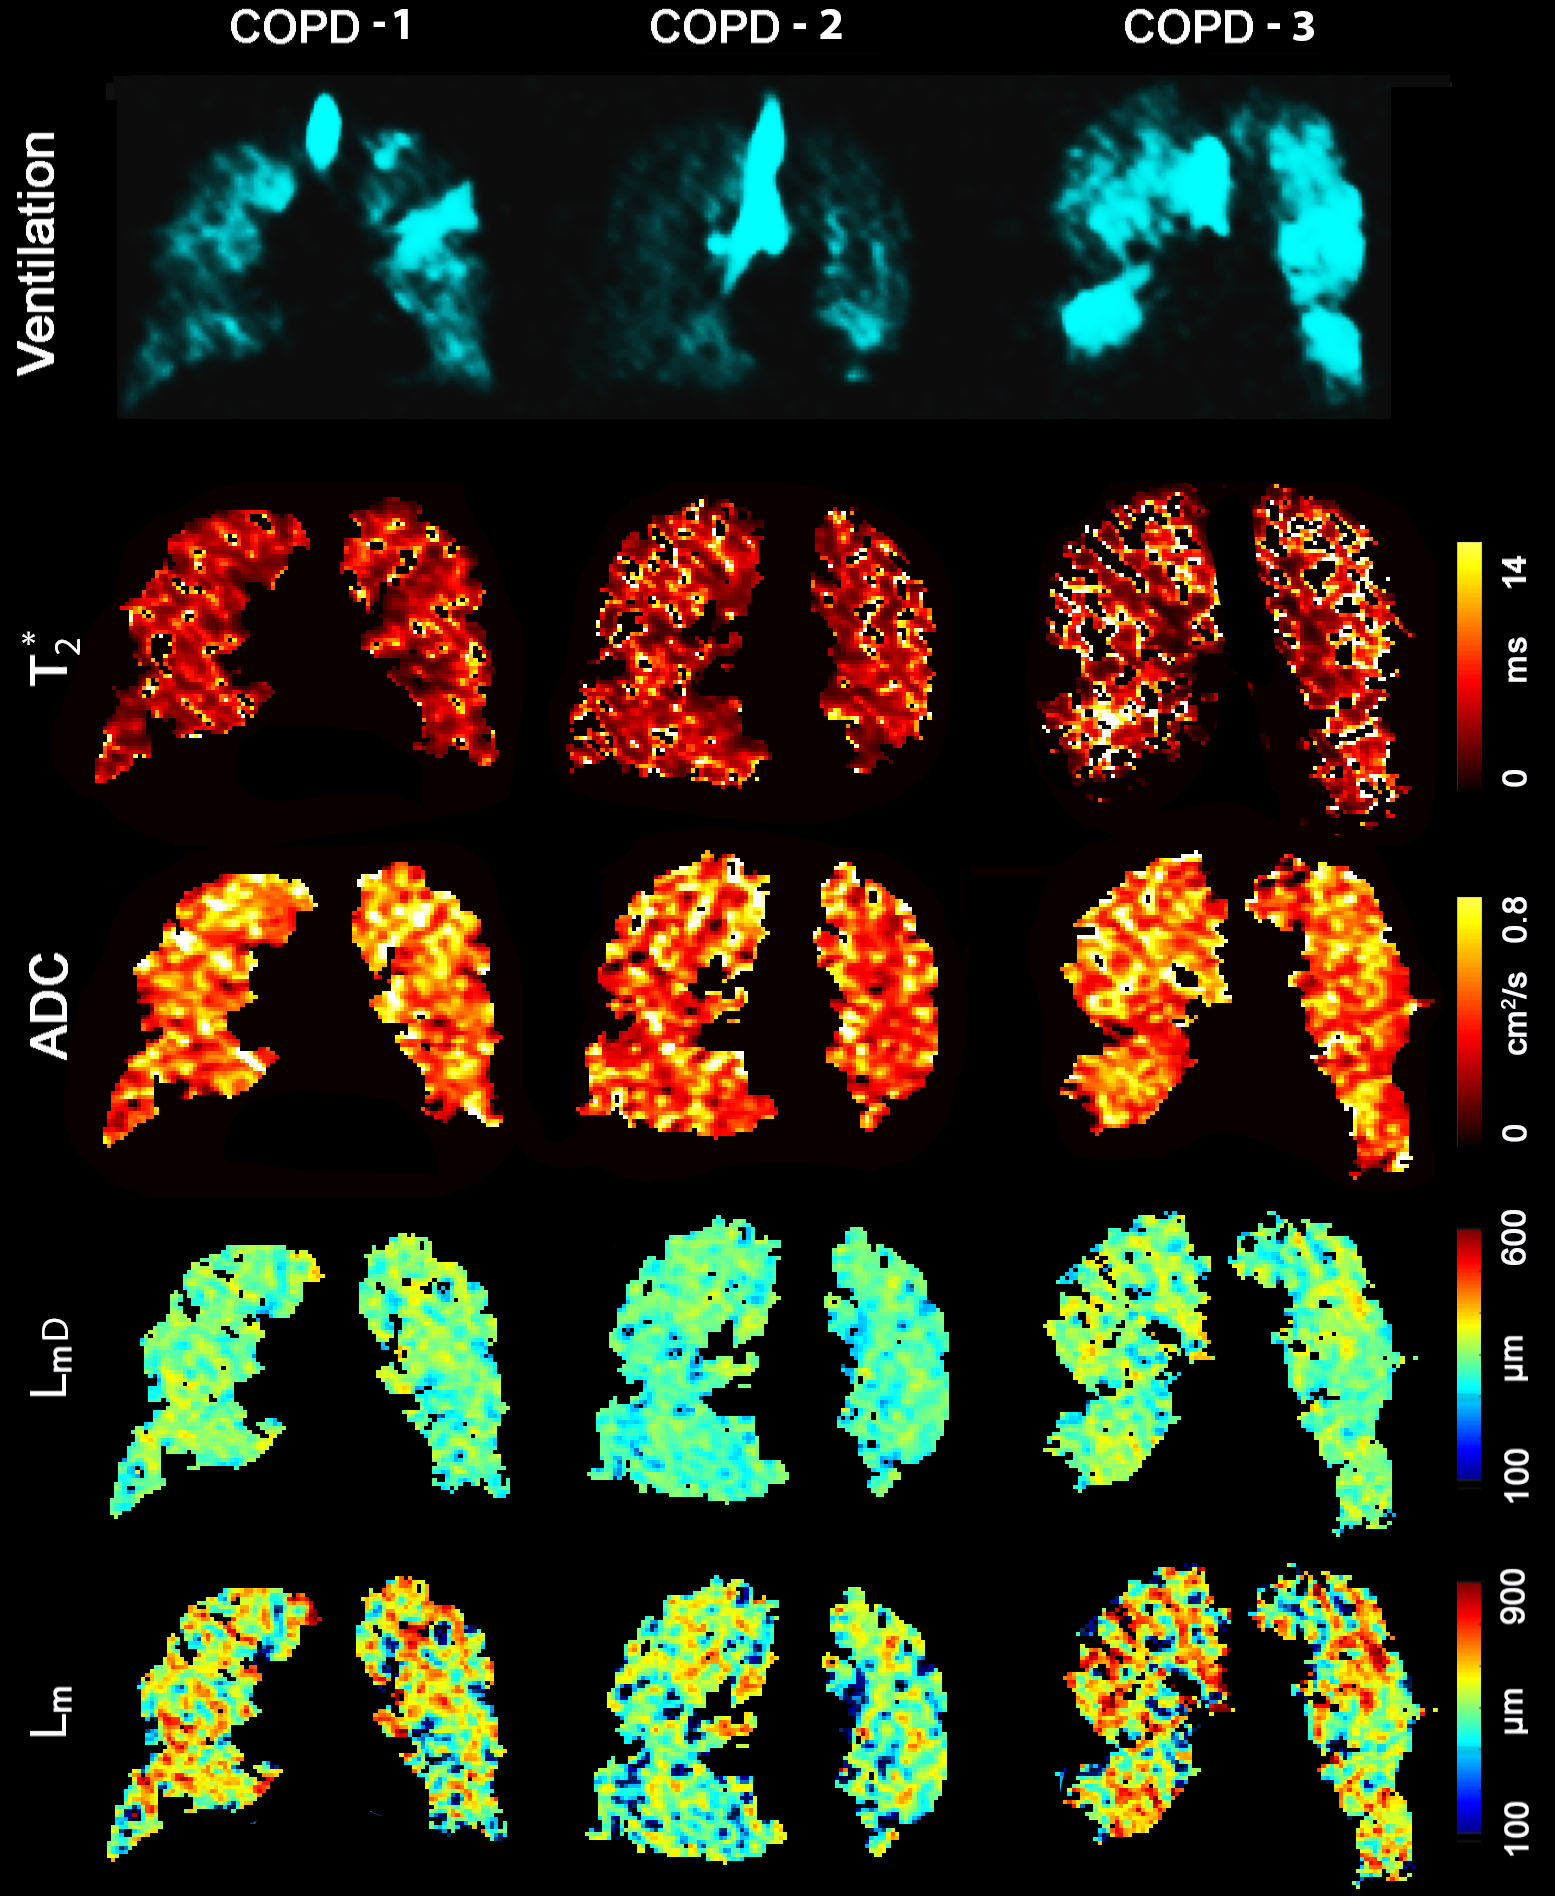
Figure 2. Representative 3He MRI Maps obtained for Visit-2.
Ventilation = MRI Static Ventilation Image; VDP = MRI ventilation defect percentage; T2* = MRI free induction decay time constant; ADC = MRI apparent-diffusion-coefficient; LmD = MRI mean-airway-length-scale; Lm = MRI mean-linear-intercept;
COPD-1: VDP =6%, T2* = 4.4ms, ADC =0.50cm2 s-1, LmD = 290µm, Lm = 500µm.
COPD-2: VDP =17%, T2* = 4.9ms, ADC = 0.46cm2s-1, LmD= 270µm, Lm=420µm.
COPD-3: VDP = 17%, T2* = 7.6ms, ADC = 0.49cm2s-1, LmD=290µm, Lm=510µm.