0753
Characterization of Axonal Pathology Independent of Fiber Crossings in Multiple Sclerosis Using High-Gradient Diffusion MRI1Massachusetts General Hospital, Boston, MA, United States, 2Neurology, Massachusetts General Hospital, Boston, MA, United States
Synopsis
Axonal damage is thought to be the substrate of disability in multiple sclerosis. We have recently introduced a method based on the spherical mean framework that provides per-voxel axon diameter and volume fraction that is independent of fiber crossings/dispersion. We apply this approach to estimate whole brain axon diameter and density in a group of patients with MS to healthy controls. Widespread alterations in axon diameter and density were found throughout the NAWM and lesions of MS patients that may reflect diffuse axonal loss and swelling in the setting of chronic demyelination.
Introduction
Axonal damage is thought to be the substrate of disability in multiple sclerosis (MS)1, but a specific imaging biomarker for axonal injury is lacking2. Recent advances in diffusion MRI hardware3 and compartment models4,5 have enabled estimation of axonal size and density in single fiber bundles but may not be entirely robust to fiber crossings and orientation dispersion, which are prevalent in white matter6. We have recently introduced a method7 based on the spherical mean framework8,9 that provides per-voxel axon diameter and volume fraction that is independent of fiber crossings/dispersion. In this work, we apply the spherical mean approach to estimate whole brain axon diameter and density in a group of patients with MS to healthy controls.Methods
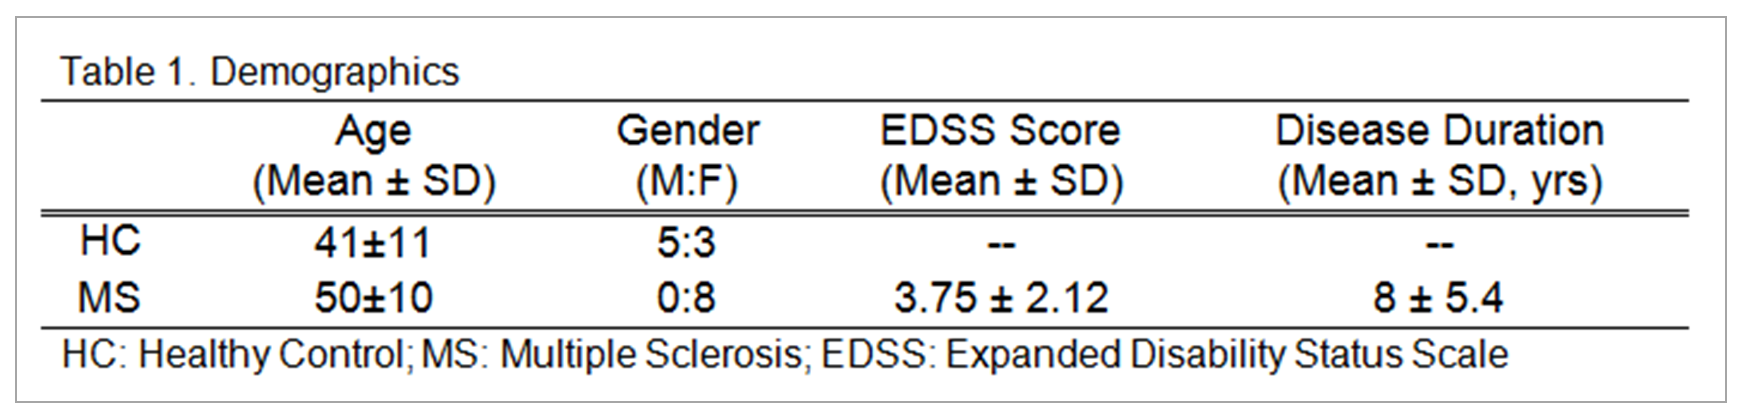
Data acquisition Eight people with MS (5 RRMS, 3 PMS) and 8 healthy controls (HCs) were scanned on the 3T Connectome scanner equipped with 300mT/m maximum gradient strength using a custom-build 64-channel head coil. Sagittal 2-mm isotropic resolution diffusion-weighted spin-echo EPI images were acquired with whole brain coverage. The following parameters were used: TR/TE = 4000/77ms, δ=8ms, Δ=19/49ms, 8 diffusion gradient strengths linearly spaced from 30-290mT/m per Δ, 32-64 diffusion directions, parallel imaging (R=2) and simultaneous multislice (MB=2). High-resolution anatomic T1 MEMPRAGE and T2/SPACE-FLAIR sequences were also acquired for lesion localization and tissue segmentation.
Data analysis Diffusion data were corrected for gradient nonlinearity10, motion, susceptibility and eddy current distortions using the TOPUP and EDDY tools in FSL11-13. Voxel-wise fitting for axon diameter, restricted (fr) and hindered (fh) volume fraction, and hindered diffusivity (Dh) according to the spherical mean model7,14 was performed using Markov Chain Monte Carlo (MCMC) sampling. Neurite orientation dispersion and density imaging (NODDI) analysis15 was also performed for comparison. Regions of interest (ROIs) in MS lesions were manually drawn on FLAIR images by an experienced neuroradiologist. NAWM masks were created by combining Freesurfer segmentations for the corpus callosum and hemispheric white matter, excluding lesions in all MS patients. Microstructural and NODDI metrics in NAWM of MS patients and white matter of HCs were compared using the Mann-Whitney U test and in lesions and NAWM of MS patients using the Wilcoxon signed-rank test.
Results
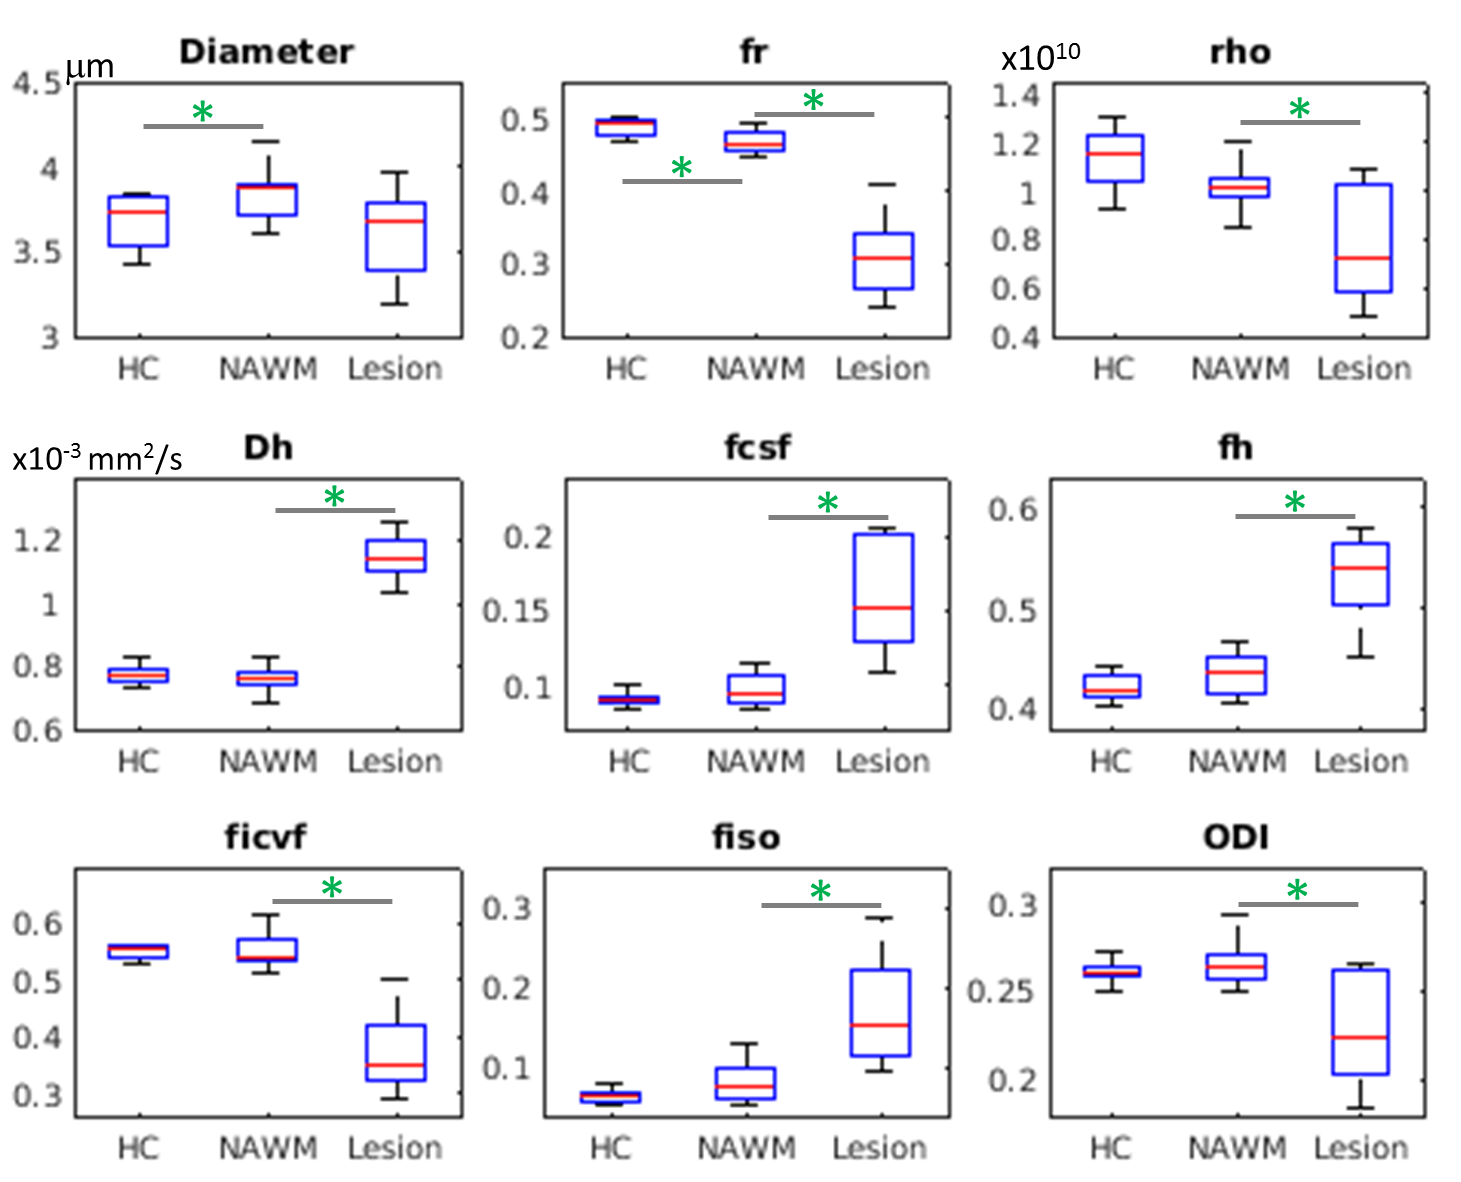
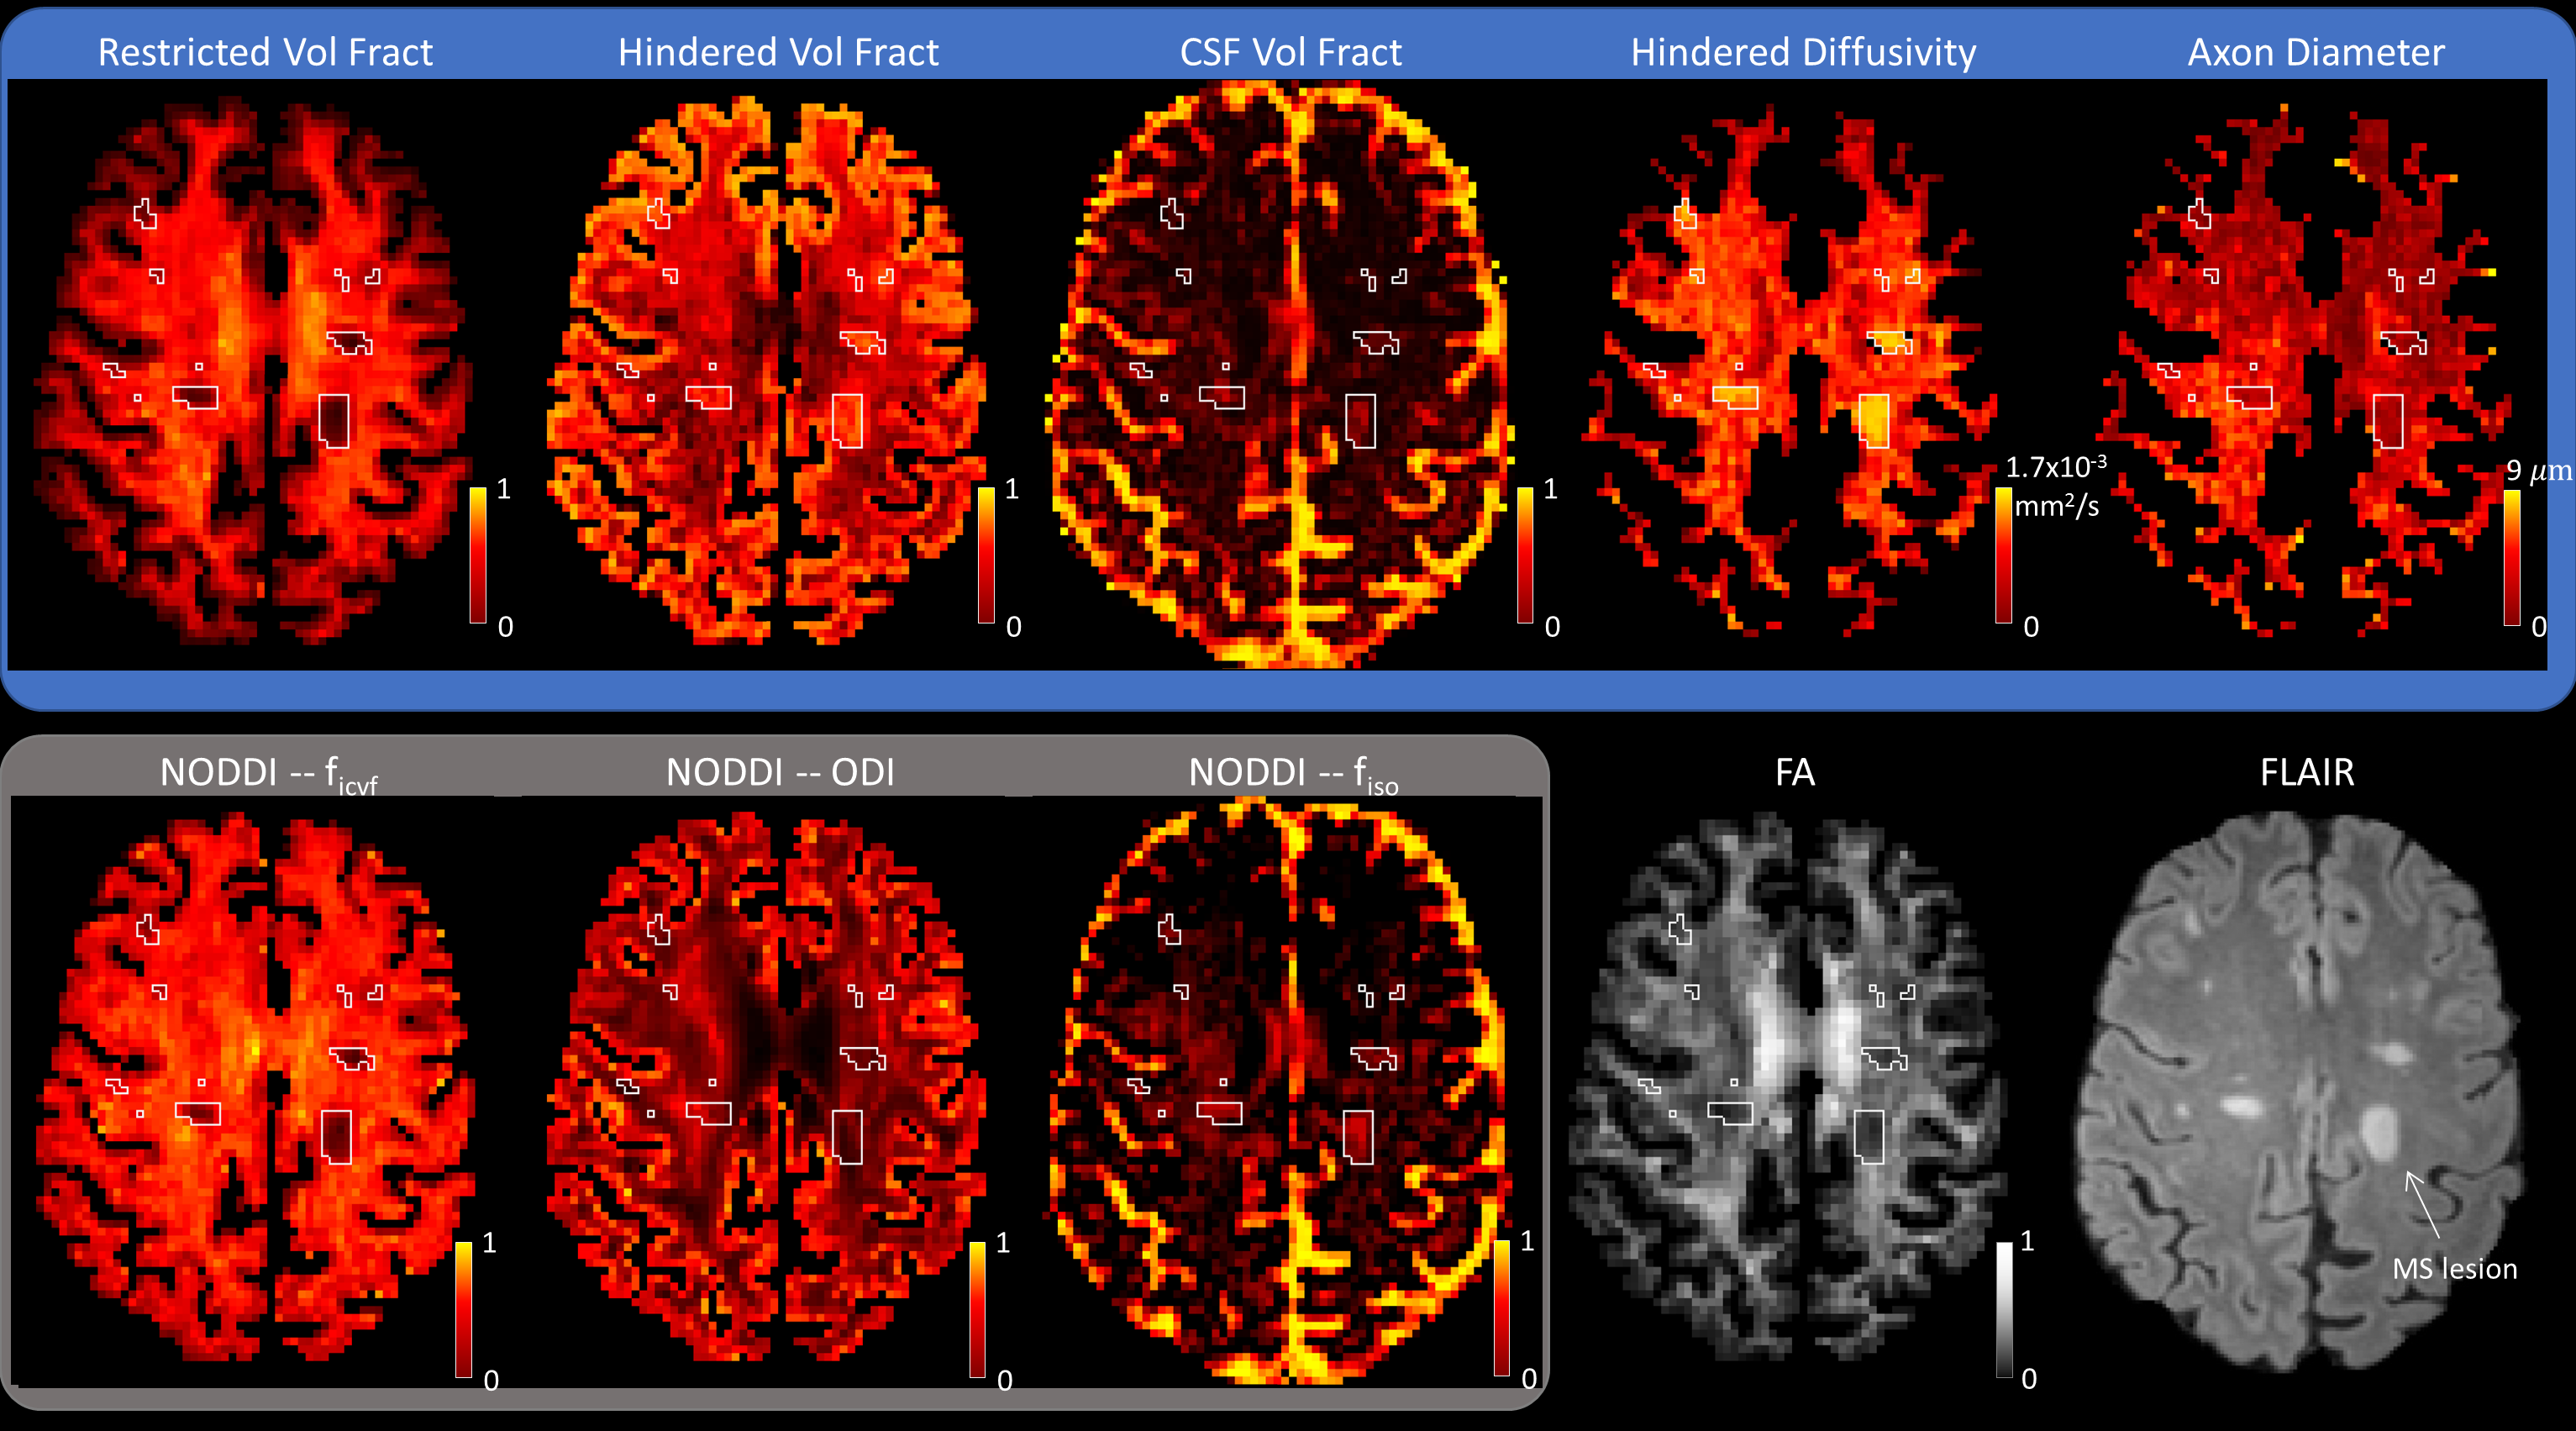
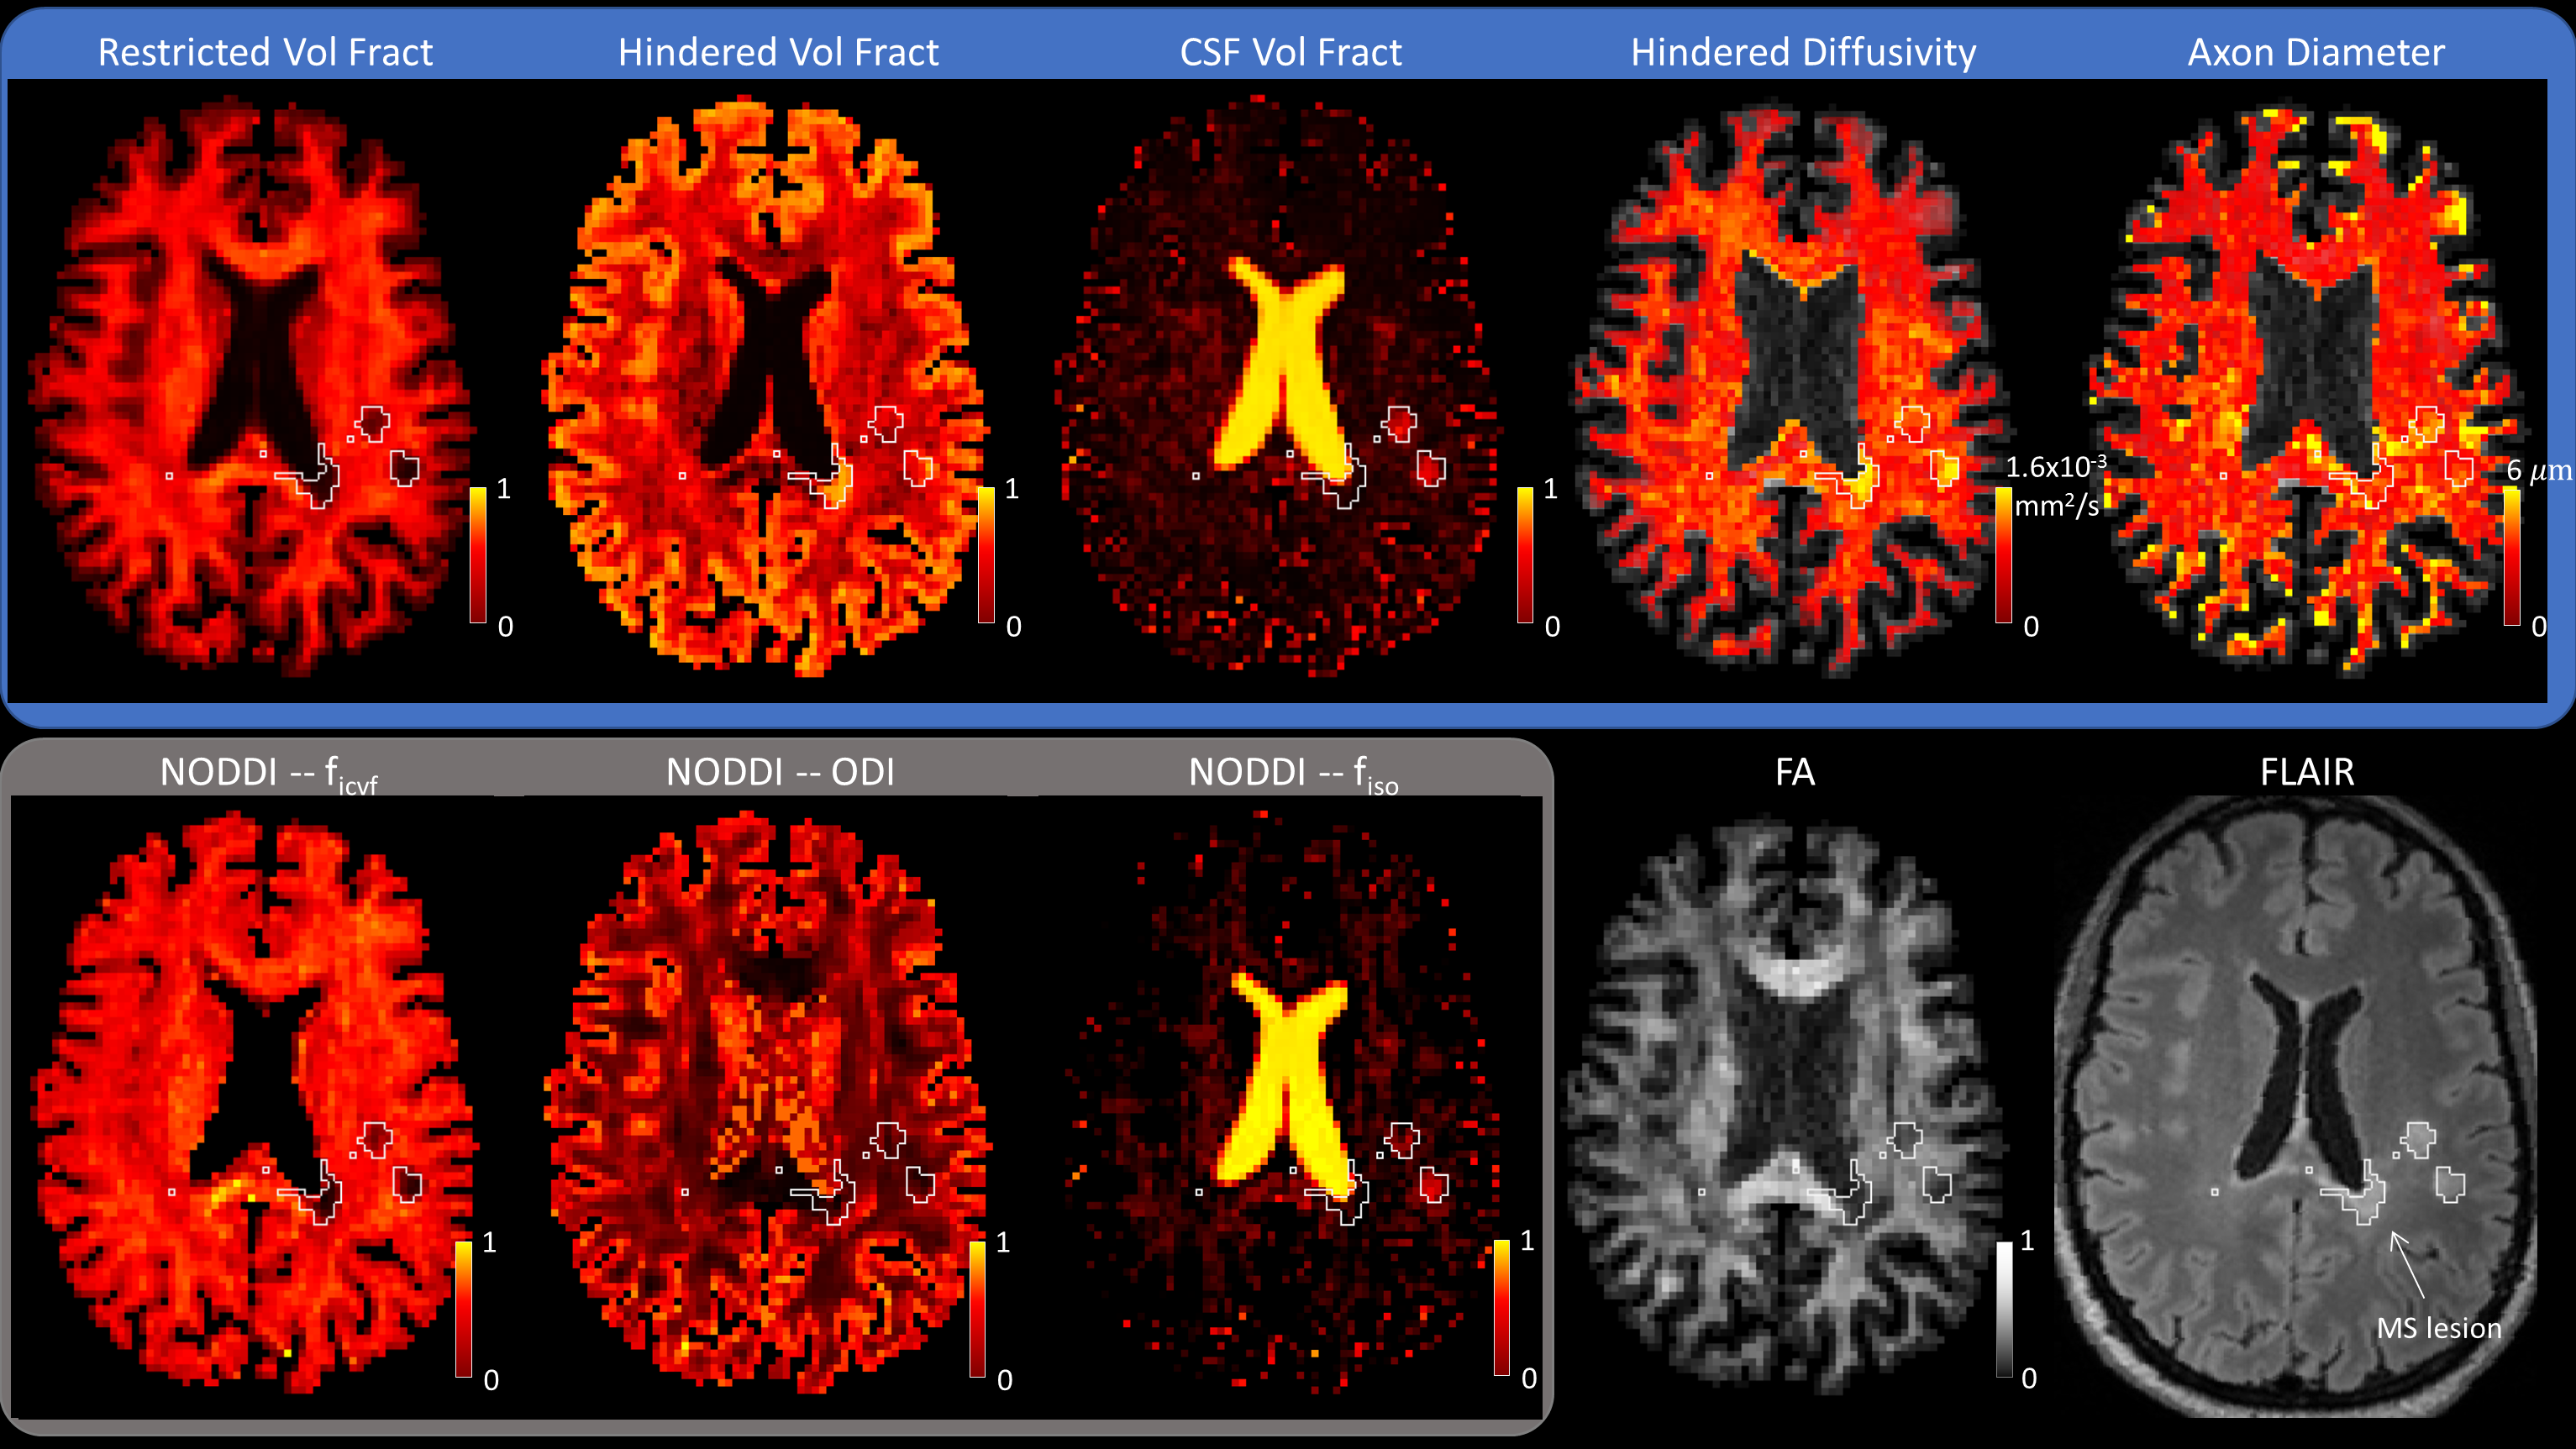
Figure 1 compares microstructural estimates from the spherical mean approach in white matter of HCs, NAWM and lesions in MS patients. Axon diameter was significantly higher in NAWM of MS patients compared to healthy controls (3.84±0.06mm vs. 3.67±0.06mm, p=0.04). Restricted volume fraction was significantly lower in NAWM of MS patients compared to healthy controls. Axon density was lower in NAWM of MS patients compared to healthy controls (1.01×10¹⁰/m2 vs. 1.13×10¹⁰/m2, p=0.05). No significant difference in Dh, fcsf, fh, or the NODDI metrics of ficvf, fiso, or ODI was seen between NAWM of MS patients and healthy controls. Restricted volume fraction was significantly lower in lesions compared to NAWM in MS patients (0.31±0.02 vs. 0.47±0.01, p=0.01). Hindered volume fraction (0.53±0.01 vs. 0.43±0.01, p=0.01) and CSF volume fraction (0.16±0.01 vs. 0.10±0.003, p=0.01) were significantly higher in lesions compared to NAWM in MS patients. Axon diameter was overall lower in lesions compared to NAWM in MS patients (3.61±0.09mm vs. 3.84±0.06mm, p=0.05), although the estimates of diameter were heterogeneous throughout lesions within and between subjects (Figures 2-3). Axon density was significantly lower in lesions compared to NAWM in MS patients (1.01×10¹⁰/m2 vs. 7.8×10⁹/m2). There was a significant reduction in ficvf (0.37±0.02 vs. 0.55±0.01, p=0.01) and ODI (0.23±0.01 vs. 0.27±0.005, p=0.02) in MS lesions compared to NAWM, whereas fiso was significantly higher in lesions compared to NAWM (0.17±0.02 vs. 0.08±0.009, p=0.01).Discussion
In this study, we find widespread alterations in axon diameter and density throughout the NAWM and lesions of MS patients. Our results provide potential imaging correlates of diffuse axonal loss and remodeling in the setting of chronic demyelination16. The observed increase in axon diameter in the NAWM is in agreement with findings on histopathology of axonal swelling and selective loss of small diameter axons16,17. Changes in axon diameter in lesions were more variable within and between subjects, in keeping with the known heterogeneity of lesions on histopathology. Our results are in agreement with changes in intracellular volume fraction and CSF volume fraction obtained from NODDI, with the added advantage of providing an estimate of hindered diffusivity and volume fraction. Surprisingly, lesions showed significantly increased hindered diffusivity and volume fraction relative to NAWM, suggesting that the hindered compartment may provide insight into changes in the extra-axonal space in areas of focal demyelination. Further study in a larger group of patients and validation with histopathology is underway.Acknowledgements
This work was funded by an NIH Blueprint for Neuroscience Research Grant: U01MH093765, as well as NIH funding from NCRR P41EB015896, NIBIB R01EB006847, NIBIB R00EB015445, NINDS K23NS096056, NINDS K23NS078044, NIH/NCRR/NIBIB P41EB015896 and Instrumentation Grants S10-RR023401, S10-RR023043, and S10-RR019307. Funding support was also received from the National Multiple Sclerosis Society, the American Heart Association Postdoctoral Fellowship Award (17POST33670452), a Radiological Sciences of North America Research Resident Grant, the Conrad N. Hilton Foundation and the MGH Executive Committee on Research Fund for Medical Discovery Fellowship Award.References
1. Dutta R, Trapp BD. Mechanisms of neuronal dysfunction and degeneration in multiple sclerosis. Progress in neurobiology. 2011;93(1):1-12.
2. Barkhof F. The clinico-radiological paradox in multiple sclerosis revisited. Current opinion in neurology. 2002;15(3):239-245.
3. Setsompop K, Kimmlingen R, Eberlein E, et al. Pushing the limits of in vivo diffusion MRI for the Human Connectome Project. NeuroImage. 2013;80:220-233.
4. Assaf Y, Blumenfeld-Katzir T, Yovel Y, Basser PJ. AxCaliber: a method for measuring axon diameter distribution from diffusion MRI. Magnetic resonance in medicine : official journal of the Society of Magnetic Resonance in Medicine / Society of Magnetic Resonance in Medicine. 2008;59(6):1347-1354.
5. Alexander DC, Hubbard PL, Hall MG, et al. Orientationally invariant indices of axon diameter and density from diffusion MRI. NeuroImage. 2010;52(4):1374-1389.
6. Schmahmann JD, Pandya DN. Fiber Pathways of the Brain. Oxford University Press; 2006.
7. Fan Q, Nummenmaa A, Witzel T, et al. Axon diameter mapping independent of crossing structures using spherical mean technique. Paper presented at: International Society for Magnetic Resonance in Medicine2018; Paris, France.
8. Kaden E, Kruggel F, Alexander DC. Quantitative mapping of the per-axon diffusion coefficients in brain white matter. Magnetic resonance in medicine : official journal of the Society of Magnetic Resonance in Medicine / Society of Magnetic Resonance in Medicine. 2016;75(4):1752-1763.
9. Kaden E, Kelm ND, Carson RP, Does MD, Alexander DC. Multi-compartment microscopic diffusion imaging. NeuroImage. 2016;139:346-359.
10. Fan Q, Witzel T, Nummenmaa A, et al. MGH-USC Human Connectome Project datasets with ultra-high b-value diffusion MRI. NeuroImage. 2016;124(Pt B):1108-1114.
11. Andersson JL, Skare S, Ashburner J. How to correct susceptibility distortions in spin-echo echo-planar images: application to diffusion tensor imaging. NeuroImage. 2003;20(2):870-888.
12. Andersson JLR, Sotiropoulos SN. An integrated approach to correction for off-resonance effects and subject movement in diffusion MR imaging. NeuroImage. 2016;125:1063-1078.
13. Andersson JLR, Graham MS, Zsoldos E, Sotiropoulos SN. Incorporating outlier detection and replacement into a non-parametric framework for movement and distortion correction of diffusion MR images. NeuroImage. 2016;141:556-572.
14. Panagiotaki E, Schneider T, Siow B, Hall MG, Lythgoe MF, Alexander DC. Compartment models of the diffusion MR signal in brain white matter: a taxonomy and comparison. NeuroImage. 2012;59(3):2241-2254.
15. Zhang H, Schneider T, Wheeler-Kingshott CA, Alexander DC. NODDI: practical in vivo neurite orientation dispersion and density imaging of the human brain. NeuroImage. 2012;61(4):1000-1016.
16. Evangelou N, Esiri MM, Smith S, Palace J, Matthews PM. Quantitative pathological evidence for axonal loss in normal appearing white matter in multiple sclerosis. Annals of neurology. 2000;47(3):391-395.
17. Lovas G, Szilagyi N, Majtenyi K, Palkovits M, Komoly S. Axonal changes in chronic demyelinated cervical spinal cord plaques. Brain : a journal of neurology. 2000;123 ( Pt 2):308-317.
Figures