0751
Reversible white matter restricted diffusion in patients with cerebral malaria via ADC measurement on a 0.35T MR scanner1Electrical and Computer Engineering, University of Rochester, Rochester, NY, United States, 2Department of Imaging Sciences, University of Rochester, Rochester, NY, United States, 3Malawi MRI Center, Queen Elizabeth Central Hospital, Blantyre, Malawi, 4Department of Neurology, University of Rochester, Rochester, NY, United States
Synopsis
White matter abnormalities are commonly identified on cerebral malaria patients. We proposed a method to overcome technical limitations of low-field MRI, and quantitatively calculate the ADC and b0 maps, enabling discrimination of the true restricted diffusion from T2 shine-through. A unique pattern of reversible restricted diffusion was identified in some patients.
Introduction
Cerebral malaria (CM) is a severe complication of malaria and 85% of the morbidity and mortality of CM occurs in young African children1. A 0.35T MRI scanner with a resistive magnet was installed in Malawi to better elucidate the pathophysiology of CM. Hyperintense DWI abnormalities were commonly identified2, but due to scanner limitations, quantitative apparent diffusion coefficient (ADC) maps could not be generated. This impeded the understanding of pathophysiology of CM, since high DWI levels can be due to either reduction in ADC or T2 shine-through, each corresponding to different pathological states. Our study aimed to calculate ADC values in a subset of children with CM, and further evaluate the unusual pattern of transient restricted diffusion, predominantly involving WM without residual structural abnormalities.
Methods
This study was performed at the Queen Elizabeth Central Hospital in Blantyre, Malawi. Sixty-five pediatric patients who met the clinical case definition of CM (Blantyre coma score ≤ 2) were included in the study. MRI was performed on a GE Signa Ovation Excite 0.35T MRI scanner (GE Healthcare, Milwaukee, Wisconsin) and a birdcage head coil. Patients were scanned at admission and daily whilst in coma. The MR protocol included a sagittal T1-weighted scan and DWI. DWI was acquired with one b=200s/mm2 and one b=900s/mm2, with the diffusion gradients switched on separately for three directions: axial, coronal, and sagittal; TR/TE=8000/140.3ms; FOV=320×320 mm2; acquisition matrix=64×64; slice thickness=6/7/7 mm for each of the three diffusion gradient directions, respectively. DWIs of different b and gradient orientations were acquired with separate imaging series due to limited technical capability of the scanner. The details of quantitative analysis were presented previously3. Briefly, the ADC calculation was performed using DWI pairs with b=200s/mm2 and b=900 s/mm2. The data processing included brain extraction, image registration, and ADC calculation. The ADC is calculated from a pair of DWI images along certain diffusion gradient using the equation Eq.(1):
$$\frac{S_{x,b}}{S_{0}}=\exp\left(-b\cdot D_{x}\right)$$ Eq.(1)
To make the ADC non-sensitive to diffusion gradient direction, we average three diffusion coefficient maps along x, y, and z axis, as in Eq. (2):
$$ADC=\frac{1}{3}\cdot\left(D_{x}+D_{y}+D_{z}\right)$$ Eq.(2)
To eliminate the ambiguity of T2 shine-through, we also calculated the T2-weighted b=0 image, using Eq.(3):
$$\ln\left(S_{0}\right)=\frac{\ln\left(S_{200}\right)-\ln\left(S_{900}\right)}{900-200}\times200+\ln\left(S_{200}\right)$$ Eq.(3)
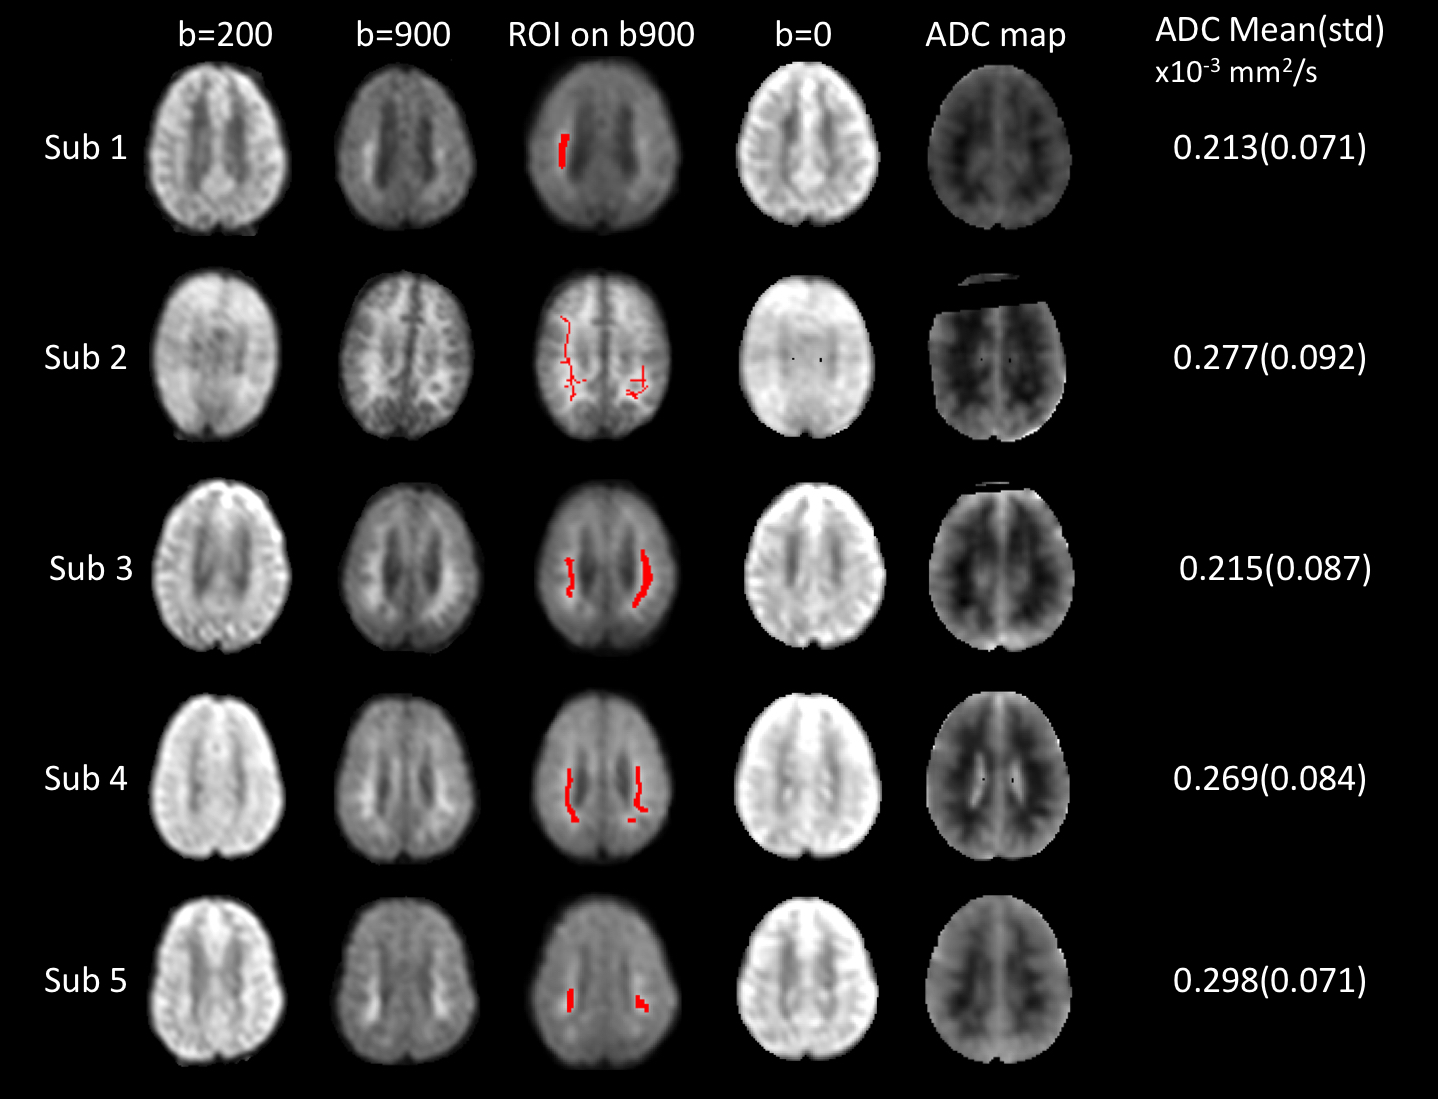
Two fellowship-trained radiologists interpreted all studies independently. Admission images were compared with those taken on the next day to study changes in DWI signal. Five patients with DWI abnormalities in WM regions were chosen to further calculate ADC, in order to distinguish between restricted diffusion or T2 shine-through. Region of interests (ROI) were manually drawn on the b=900s/mm2, where DWI signals were obviously elevated. The ADC map and mean/standard deviation(std) were calculated.
Results
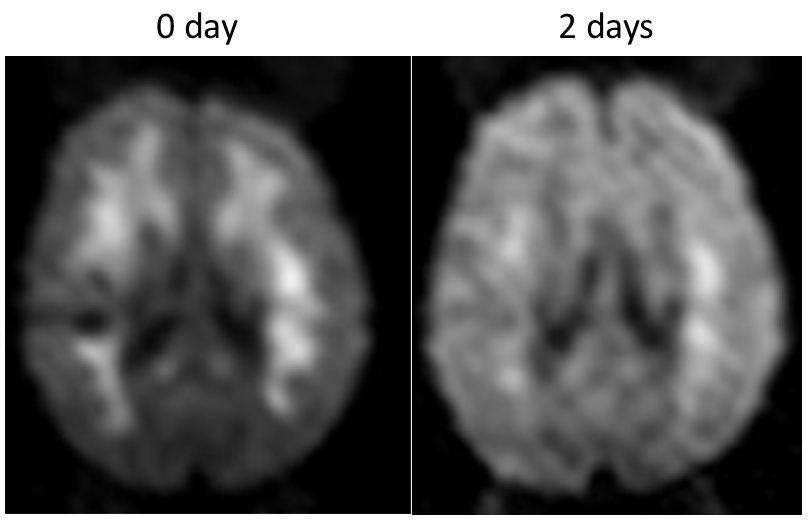
Thirty-nine patients (60%) had acute DWI findings, and 31 patients (79%) had diffuse WM involvement, with 23 showing true restricted diffusion. Figure. 1 shows DWI results from 5 patients. The T2-w b=0 image show normal contrast, and the regions of interests do not have long T2-delay, corresponding to high signal on b=0 images. In addition, the ADC value which is independent of the influence of T2 shine-through also suggests that WM is under true restricted diffusion. The mean ADC of ROIs is 0.213–0.298×10⁻³ mm2/s, much lower than the normal range4 0.6-0.8×10⁻³ mm2/s. In Figure. 2 we also demonstrate the case for an 8-year-old acute CM patient who showed WM DWI abnormalities, that cleared after 2 days while the patient was still in acute coma.Discussion
Our proposed method for ADC calculation and b=0 DWI reconstruction proved the true restricted diffusion in WM, rather than T2 shine-through. Also, we described this frequent, unusual pattern of transient restricted diffusion predominantly involving the WM without residual structural abnormalities. The majority of those with DWI abnormalities in our cohort (31, 79%) demonstrated diffuse WM involvement similar to the typical appearance of acute toxic leukoencephalopathy (ATL)5. Reversible diffusion restriction is also described in acute severe hypoglycemia, and is commonly completely reversible with appropriate treatment6.Conclusion
The pathogenesis of CM is complex, and likely a multifactorial process. Reversible diffusion restriction predominantly involving WM was observed in this study, but pathophysiology in CM remains to be fully elucidated.Acknowledgements
No acknowledgement found.References
1. S.I. Hay, E.A. Okiro, P.W. Gething, A.P. Patil, A.J. Tatem, C.A. Guerra, R.W. Snow, Estimating the global clinical burden of Plasmodium falciparum malaria in 2007, PLoS Med, 7 (2010) e1000290.
2. M.J. Potchen, S.D. Kampondeni, K.B. Seydel, G.L. Birbeck, C.A. Hammond, W.G. Bradley, J.K. DeMarco, S.J. Glover, J.O. Ugorji, M.T. Latourette, J.E. Siebert, M.E. Molyneux, T.E. Taylor, Acute brain MRI findings in 120 Malawian children with cerebral malaria: new insights into an ancient disease, AJNR Am J Neuroradiol, 33 (2012) 1740-1746.
3. Y. Zhuang, M.J. Potchen, S.D. Kampondeni, M. Tivarus, G.L. Birbeck, J. Zhong, Validation of diffusion measurements obtained on a 0.35T MR in Malawi: Important insights for radiologists in low income settings with low field MRI, Magn Reson Imaging, 45 (2017) 120-128.
4. J. Helenius, L. Soinne, J. Perkio, O. Salonen, A. Kangasmaki, M. Kaste, R.A.D. Carano, H.J. Aronen, T. Tatlisumak, Diffusion-weighted MR imaging in normal human brains in various age groups, Am J Neuroradiol, 23 (2002) 194-199.
5. M. Rimkus Cde, C.S. Andrade, C. Leite Cda, A.M. McKinney, L.T. Lucato, Toxic leukoencephalopathies, including drug, medication, environmental, and radiation-induced encephalopathic syndromes, Semin Ultrasound CT MR, 35 (2014) 97-117.
6. T. Aoki, T. Sato, K. Hasegawa, R. Ishizaki, M. Saiki, Reversible hyperintensity lesion on diffusion-weighted MRI in hypoglycemic coma, Neurology, 63 (2004) 392-393.
Figures