0749
Diffusion Anisotropy of the Extra-Axonal Environment is Linked to Axon Alignment1Department of Neuroscience, Medical University of South Carolina, Charleston, SC, United States, 2Department of Neurology, Medical University of South Carolina, Charleston, SC, United States, 3Center for Biomedical Imaging, Medical University of South Carolina, Charleston, SC, United States
Synopsis
A better understanding of the complex water diffusion dynamics in the extra-axonal environment may aid in the mathematical modeling of the diffusion MRI signal and have application to pathologies that specifically impact glial cells and the surrounding extracellular space. Here we employ a novel method of combining diffusion MRI data for weak and strong diffusion weightings to show that extra-axonal water diffusion anisotropy strongly correlates with intra-axonal diffusion anisotropy and takes on large values in voxels with highly aligned axons. This connection suggests that the geometrical alignment of axonal fibers is important for both intra-axonal and extra-axonal water diffusion.
Introduction
Water diffusion dynamics in the extra-axonal space of white matter (WM) is complicated by the presence of glial cells and the complex geometrical restrictions imposed by axonal fibers. As a consequence, idealizations are necessary, in practice, in order to model the contribution of extra-axonal water to the diffusion MRI signal. These range from treating the extra-axonal space as a simple isotropic, Gaussian compartment1-3 to more elaborate, non-Gaussian signal models4-6. A better understanding of extra-axonal water diffusion can help guide the development and application of such models. In addition, many neurological diseases are known to affect components of the extra-axonal environment (e.g. microglia, oligodendrocytes) and a better characterization of the extra-axonal water diffusion with MRI may be useful in the study of these pathologies. Diffusion MRI techniques that utilize strong diffusion weightings, such as fiber ball imaging (FBI)7, allow for the direct study of intra-axonal diffusion by suppressing the dMRI signal from extra-axonal water. Here, FBI is combined with low b-value data to infer the diffusion anisotropy of the extra-axonal environment. Using data from one healthy control, we investigate the Fractional Anisotropy of the Extra-axonal compartment (FAE) and how it is related to the Fractional Anisotropy (FA) of the intra-Axonal space (FAA). The FAE and FAA are defined in terms of the extra-axonal and intra-axonal diffusion tensors in a manner completely analogous to the conventional definition of FA in terms of the full diffusion tensor.Methods
dMRI data from one healthy adult (30 yrs) were acquired on a Siemens Prisma scanner for 4 b-value shells with b = 0, 1000, 2000 and 6000 s/mm2 and 30, 30 and 256 diffusion encoding directions, respectively. Additional imaging parameters were TE = 98 ms, TR = 5100 ms and voxel size = (3 mm)3. Estimations of the total diffusion tensor, $$$\bf{D}$$$ , were obtained through conventional calculations by using data from the first two shells8. The diffusion tensor for the intra-axonal compartment, $$$\bf{D_a}$$$, was calculated, up to an overall scaling factor, from the highest b-value shell with FBI. This yielded $$${\bf A}\equiv{\bf D_a}/D_a$$$ (1), with the unknown scaling factor, $$$D_a$$$, corresponding to the intrinsic intra-axonal diffusivity. Under the assumption that myelin water can be neglected due to its short T2, $$$\bf{D}$$$ is related to $$$\bf{D_a} $$$ and the extra-axonal diffusion tensor, $$$\bf{D_e}$$$ by
$${\bf D}=f \cdot{\bf D_a}+ (1-f)\cdot{\bf D_e}\space\space(2), $$
where $$$f$$$ is the axonal water fraction. This can be rearranged into $${\bf D_e}=\frac{{\bf D}-f\cdot{\bf D_a}}{1-f}\space\space(3) $$
Since FBI also yields estimates for the microstructural parameter $$$\zeta=f/\sqrt D_a$$$7, it is useful to rewrite Equation (3) in the form
$${\bf D_e}=\frac{{\bf D}-\zeta\cdot\sqrt D_a^3\cdot{\bf A}}{1-\zeta\cdot\sqrt D_a}\space\space(4) $$
Thus given a value for $$$D_a$$$, one can calculate $$$\bf{D_e}$$$ along with its associated anisotropy FAE. Here we calculate FAE in healthy WM for a physically plausible range of (1, 1.5, 2, and 2.5 µm2/ms)4-6,9,10. Voxels with a mean diffusivity lower than 1.5 µm2/ms and a mean kurtosis larger than 1 were considered to be WM.
Results
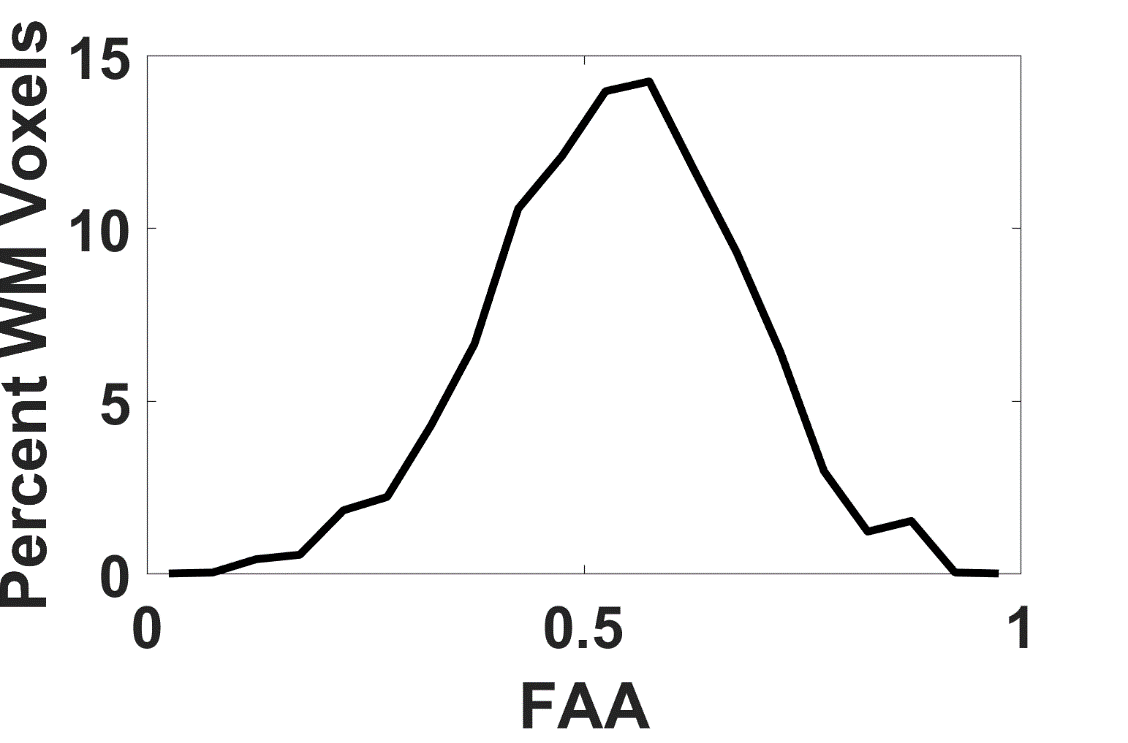
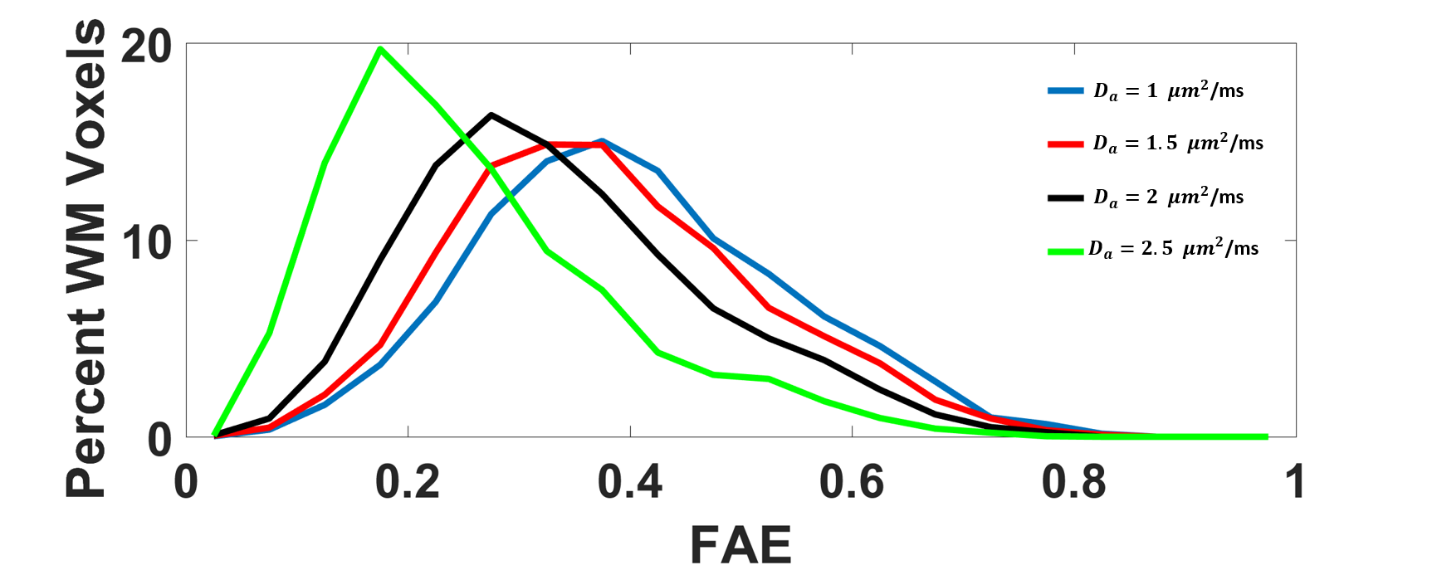
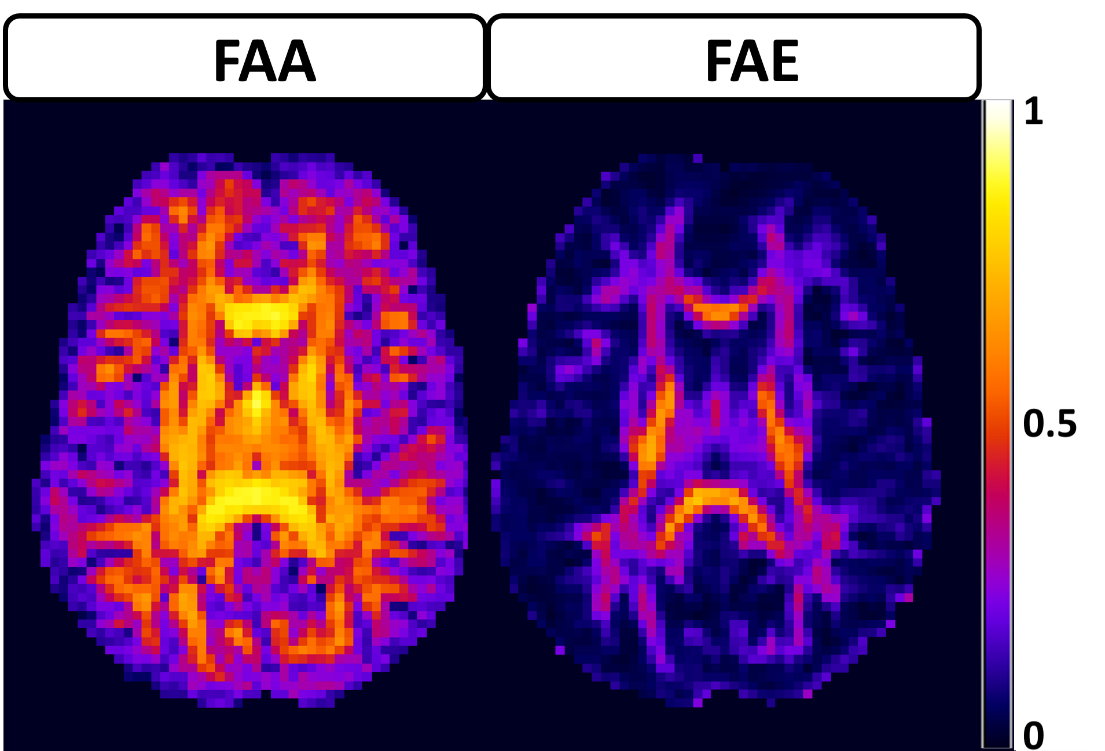
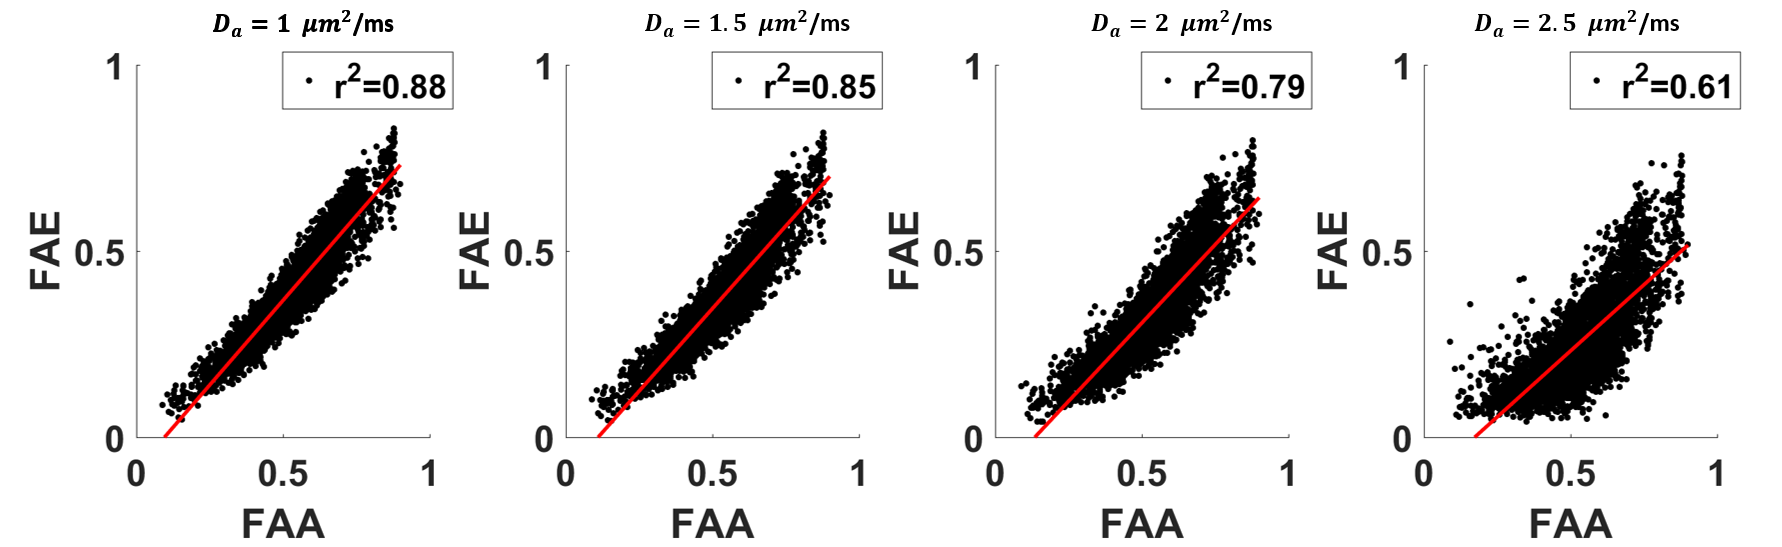
The average FAA of the intra-axonal water in WM is found to be 0.54±0.13, and the distribution of FAA values is shown in Figure 1. Not surprisingly, the FAE is lower than the FAA at 0.40±0.14, 0.37±0.13, 0.33±0.13 and 0.26±0.13 for $$$D_a$$$ = 1, 1.5, 2, and 2.5 µm2/ms (Figure 2). The large standard deviations are indicative of a heterogeneous microstructural environment, and the regional variability is illustrated in Figure 3 using voxelwise parametric maps of FAA and FAE. The relationship between FAA and FAE is shown in Figure 4, revealing strong correlations for all the $$$D_a$$$ values considered. The coefficients of determination decrease as is increased, with r2 values of 0.88, 0.85, 0.79 and 0.61 for $$$D_a$$$ = 1, 1.5, 2, and 2.5 µm2/ms, respectively.
Discussion
Our results imply three main conclusions. First, the FAE is substantial with an average value exceeding 0.25 for all the $$$D_a$$$ values considered. This suggests that treating the extra-axonal compartment as isotropic may not be an accurate representation of its water diffusion dynamics. Second, diffusional anisotropy in the extra-axonal compartment has high degree of regional variability, as illustrated by Figure 3, including many voxels with FAE values exceeding 0.4. Third, the FAE is strongly linked to the FAA, suggesting that the geometrical alignment of axons has a pronounced effect on extra-axonal water diffusion. A limitation of this study is that our results depend on the choice of $$$D_a$$$. This is unavoidable given our present understanding of water diffusion in brain, since a definite value for has yet to be established10. Nonetheless, this work adds to our understanding of extra-axonal water diffusion and may serve to guide the development and evaluation of improved models for the diffusion MRI signal.Acknowledgements
This work was supported by: NIH T32 DC0014435 (Trainee EM), NIH DC014021 and The Litwin foundation (JAH)References
1 Jespersen, S. N., Kroenke, C. D., Ostergaard, L., Ackerman, J. J. & Yablonskiy, D. A. Modeling dendrite density from magnetic resonance diffusion measurements. Neuroimage 34, 1473-1486, doi:10.1016/j.neuroimage.2006.10.037 (2007). 2 Pasternak, O., Sochen, N., Gur, Y., Intrator, N. & Assaf, Y. Free water elimination and mapping from diffusion MRI. Magn Reson Med 62, 717-730, doi:10.1002/mrm.22055 (2009). 3 Behrens, T. E. et al. Characterization and propagation of uncertainty in diffusion-weighted MR imaging. Magn Reson Med 50, 1077-1088, doi:10.1002/mrm.10609 (2003). 4 Assaf, Y., Freidlin, R. Z., Rohde, G. K. & Basser, P. J. New modeling and experimental framework to characterize hindered and restricted water diffusion in brain white matter. Magn Reson Med 52, 965-978, doi:10.1002/mrm.20274 (2004). 5 Zhang, H., Schneider, T., Wheeler-Kingshott, C. A. & Alexander, D. C. NODDI: practical in vivo neurite orientation dispersion and density imaging of the human brain. Neuroimage 61, 1000-1016, doi:10.1016/j.neuroimage.2012.03.072 (2012). 6 Veraart, J., Novikov, D. S. & Fieremans, E. TE dependent Diffusion Imaging (TEdDI) distinguishes between compartmental T2 relaxation times. Neuroimage, doi:10.1016/j.neuroimage.2017.09.030 (2017). 7 Jensen, J. H., Russell Glenn, G. & Helpern, J. A. Fiber ball imaging. Neuroimage 124, 824-833, doi:10.1016/j.neuroimage.2015.09.049 (2016). 8 Jensen, J. H. & Helpern, J. A. MRI quantification of non-Gaussian water diffusion by kurtosis analysis. NMR Biomed 23, 698-710, doi:10.1002/nbm.1518 (2010). 9 Fieremans, E., Jensen, J. H. & Helpern, J. A. White matter characterization with diffusional kurtosis imaging. Neuroimage 58, 177-188, doi:10.1016/j.neuroimage.2011.06.006 (2011). 10 Jelescu, I. O., Veraart, J., Fieremans, E. & Novikov, D. S. Degeneracy in model parameter estimation for multi-compartmental diffusion in neuronal tissue. NMR Biomed 29, 33-47, doi:10.1002/nbm.3450 (2016).Figures