0745
Assessing the asynchronous macrostructural changes in white matter tracts of the developing brain1Sir Peter Mansfield Imaging Centre, School of Medicine, University of Nottingham, Nottingham, United Kingdom, 2Wellcome Centre for Integrative Neuroscience - Oxford Centre for Functional Magnetic Resonance Imaging of the Brain (FMRIB), University of Oxford, Oxford, United Kingdom
Synopsis
We have developed an approach to elucidate the macrostructural changes of individual white matter tracts in neonatal brains, using deformation-based morphometry. Many studies have investigated how microstructure changes during development, however it is not clear how to disentangle changes in tissue microstructure from macrostructural volume changes. The latter is particularly challenging in the absence of longitudinal data from the same subject, which is the norm given the difficulty in scanning neonates. We propose an approach that is aimed towards this problem. Results are presented from analysis carried out on publicly available diffusion MRI data from the developing Human Connectome Project.
Introduction
Characterising typical early white matter development is a crucial first step towards understanding the links between structure and function in the developing brain1,2. Many studies have investigated how tissue microstructure changes during development1,3,4, however it is unclear how to disentangle changes in MRI-derived microstructure indices from macrostructural volume changes. The latter is particularly challenging in the absence of longitudinal data from the same subject, which is the norm given the difficulty in scanning neonates. Here, we propose an approach that is aimed towards this problem. We define subject-specific tract ROIs generated from standardised tractography procotols. We then employ features from non-linear warp fields to estimate volume changes with respect to a baseline. We use these to capture micro and macro-structural changes within individual white matter tracts.
Methods
We used diffusion
MRI data from the first public release of the Developing Human Connectome
Project (dHCP). Specifically, 40 neonatal subjects (15 females, ages 37 to
44 weeks post conception), were imaged during natural sleep at 3T with a
dedicated neonatal imaging system5,6. Pre-processing
and distortion correction was carried out according to the dHCP pipeline7.
Tractography was performed using standard space
protocols to obtain 25 (11 bilateral) tracts across subjects. Fibre
orientations were estimated using a parametric deconvolution approach8 available in FSL. Probabilistic tractography
was then used to reconstruct WM tracts in each subject using protocols defined
in template neonatal space9 with pre-specified seeds, exclusion masks, and
waypoints7,10. The obtained tracts are shown in figure 1. A
diffusion tensor model was fitted to the data from the b = 400 s/mm2 and 1000 s/mm2 shells and FA
and MD maps were obtained. Average microstructural parameters were calculated
over a binary mask of each tract in diffusion space (thresholded path probability of 0.005). Deformation-based morphometry was used to assess
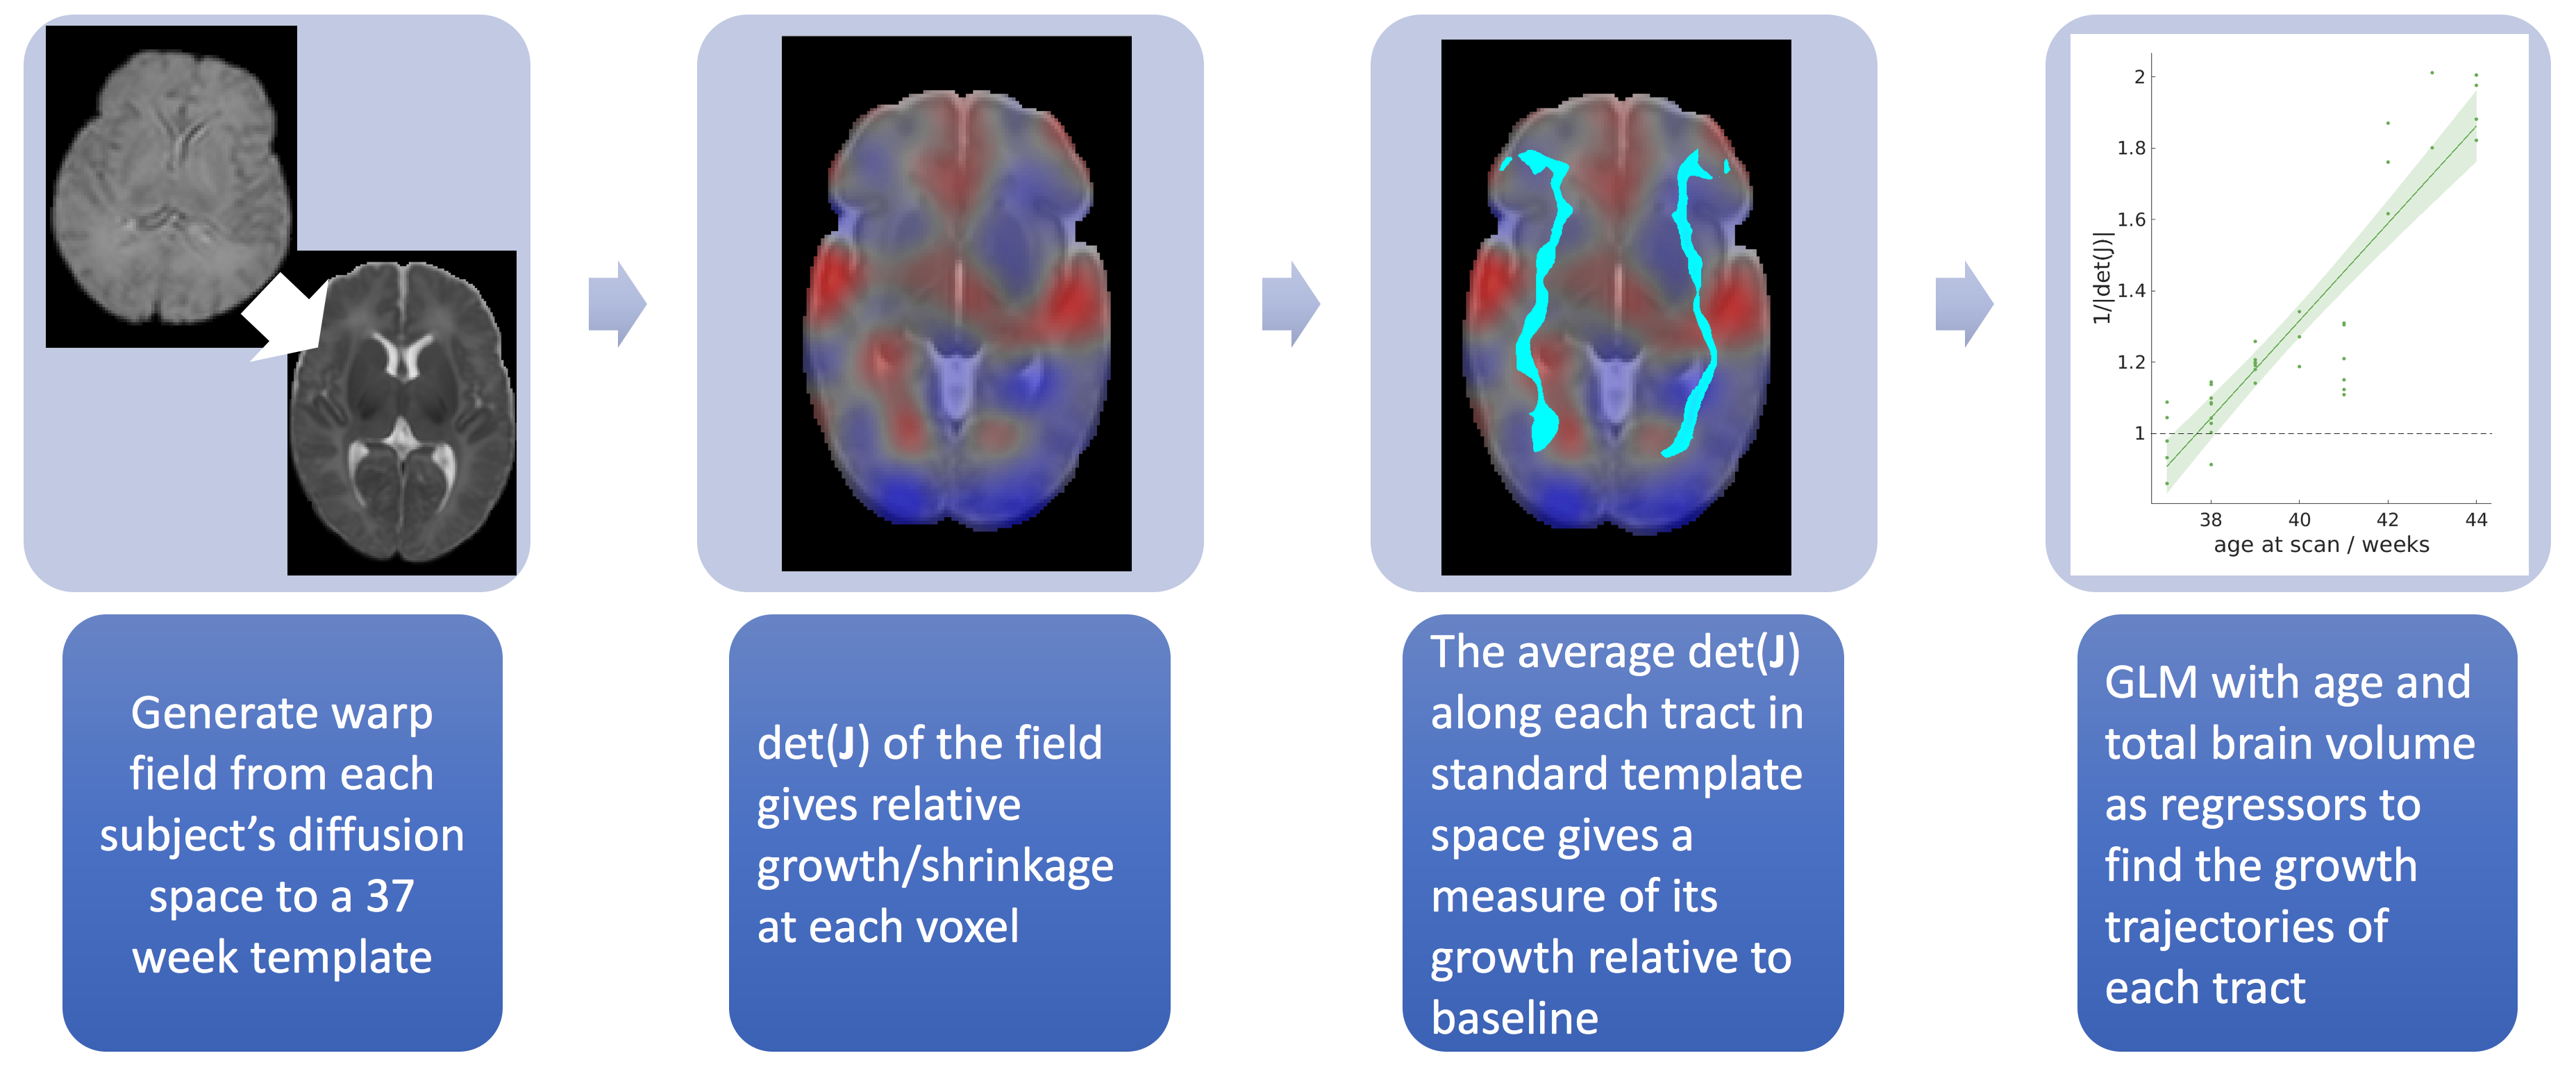
tract growth, as illustrated in figure 2. Non-linear warps from each subject's native
dMRI space to a standard 37-week template space9 were generated with Advanced Normalisation
Tools (ANTs)11. We produced the Jacobian, J, of each warp field - a tensor at each voxel that describes the positions of
the data in relation to the template. The absolute value of the determinant of
the Jacobian (|det(J)|) at each
point gives the factor by which the local volume expands (|det(J)|>1) or shrinks (0<|det(J)|<1) due to the transformation. The
median 1/|det(J)| within each tract was
used as a measure of the relative volume change compared to the template. A
generalized linear model was then used to assess the growth of each tract with
age, with total brain volume included as a regressor.
Results and Discussion
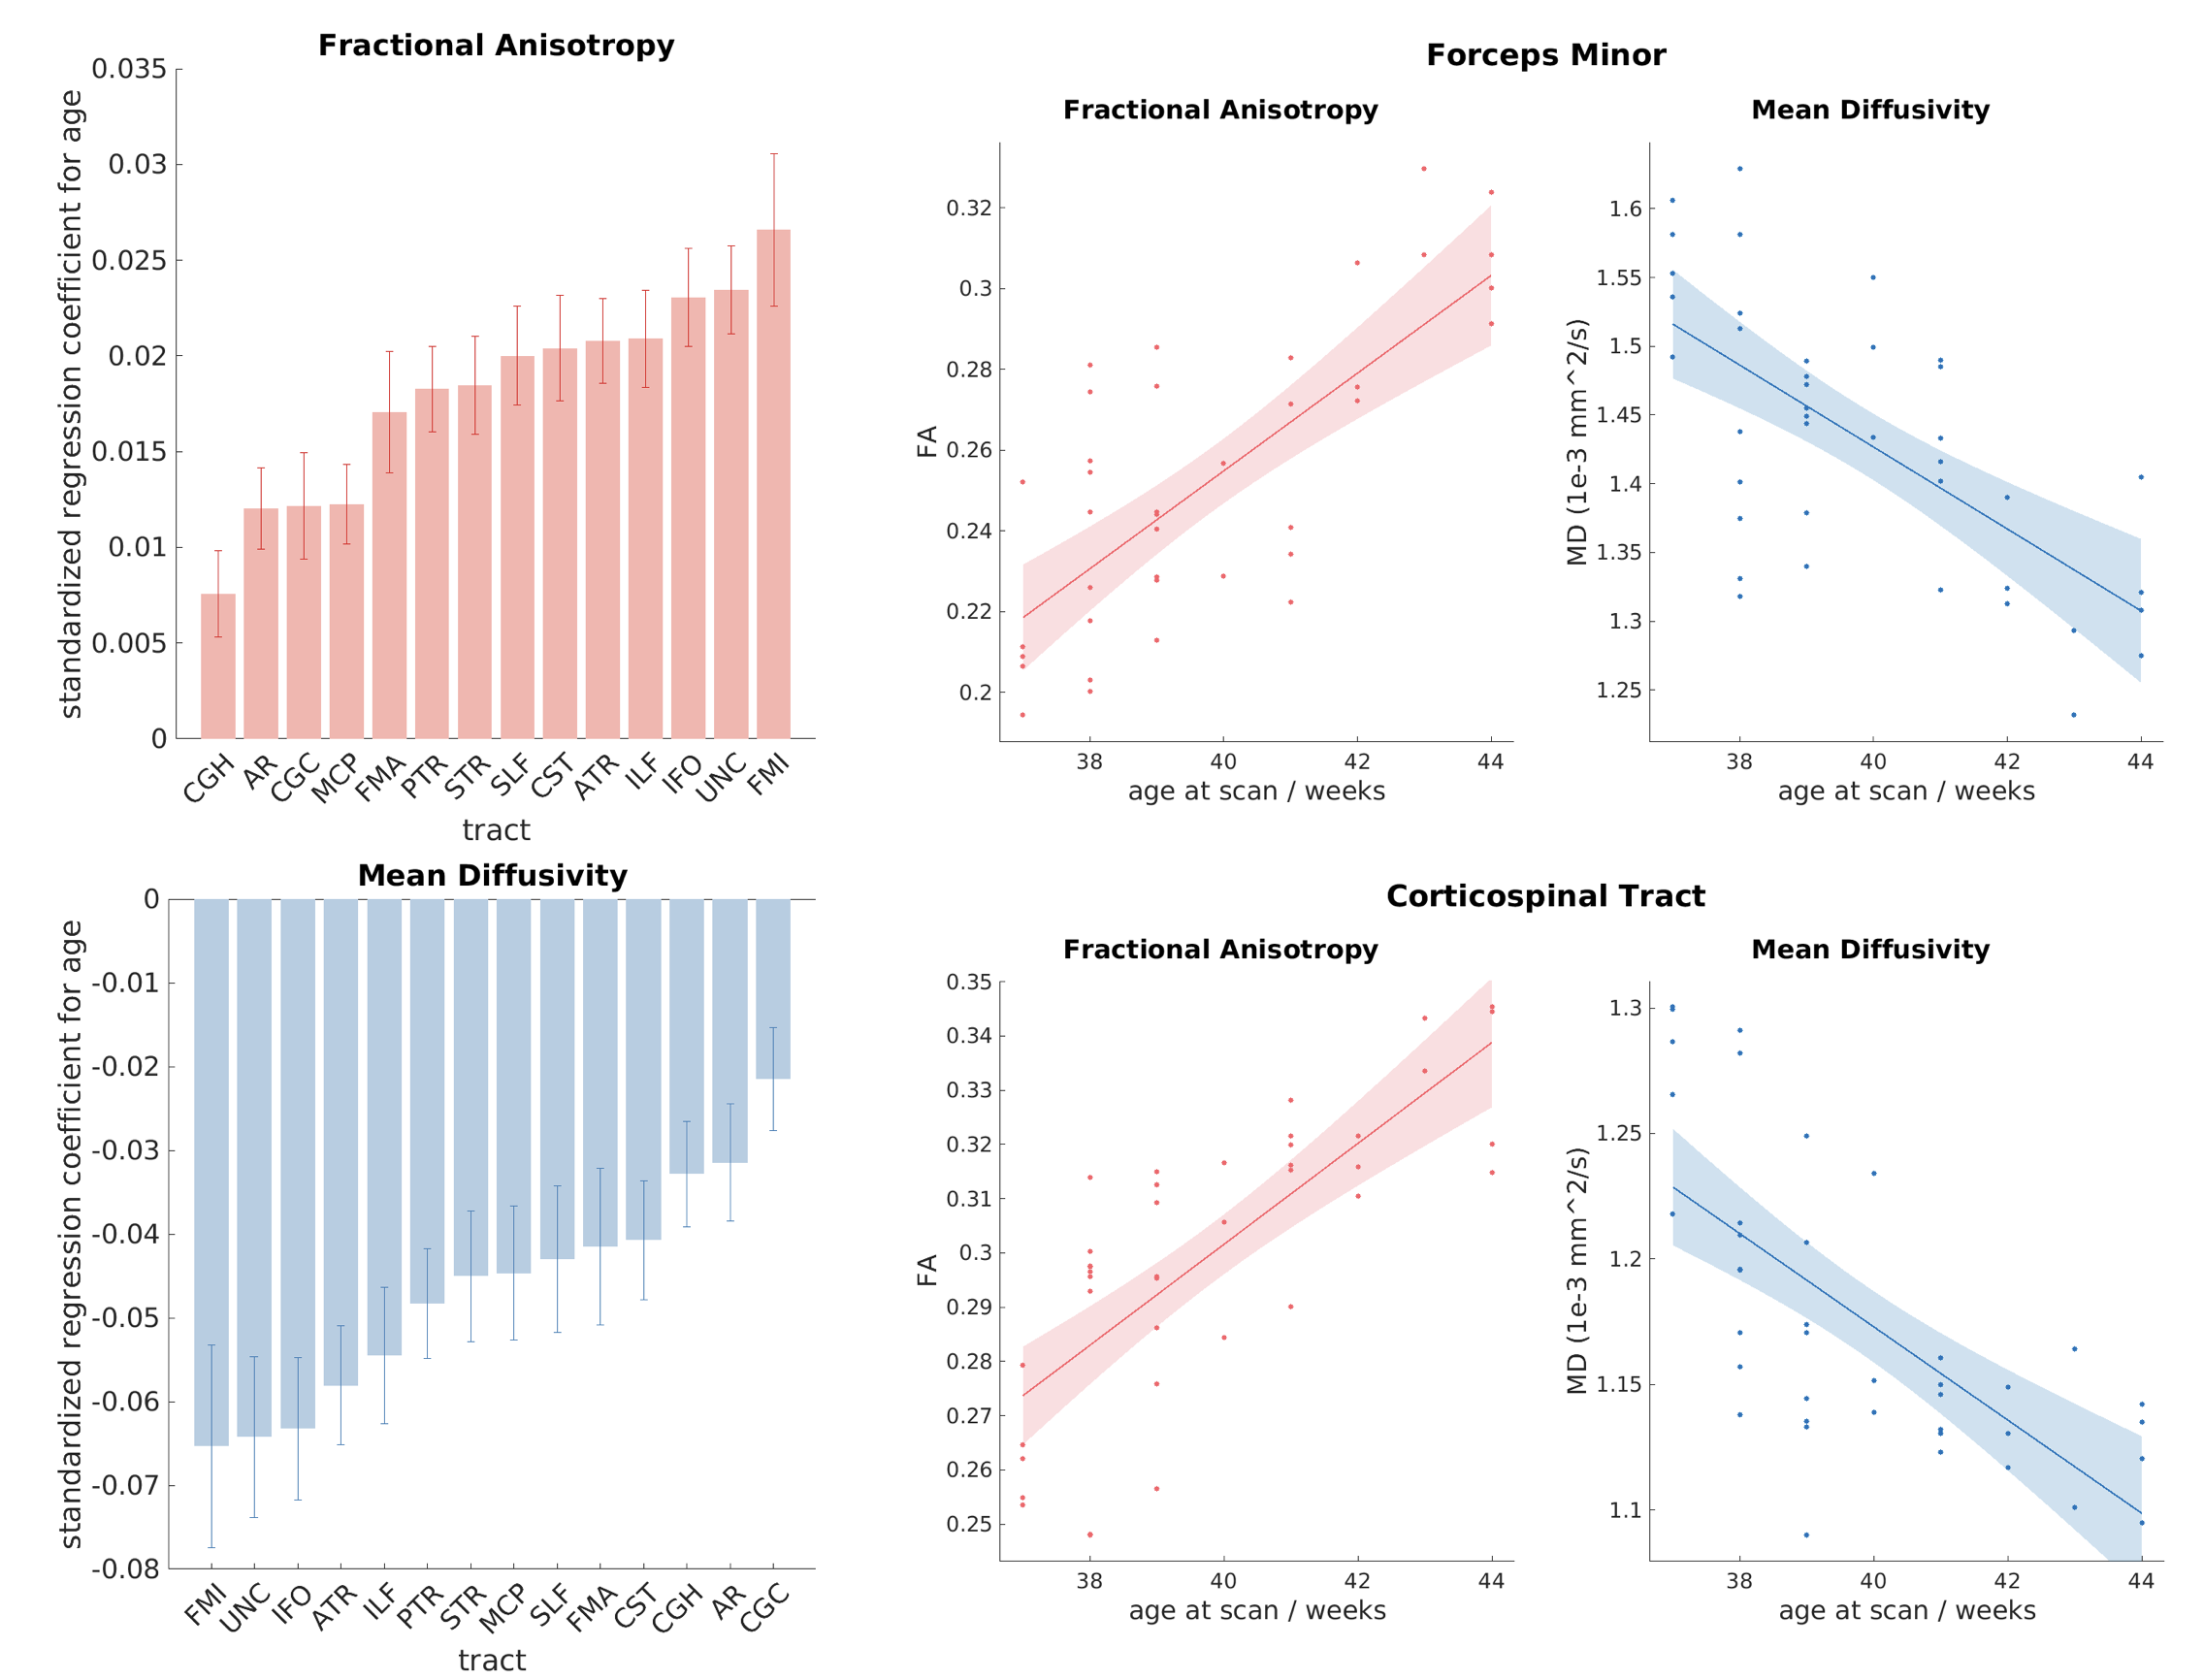
We first performed a regression between age and tract-specific
microstructural indices. The results are shown in figure 3, with the heights of
the bars representing the standardised regression coefficients. FA shows
a significant increase with age for each tract, while MD shows a significant reduction. There was good correspondence between the rates of
development characterised by FA and MD. The most rapidly developing tract was the
forceps minor, and the most slowly developing was the cingulum. This is in agreement
with results from previous studies, in which the cingulum was found to be among the most slowly
developing fibre bundles in terms of both myelination12 and dMRI-derived FA and MD3.
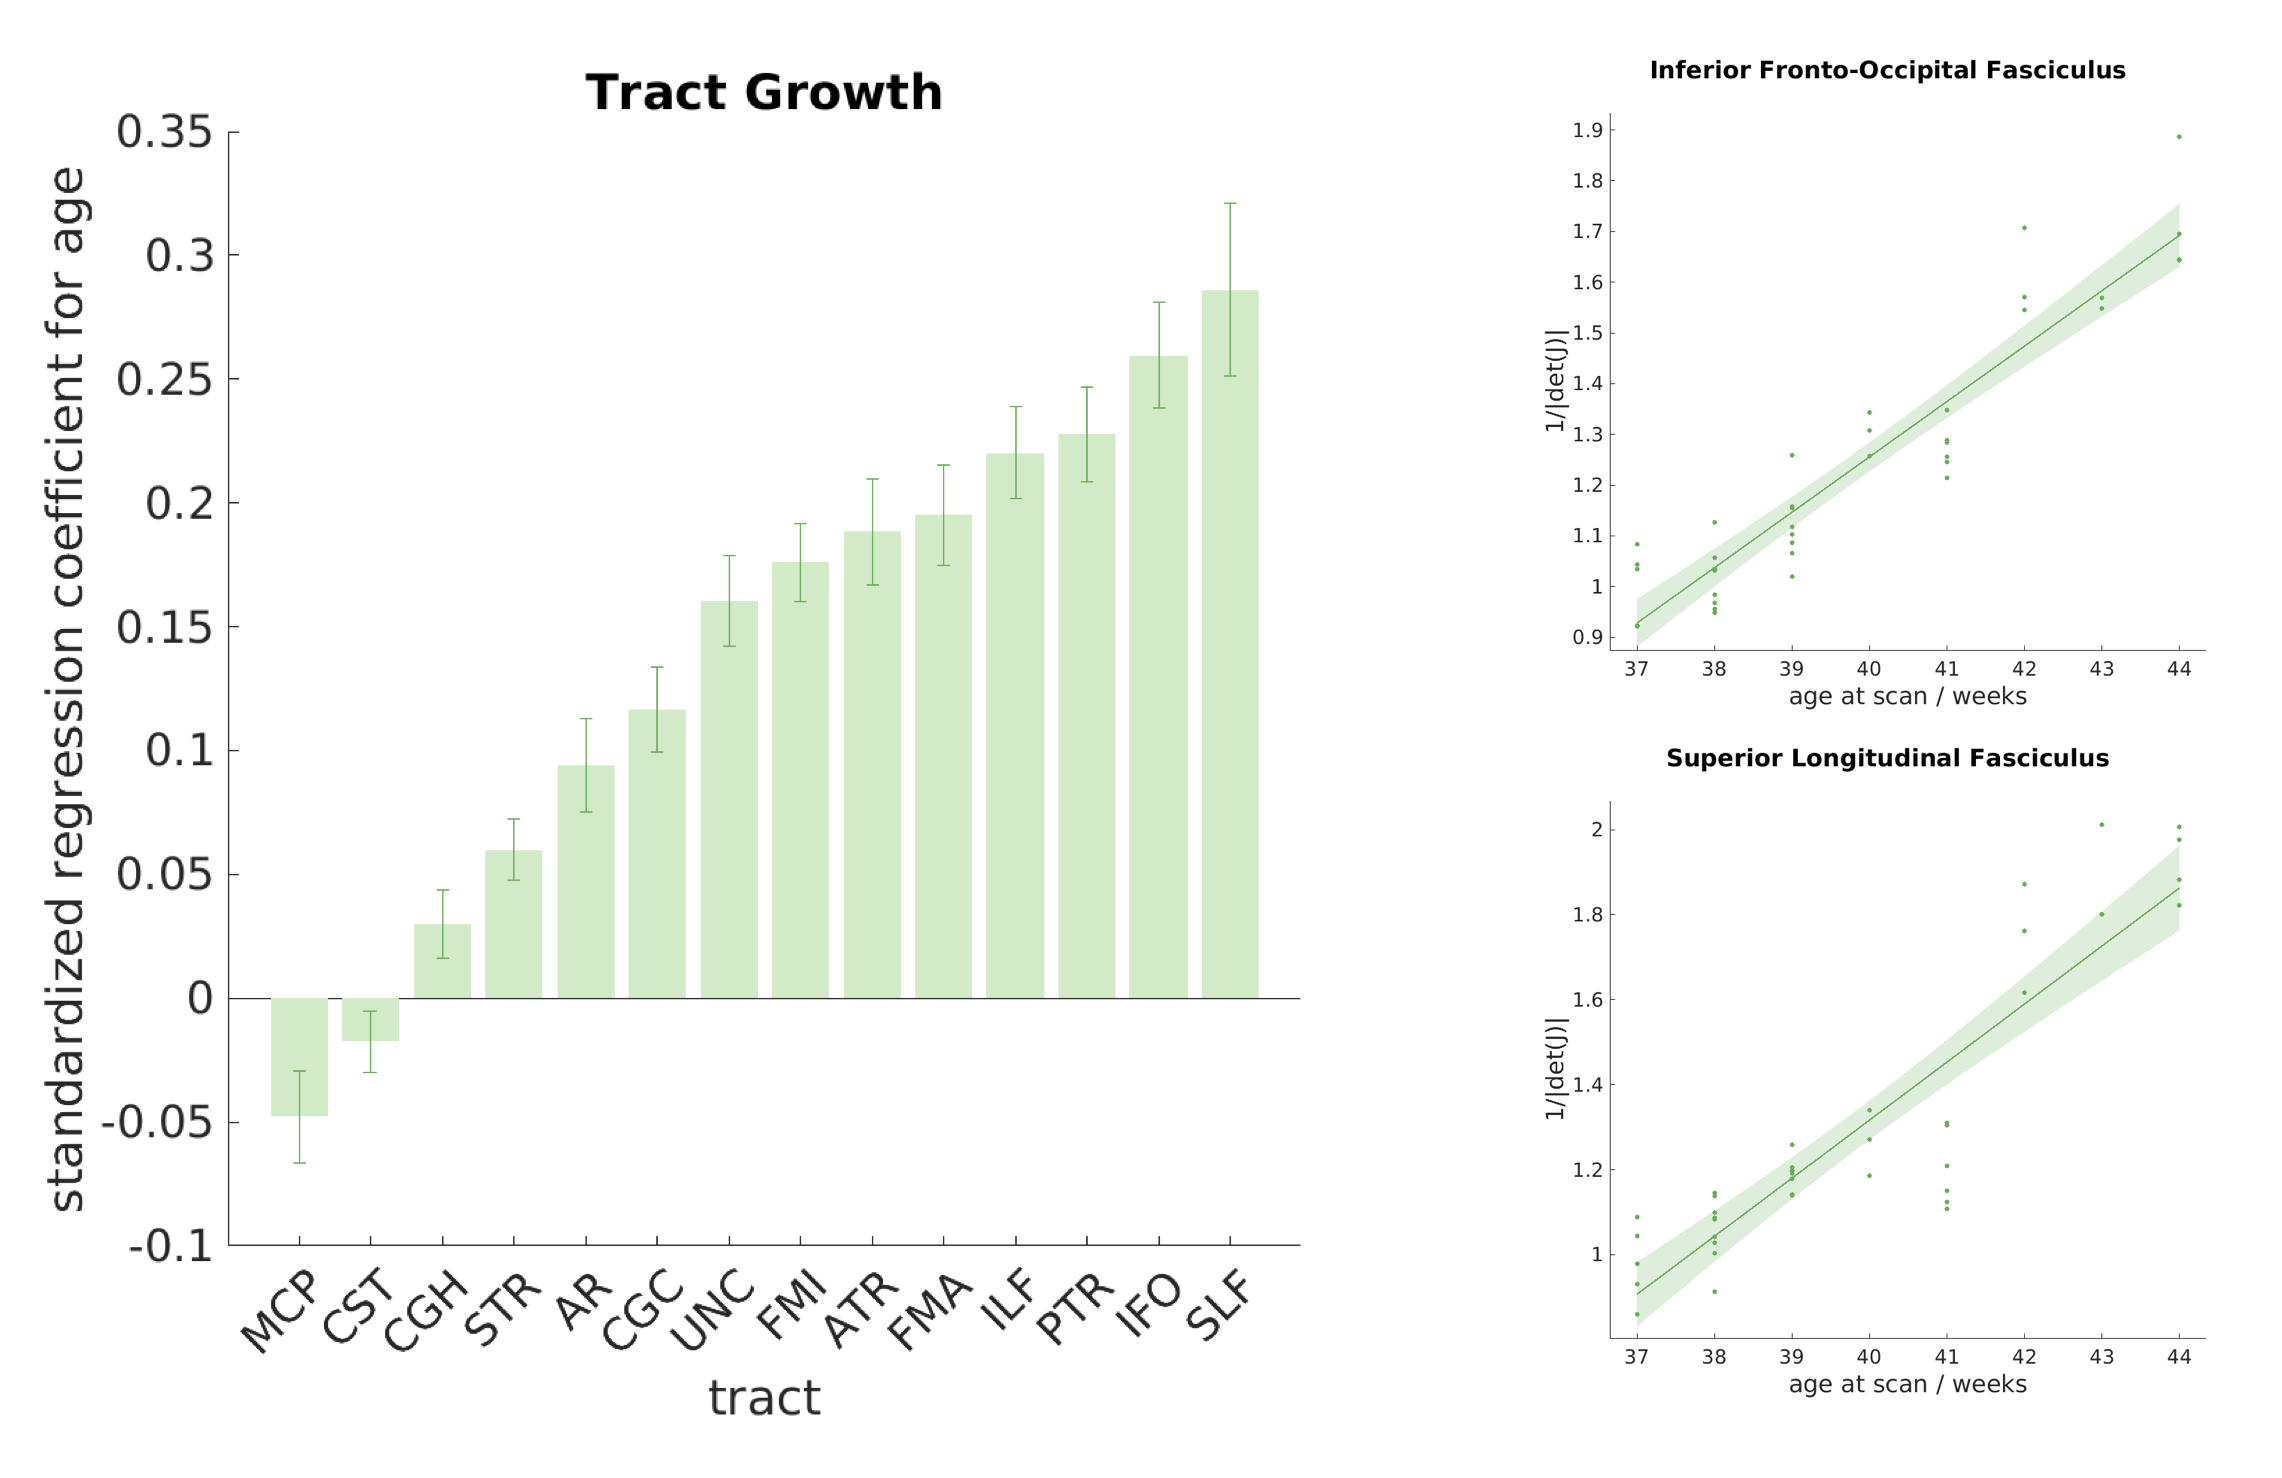
The standardised
regression coefficients between age and volume changes are shown for each tract
in figure 4. Eleven of the tracts showed
significant positive correlation with the average 1/|det(J)|, after correction for multiple comparisons, indicating
volumetric growth. An opposite trend was observed in one tract, the middle
cerebellar peduncle, although this was not significant after correction for
multiple comparisons. This agrees with a similar trend reported in13,14, but warrants further investigation.
For
some tracts, such as the inferior fronto-occipital fasciculus and the
inferior-longitudinal fasciculus, both microstructure and volume changes happen
quite rapidly. For others, volume changes do not necessarily align with
microstructural development. For example, we did not observe significant
volumetric growth in the corticospinal tract, but it displayed above-average
rate of microstructural maturation. These trends are in agreement with the
expectation that macroscopic developmental changes are separate from
myelination and axonal density increase, as there are several different
processes contributing to white matter volume increases, including developing
vasculature and proliferation of glial cells15.
Conclusion
We combined tractography and deformation-based morphometry to explore white matter changes in the early developing brain, using publicly available dMRI data from the dHCP. Even if micro and macrostructural changes with age were aligned for a number of tracts, the general trend suggested separate developmental processes.Acknowledgements
ET is funded by UK EPSRC and the UK MRC (grant EP/L016052/1). MB is supported by the European Research Council ERC Grant Agreement no. 319456. Data were provided by the Developing Human Connectome Project (PIs: Edwards, Hajnal, Rueckert, Smith), which is funded by the European Research Council / ERC Grant 319456.References
1. Counsell, S. J. et al. Specific relations between neurodevelopmental abilities and white matter microstructure in children born preterm. Brain 131, 3201–3208 (2008).
2. Hagmann, P. et al. White matter maturation reshapes structural connectivity in the late developing human brain. Proc. Natl. Acad. Sci. U. S. A. 107, (2010).
3. Dubois, J. et al. Asynchrony of the early maturation of white matter bundles in healthy infants: Quantitative landmarks revealed noninvasively by diffusion tensor imaging. Hum. Brain Mapp. 29, 14–27 (2008).
4. Zanin, E. et al. White matter maturation of normal human fetal brain. An in vivo diffusion tensor tractography study. Brain Behav. 1, 95–108 (2011).
5. Hughes, E. J. et al. A dedicated neonatal brain imaging system. Magn. Reson. Med. 78, 794–804 (2017). 6. Hutter, J. et al. Quiet echo planar imaging for functional and diffusion MRI. Magn. Reson. Med. (2017). doi:10.1002/mrm.26810
7. Bastiani, M. et al. Automate pre-processing pipeline and quality control for neonatal diffusion MRI in the developing Human Connectome Project (dHCP). in ISMRM 1269 (2017).
8. Sotiropoulos, S. N. et al. Fusion in diffusion MRI for improved fibre orientation estimation: An application to the 3T and 7T data of the Human Connectome Project. Neuroimage 134, 396–409 (2016).
9. Serag, A. et al. Construction of a consistent high-definition spatio-temporal atlas of the developing brain using adaptive kernel regression. Neuroimage 59, 2255–2265 (2012).
10. de Groot, M. et al. Improving alignment in Tract-based spatial statistics: Evaluation and optimization of image registration. Neuroimage 76, 400–411 (2013).
11. Avants, B. B. et al. A reproducible evaluation of ANTs similarity metric performance in brain image registration. Neuroimage 54, 2033–2044 (2011).
12. Kinney, H. C., Brody, B. A., Kloman, A. S. & Gilles, F. H. Sequence of Central Nervous System Myelination in Human Infancy II. Patterns of Myelination in Autopsied Infants. J. Neuropathol. Exp. Neurol. 47, 217–234 (1988).
13. Choe, M. S. et al. Regional infant brain development: An MRI-based morphometric analysis in 3 to 13 month olds. Cereb. Cortex 23, 2100–2117 (2013).
14. Re, T. J. et al. High-angular resolution diffusion imaging tractography of cerebellar pathways from newborns to young adults. Brain Behav. 7, e00589 (2017).
15. Dubois, J. et al. The early development of brain white matter: A review of imaging studies in fetuses, newborns and infants. Neuroscience 276, 48–71 (2014).
Figures
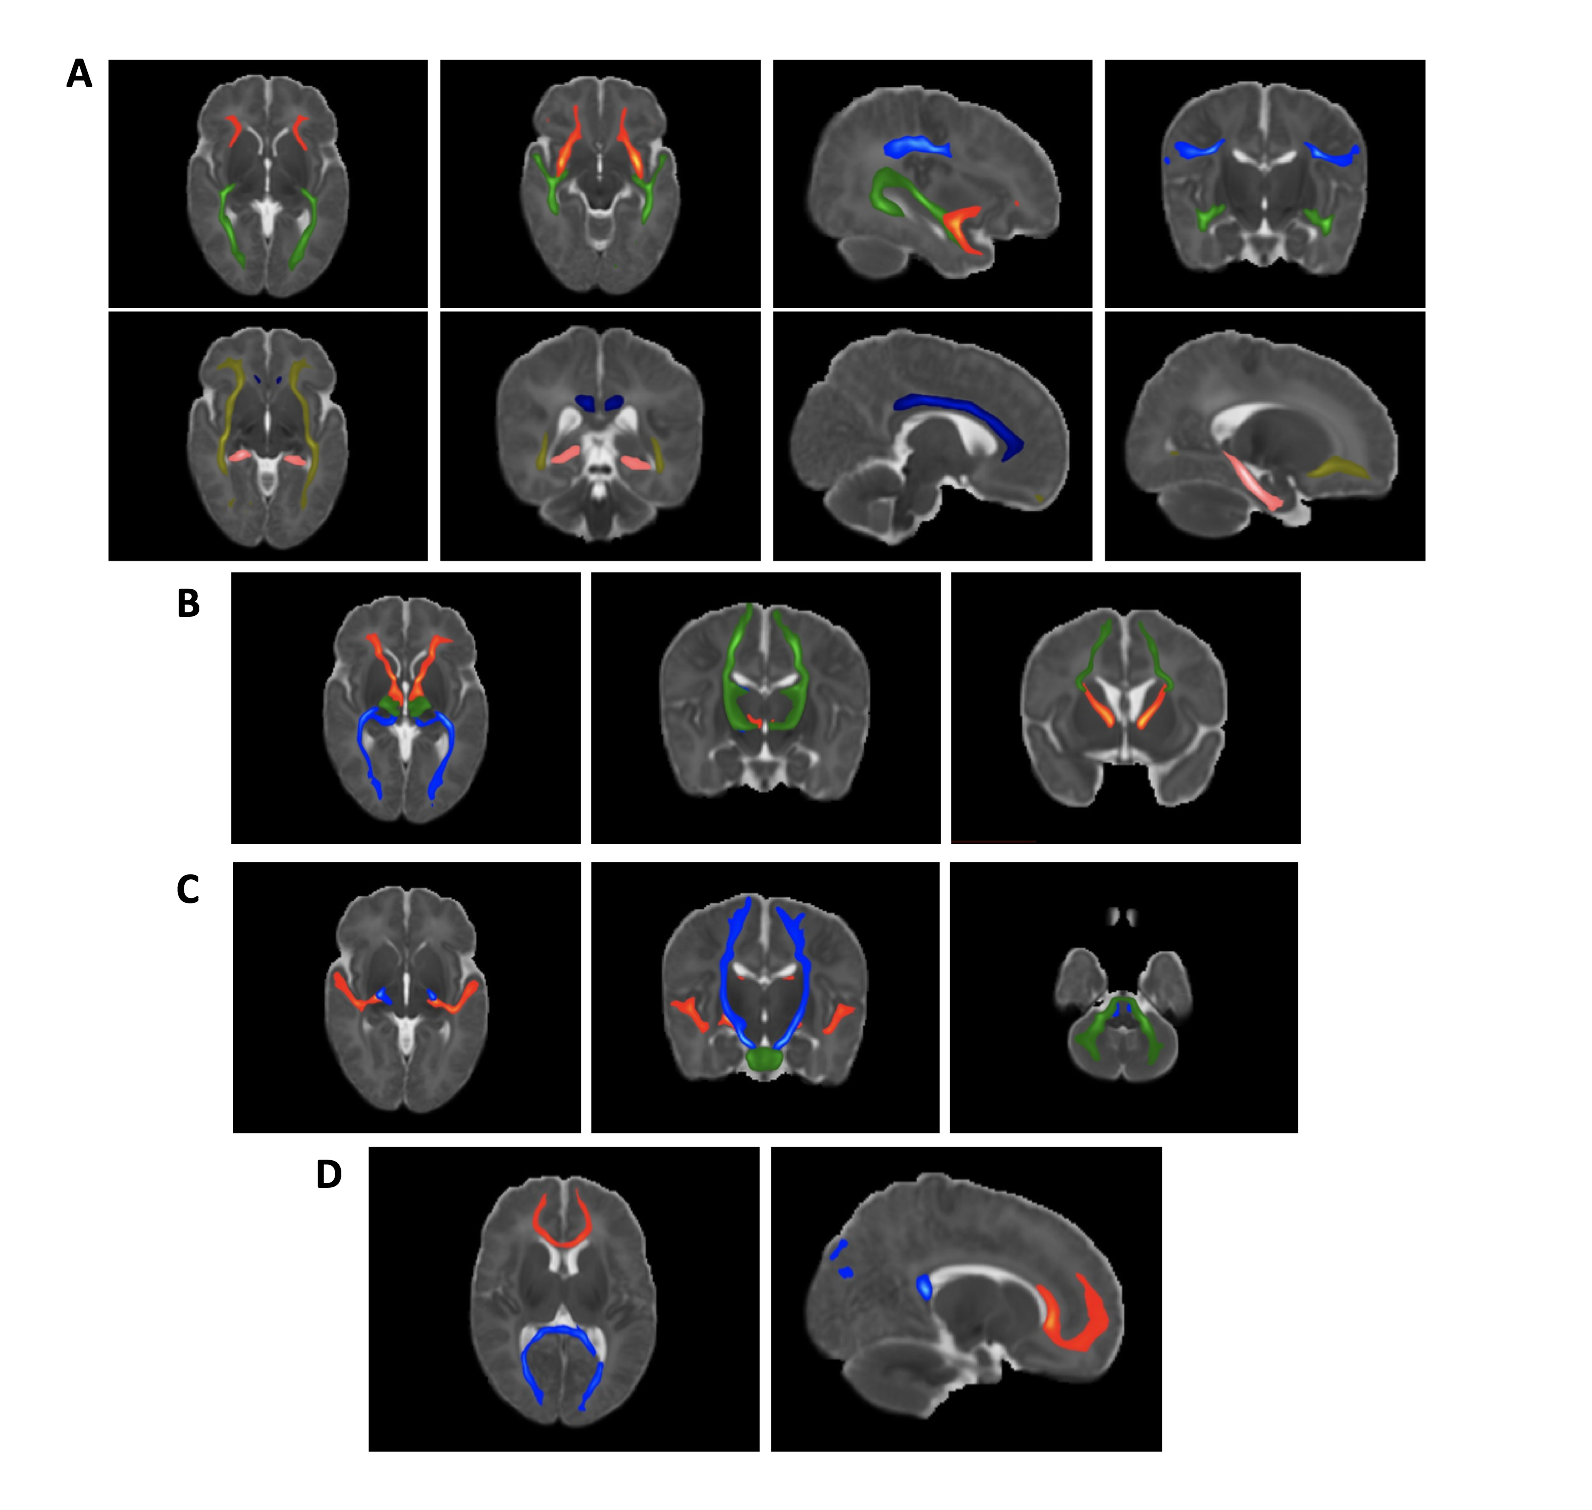
Average tracts, as identified with probabilistic tractography, registered to a standard template.
A: Association fibres. Top row: inferior longitudinal fasciculus - green; superior longitudinal fasciculus - blue; uncinate fasiculus - red. Bottom row: Cingulum (cingulate gyrus) – dark blue, parahippocampal part of the cingulum – pink, inferior fronto-occipital fasciculus – yellow.
B: Thalamic radiations. Anterior thalamic radiation - red; posterior thalamic radiation - blue; superior thalamic radiation - green.
C: Sensory Projections. Acoustic radiation - red; cortico-spinal tract - blue; middle cerebellar peduncle - green.
D: Callosal Fibres. Forceps major - blue; forceps minor - red.