0743
Building a probabilistic atlas of the human corticospinal tract from 410 healthy participants by using enhanced bundle-specific tractography.1Groupe d’Imagerie Neurofonctionnelle, Institut des Maladies Neurodégénératives (GIN-IMN) - UMR 5293, CNRS, CEA Université de Bordeaux, Bordeaux, France, 2Sherbrooke Connectivity Imaging Lab (SCIL), Université de Sherbrooke, Sherbrooke, QC, Canada
Synopsis
Current limitations of diffusion-weighted tractography algorithms face the complexity of white matter fiber crossings, especially for the cortico-lateral projections of the cortico-spinal tract (CST) in the human brain. In this work, to improve cortico-spinal tracking in crossing areas we combined accurate anatomical region positioning along the CST in each individual with a new bundle-specific tractography algorithm. We thus built a probabilistic atlas of the whole-fanning CST in 410 healthy participants.
Purpose
With the advances in diffusion MRI and tractography, numerous atlases of the major white matter pathways including the cortico-spinal tract (CST) have been proposed1-6. But the inherent limitation of current diffusion-weighted tractography to resolve crisscrossed bundles within the centrum semiovale7 have so far prevented the complete description of the most lateral CST projections1-6. We applied a new bundle-specific tractography algorithm based on constrained spherical deconvolution particle-filter tracking (CSD-PFT) with anatomical priors in order to improve streamlines tracking in crossing areas. We therefore established a probabilistic atlas of the whole-fanning CST.Methods
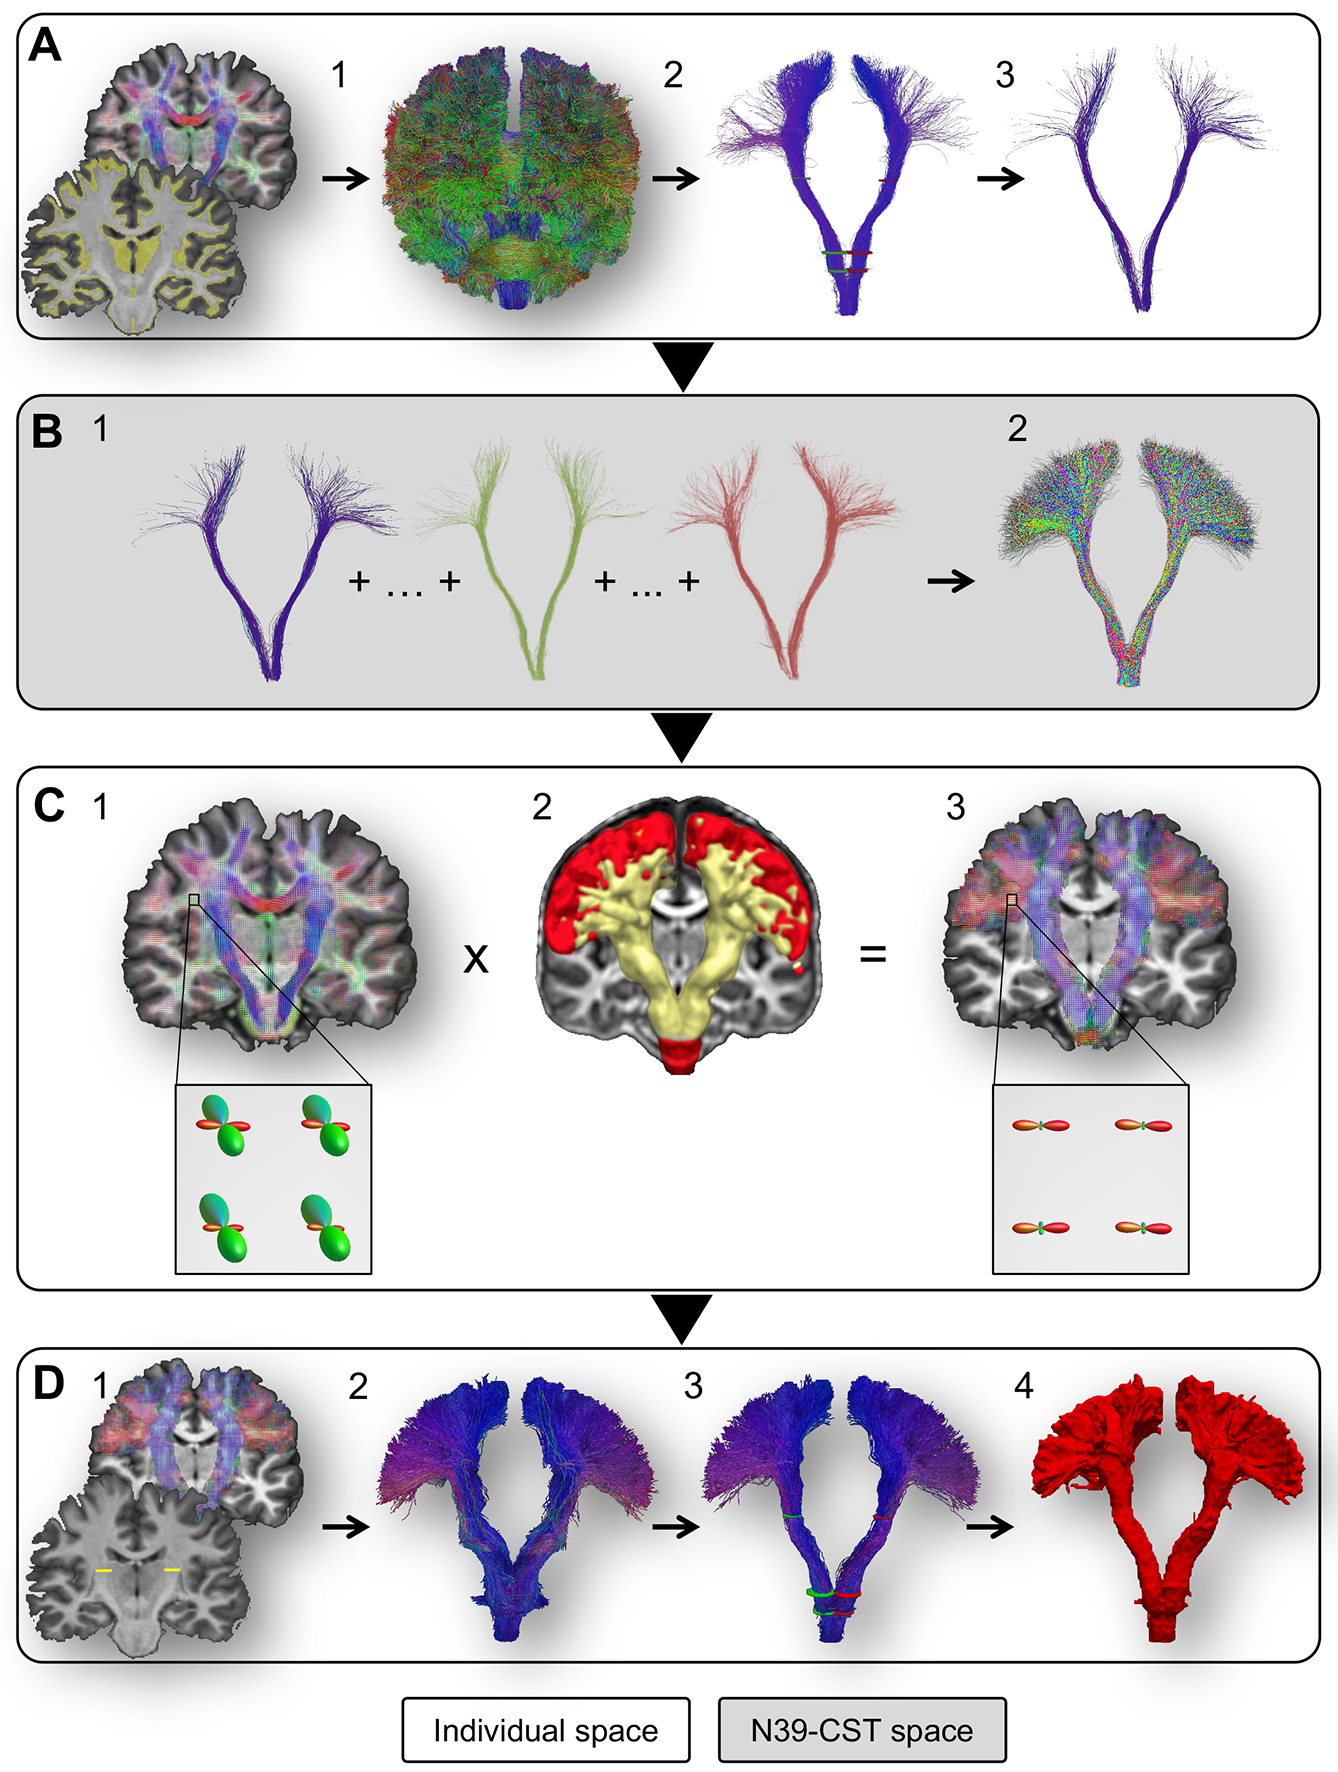
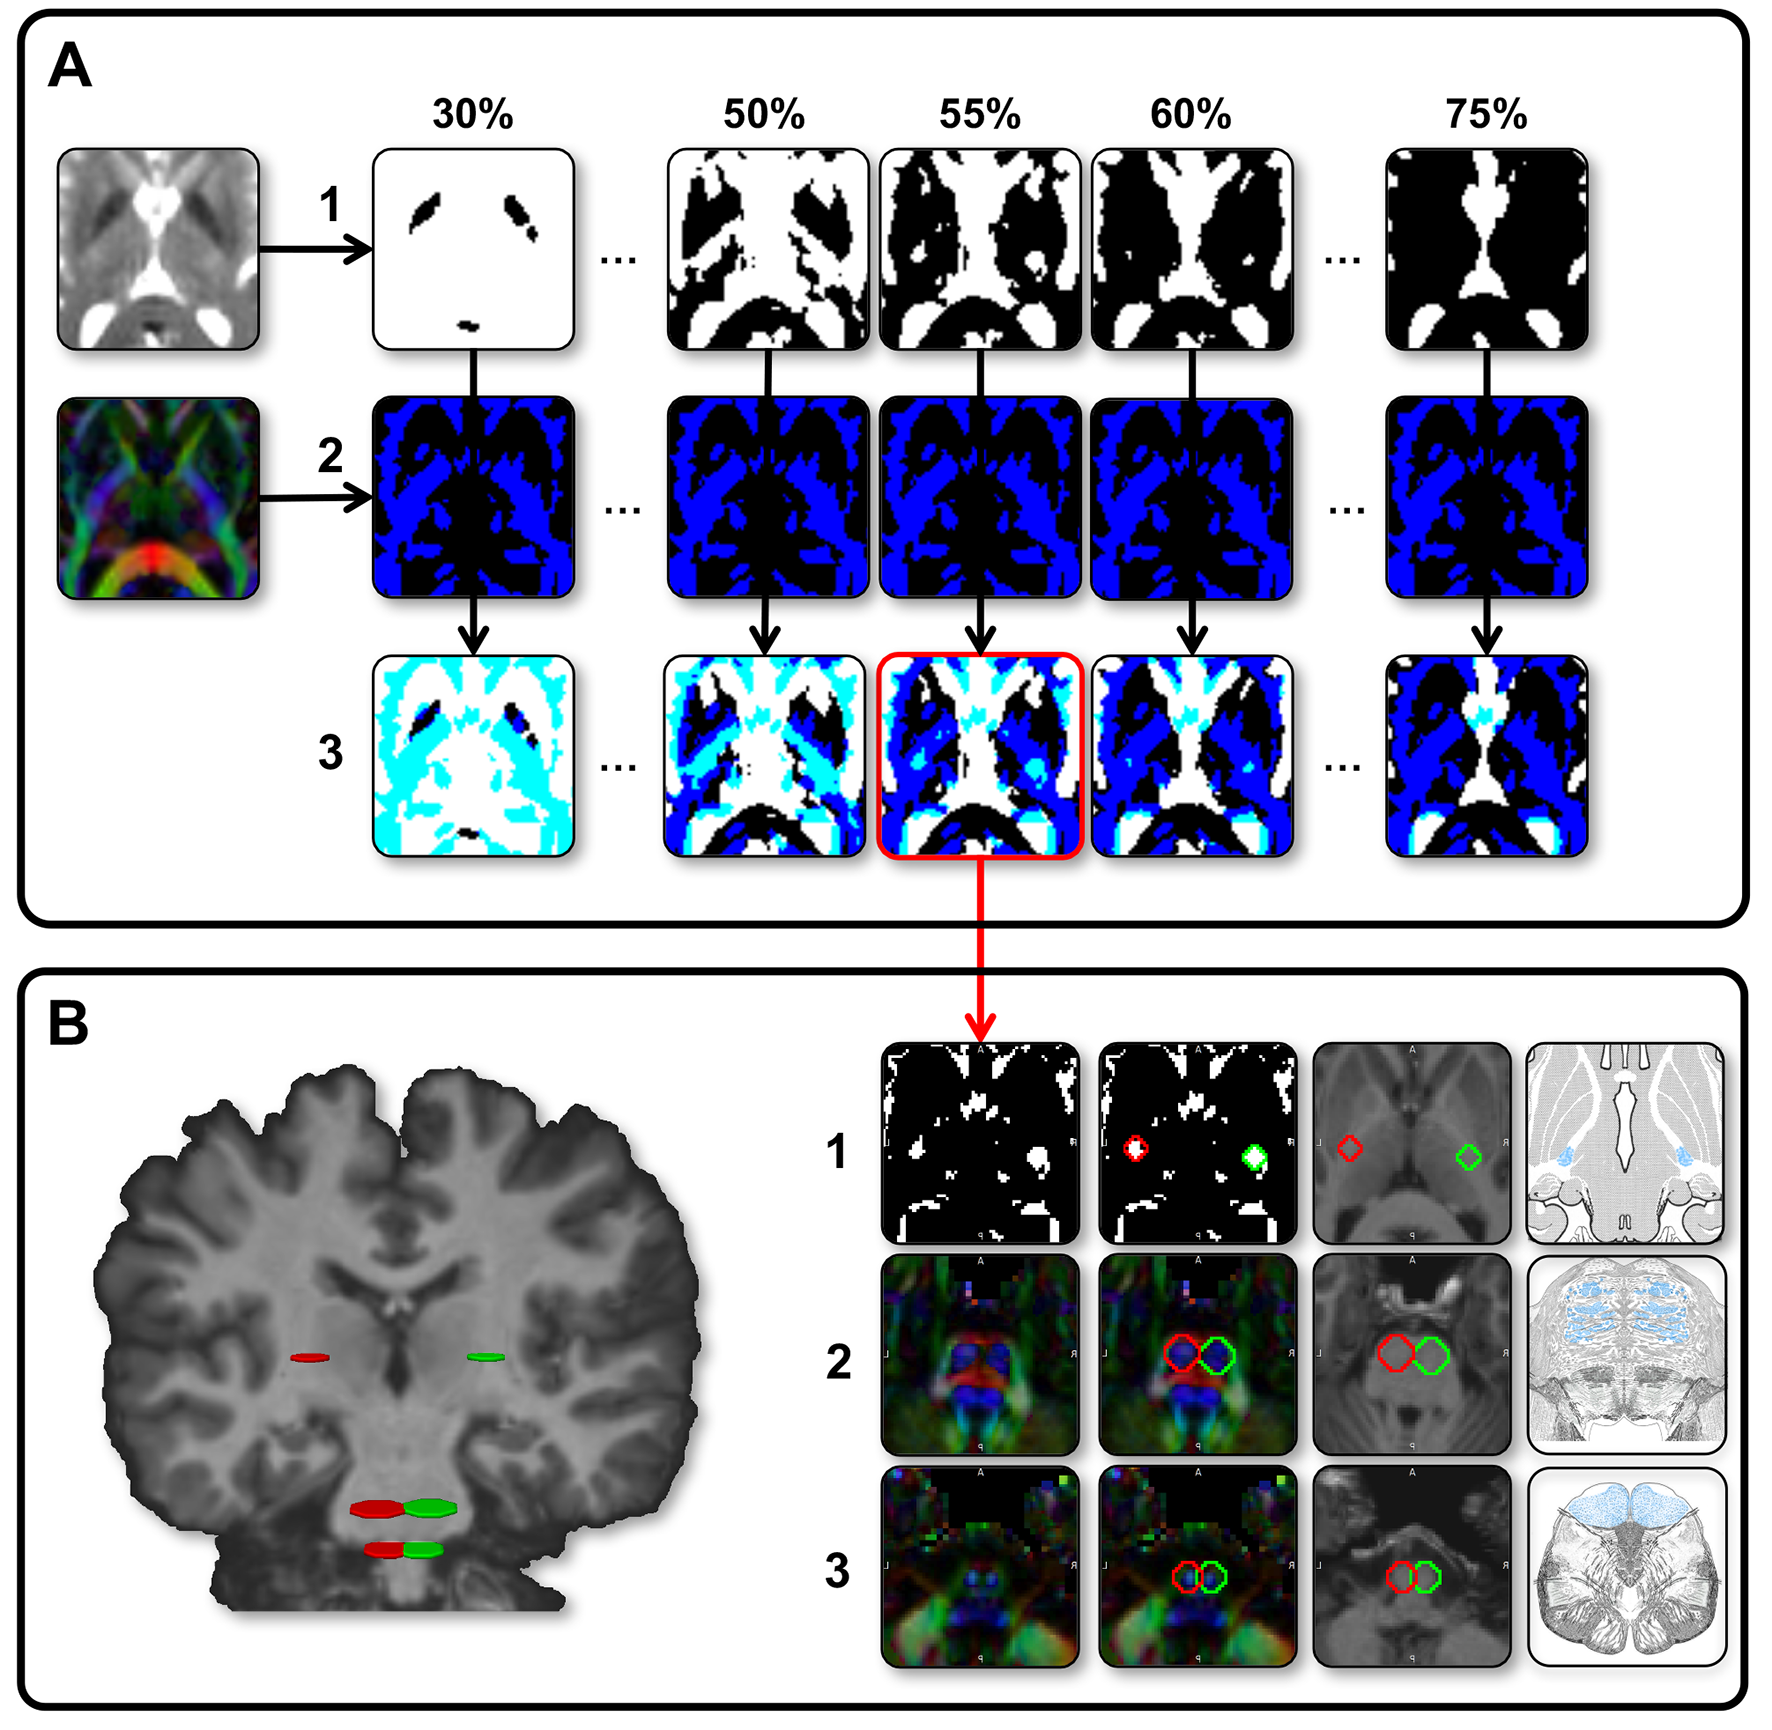
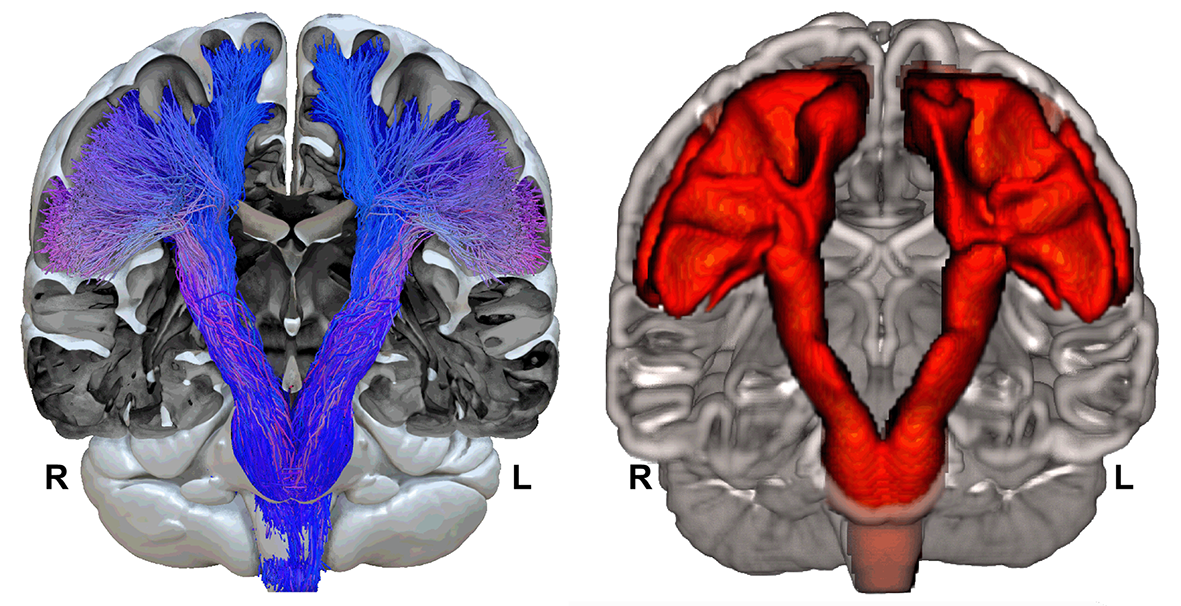
Diffusion-weighted images (2 acquisitions of 2x21 directions, b = 1000 s/mm2) of 410 participants from the BIL&GIN database8 (53% female, 49% left-handers, aged 18-55) were processed to compute in fine b0, FA, RGB maps and fibers orientation distribution (FOD). Thirty-nine whole-brain tractograms were first computed on FOD using an advanced streamline probabilistic T1-weighted anatomically CSD-PFT (10 seeds/voxel and default parameters, Fig-1A)9. Both CST were extracted by 3 manually defined regions of interests in each hemisphere at the level of the internal capsule (IC), the midbrain (MB) and the medulla oblongata (MO, Fig-2) in each participant. A N39-CST template was built by nonlinearly registering the 39 CST in each hemisphere and was considered as a bundle of interest (BOI, Fig-1B). This BOI was used as a new tracking mask in which a voxel-wise ponderation of FOD lobes was computed according to the direction of the streamlines from BOI (Fig-1C). This optimization, inspired by TOD10, produced a new set of FOD where the influence of lobes with the same general direction as the CST is slightly increased, while the influence of lobes with a distinct direction is slightly decreased. A bundle-specific tractography was then performed in each of the 410 participants by tracking the new weighted-FOD within the N39-CST template warped in the individual space (Fig-1D) and by initiating streamlines in the IC (1000 seeds/voxel). Lastly, MB and MO were also used to extract 410 CST in each hemisphere (Fig-1D.3). Each individual CST was binarized (Fig-1D.4), normalized to the MNI-space, then summed and set to a probabilistic map between 0 and 100% overlap (Fig-3). To test the CST anatomical asymmetry, a repeated MANOVA was computed on 405 participants (5 inverted left-handers excluded) with the Manual Preference, Gender, Age and the Cerebral Volume as covariates of interest.Results and Discussion
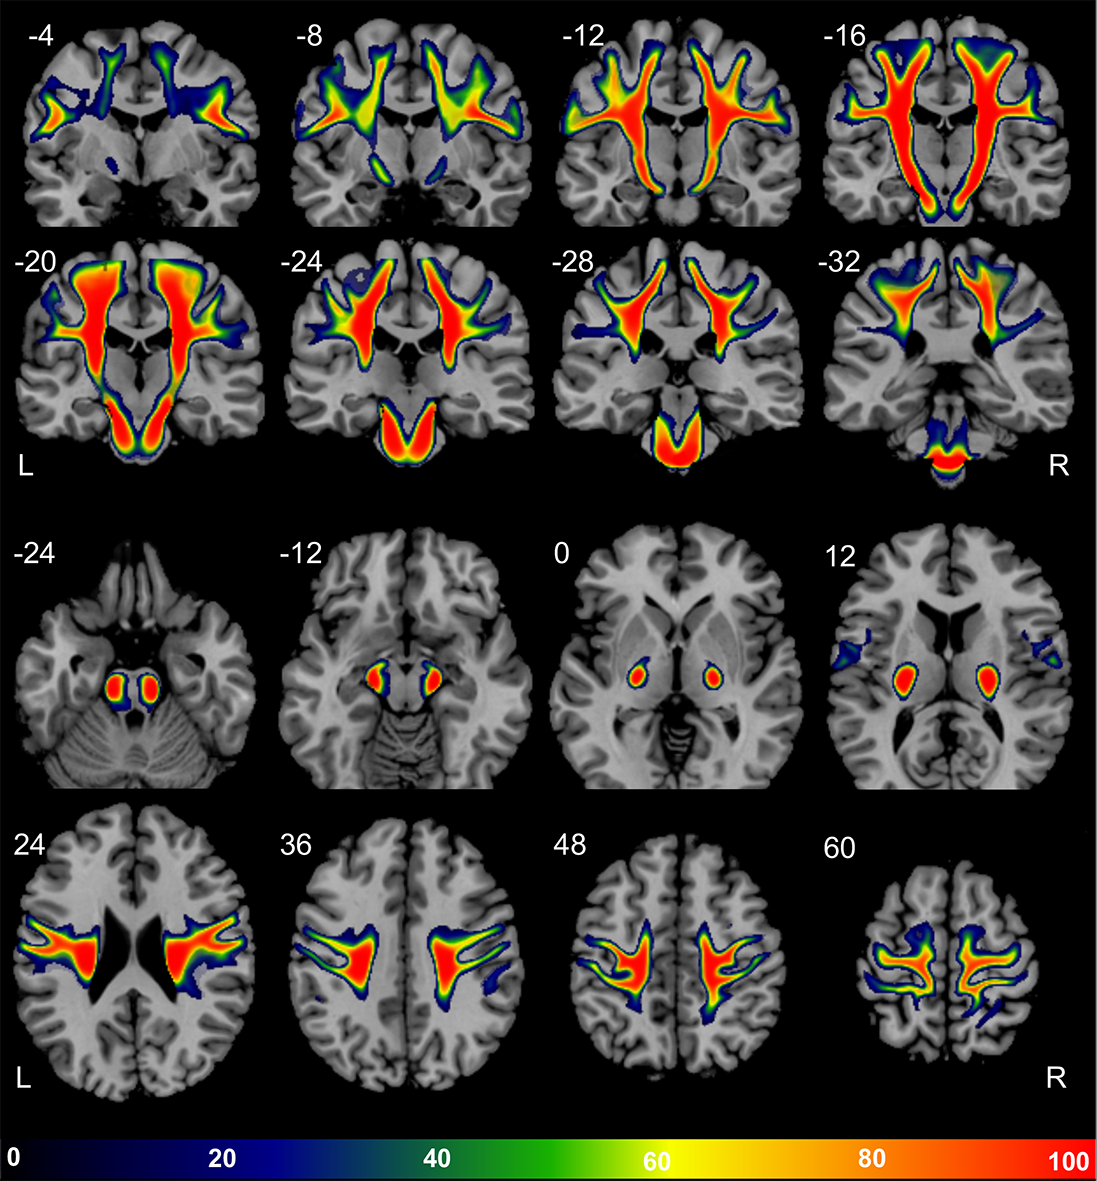
Both left and right CSTs were obtained in the 410 participants (concatenated in Fig-3). Thanks to the manual positioning of the different ROIs along the CST pathways in each participant, each of the left and right 410 whole-fanning CST descends through the centrum semiovale, passes through the posterior part of IC, crosses the anterior part of the cerebral peduncle and reaches the MO through the anterior part of MB. We observed a significant asymmetry of the mean CST volume (Left=35.8±4.0 cm3, Right=38.0±4.4 cm3, F=181.0, p<10-4) with no interaction with Manual Preference, Gender nor Age. Note that men showed a slight larger left and right CST than women (F=4.6, p=0.03) with no interaction with Cerebral Volume. Fig-4 presents the probabilistic atlas of the CST with cortical projections in the superior, middle and inferior parts of the pre- and post-central gyri. The CST fanning was comparable to previous descriptions of CST cortical projections by dissection and histology11,12: a complete fanning following the central sulcus from its medio-dorsal to ventro-lateral part, and covering the entire sensory-motor homunculus13 was present (Fig-3). Such an accurate anatomical result was due to the combination of: 1-the careful and accurate anatomical positioning of ROI in each individual; 2- the more efficient tracking thanks to the template-based optimization of the weighted-FOD. In particular, optimization of the FOD allowed an enhanced CST tractography in the centrum semiovale within the crisscross with commissural and association bundles.Conclusion
We built a probabilistic atlas of the CST in a large cohort of healthy participants with a complete description of its most cortico-lateral projections while previous comparable atlases were restricted to its most medio-dorsal part2,3,5,6,14. Clinical applications are already envisaged, the whole-fanning CST atlas being likely a better marker of corticospinal integrity metrics than those currently used15,16 within the frame of prediction of poststroke motor recovery.Acknowledgements
No acknowledgement found.References
1. S. Wakana, H. Jiang, L. M. Nagae-Poetscher et al., Fiber Tract-based Atlas of Human White Matter Anatomy. Radiology 230, 77-87 2004.
2. M. Catani, M. Thiebaut de Schotten, A diffusion tensor imaging tractography atlas for virtual in vivo dissections. Cortex 44, 1105-1132 2008.
3. M. Thiebaut de Schotten, D. Ffytche, A. Bizzi et al., Atlasing location, asymmetry and inter-subject variability of white matter tracts in the human brain with MR diffusion tractography. NeuroImage 54, 49-59 2011.
4. A. Yendiki, P. Panneck, P. Srinivasan et al., Automated probabilistic reconstruction of white-matter pathways in health and disease using an atlas of the underlying anatomy. Front Neuroinform 5, 23 2011.
5. K. Rojkova, E. Volle, M. Urbanski et al., Atlasing the frontal lobe connections and their variability due to age and education: a spherical deconvolution tractography study. Brain Struct Funct 221, 1751-1766 2016.
6. D. B. Archer, D. E. Vaillancourt, S. A. Coombes, A Template and Probabilistic Atlas of the Human Sensorimotor Tracts using Diffusion MRI. Cereb Cortex, 1-15 2017.
7. K. H. Maier-Hein, P. Neher, J. C. Houde et al., The challenge of mapping the human connectome based on diffusion tractography. Nature Communications 8, 1349 2017.
8. B. Mazoyer, E. Mellet, G. Perchey et al., BIL&GIN: A neuroimaging, cognitive, behavioral, and genetic database for the study of human brain lateralization. Neuroimage 124 Part B, 1225-1231 2016.
9. G. Girard, K. Whittingstall, R. Deriche et al., Towars quantitative connectivity analysis: Reducing tractography biaises. NeuroImage 98, 266-278 2014.
10. T. Dhollander, L. Emsell, W. Van Hecke et al., Track Orientation Density Imaging (TODI) and Track Orientation Distribution (TOD) based tractography. NeuroImage 94, 312-336 2014.
11. J. Déjerine, A. Déjerine-Klumpke, Anatomie des centres nerveux. Tome 2., (Rueff et Cie, Paris, 1901), pp. 720.
12. U. Bürgel, K. Amunts, L. Hoemke et al., White matter fiber tracts of the human brain: Three-dimensional mapping at microscopic resolution, topography and intersubject variability. NeuroImage 29, 1092-1105 2006.
13. W. Penfield, T. Rasmussen, The cerebral cortex of man. A clinical study of localization of function. (The Macmillan Company, New York, 1950).
14. Y. Zhang, J. Zhang, K. Oishi et al., Atlas-guided tract reconstruction for automated and comprehensive examination of the white matter anatomy. NeuroImage 52, 1289-1301 2010.
15. A. Bigourdan, F. Munsch, P. Coupe et al., Early Fiber Number Ratio Is a Surrogate of Corticospinal Tract Integrity and Predicts Motor Recovery After Stroke. Stroke 47, 1053-1059 2016.
16. B. N. Groisser, W. A. Copen, A. B. Singhal et al., Corticospinal Tract Diffusion Abnormalities Early After Stroke Predict Motor Outcome. Neurorehabilitation and Neural Repair 28, 751-760 2014.
Figures