0742
Histologically-derived fiber response functions for diffusion MRI data reveal systematic differences from model-based deconvolution kernels1Biomedical Engineering, Vanderbilt University, Nashville, TN, United States, 2Vanderbilt University, Nashville, TN, United States, 3Electrical Engineering and Computer Science, Vanderbilt University, Nashville, TN, United States
Synopsis
Spherical deconvolution for diffusion MRI requires a response function in order to accurately reconstruct the underlying voxel-wise fiber orientation distribution (FOD). Here, using 3D histologically-defined fiber orientation distributions and the corresponding diffusion signal, we derive the ground-truth fiber response functions. We show that there is significant variation in these response functions across the brain. We find that the current methods to estimate this function do not match the histological results, which leads to differences in fiber volume fractions. This is important because the wrong response function can amplify spurious peaks in the FOD and lead to inaccurate tractography.
Introduction
Spherical deconvolution for diffusion MRI models the diffusion signal as the convolution of the fiber orientation distribution (FOD) with a kernel (the response function) that represents the signal corresponding to a single fiber population. There are several ways to estimate the response function - for example modeling it as an axially symmetric tensor1, using the diffusion signal in the voxels with the highest FA2, or iterative estimation using only single fiber voxels3 – all of which can result in different responses, different estimates of the FOD after deconvolution, and different tractography results. Here, we utilize the ground truth histologically-defined FOD, and the corresponding diffusion MRI signal, to determine the linear relationship (i.e., the response function) between the signal and the FOD. We derive the average histologically-defined response function, as well as the variation in response functions across the brain, and find that a single response function is not adequate throughout the entire brain. We then compare our histological response functions, and reconstruction results, to two common approaches to kernel estimation.Methods
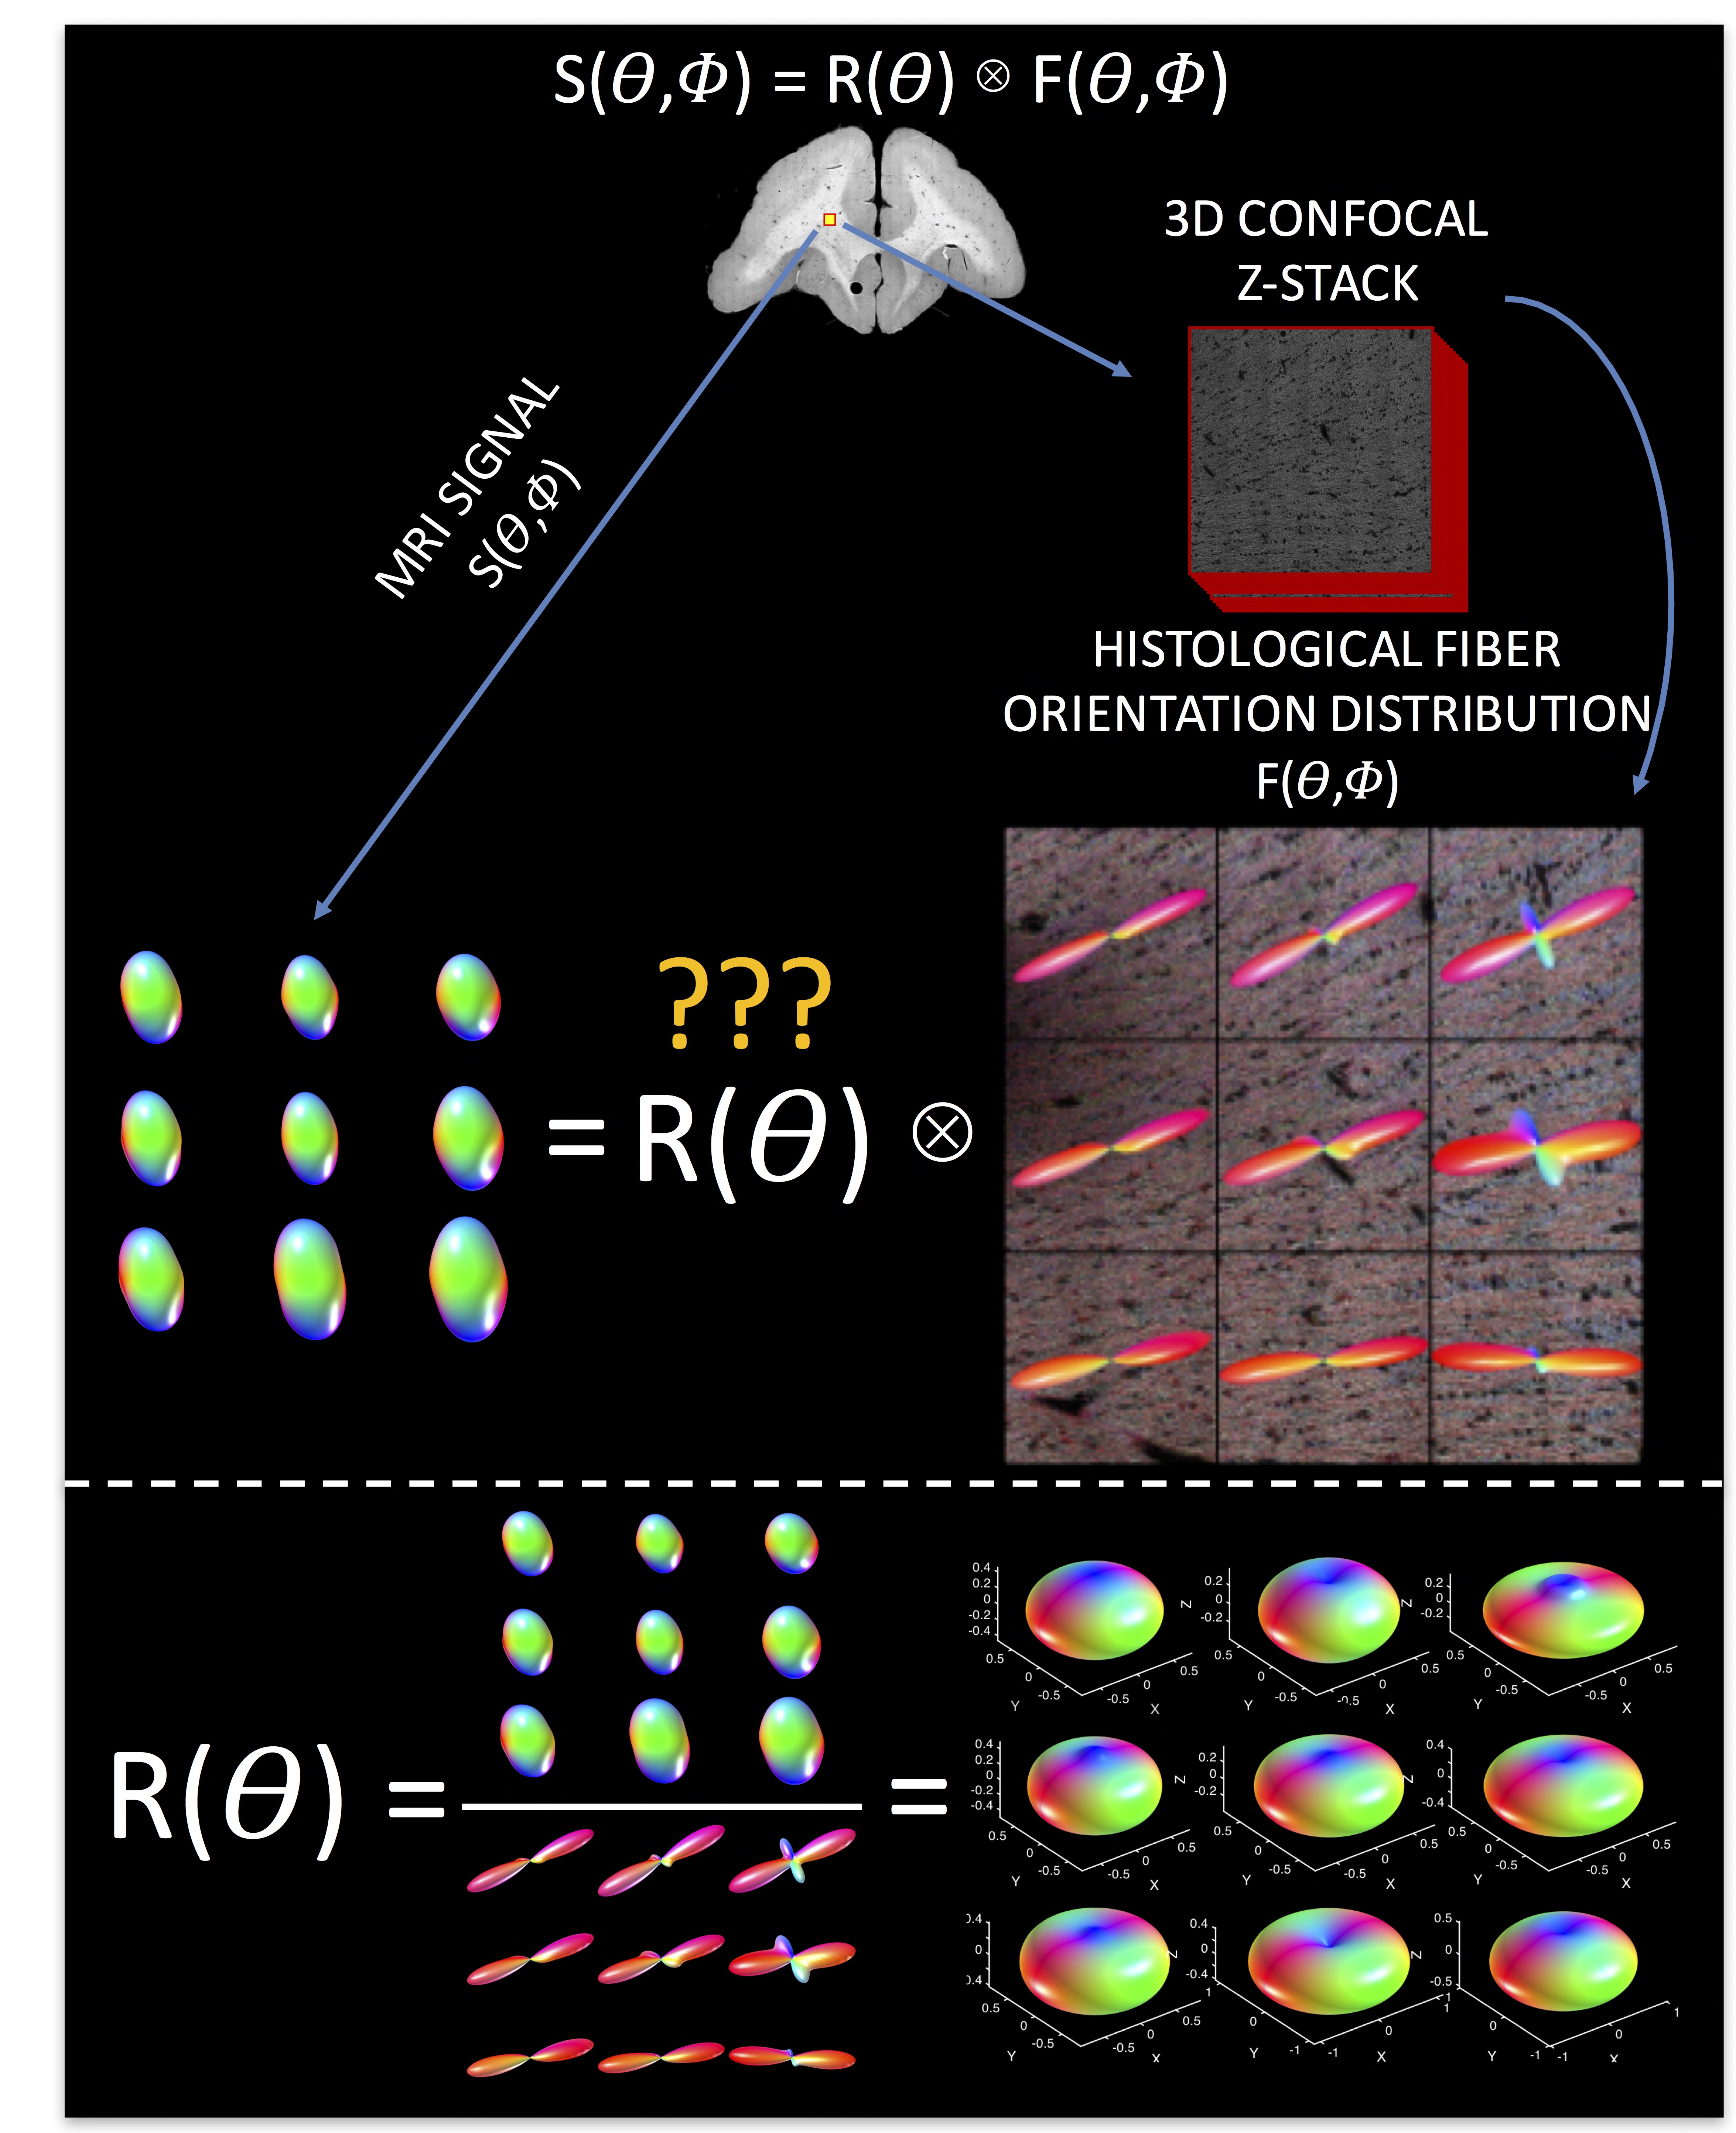
Briefly, three ex vivo squirrel monkey brains were scanned on a Varian 9.4T scanner at 300um isotropic resolution. 100 diffusion directions were acquired at a b-value of 6,000 s/mm2. The brain was then sectioned, stained with a fluorescent dye, and imaged on an LSM710 Confocal microscope followed the procedures described in [4]. From the 3D confocal z-stack, the ground truth histological FOD was determined using 3D structure tensor analysis. Finally, using a multi-step registration method4, the diffusion MRI signal corresponding to these z-stacks can be obtained (Figure 1, top).
Normally, one estimates the FOD by deconvolving the signal with the response function:
$$S(\theta,\phi) = R(\theta) \otimes F(\theta,\phi)$$
however, here we ask “what is the true response function, given the signal and the FOD?” (Figure 1, bottom). This is done for 10 mosaic z-stacks (90 voxels), yielding 90 total response functions. We assess the variability in this function across the brain, and using MRTRix3 software, perform spherical deconvolution using our histological kernels, as well as two commonly implemented response function estimation procedures2,3.
however, here we ask “what is the true response function, given the signal and the FOD?” (Figure 1, bottom). This is done for 10 mosaic z-stacks (90 voxels), yielding 90 total response functions. We assess the variability in this function across the brain, and using MRTRix3 software, perform spherical deconvolution using our histological kernels, as well as two commonly implemented response function estimation procedures2,3.
Results
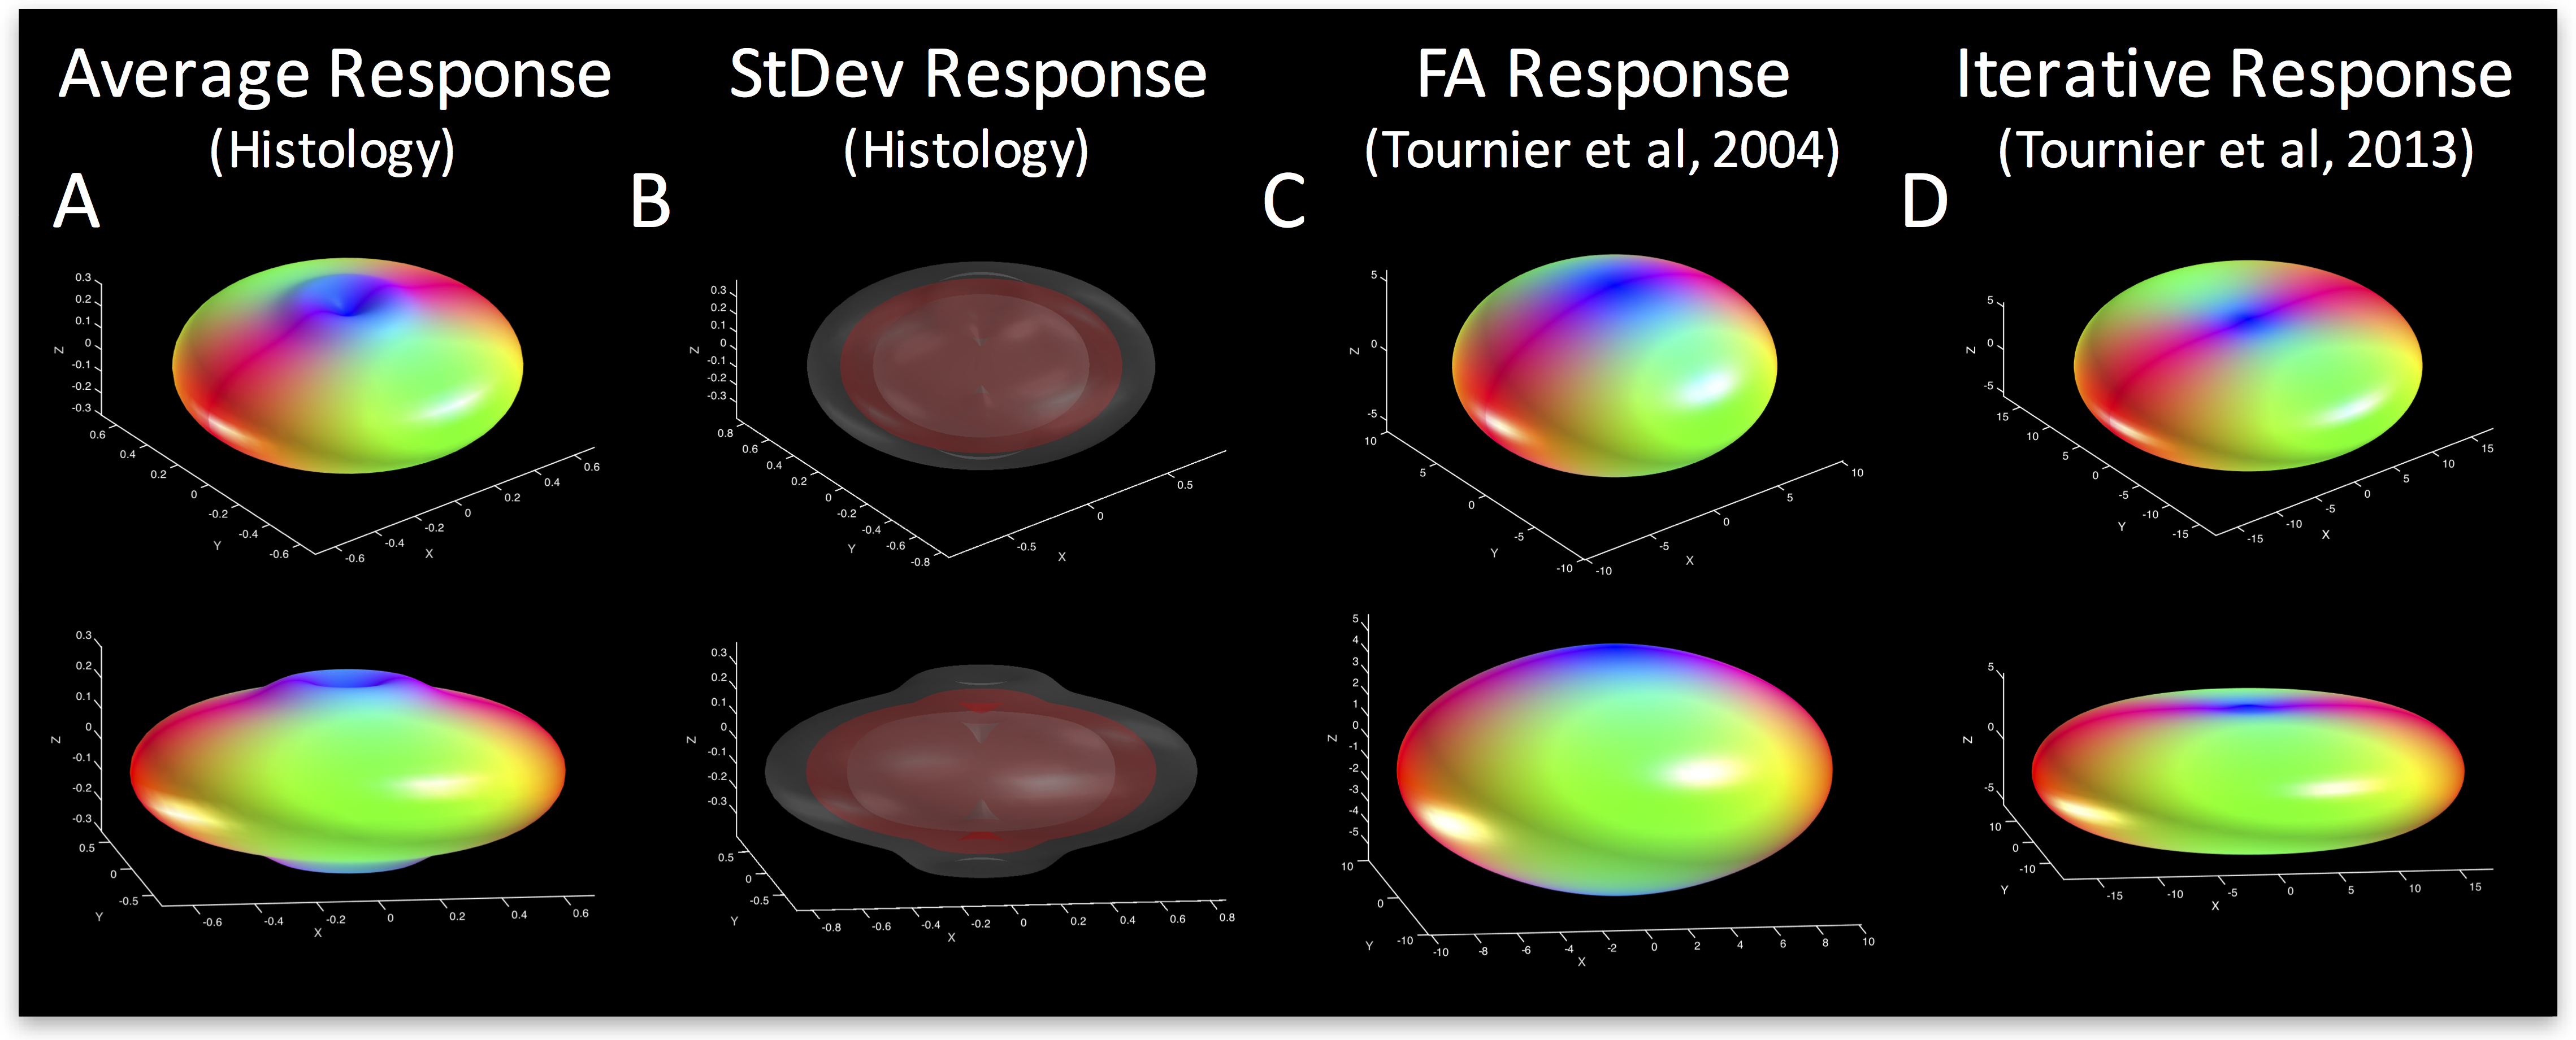
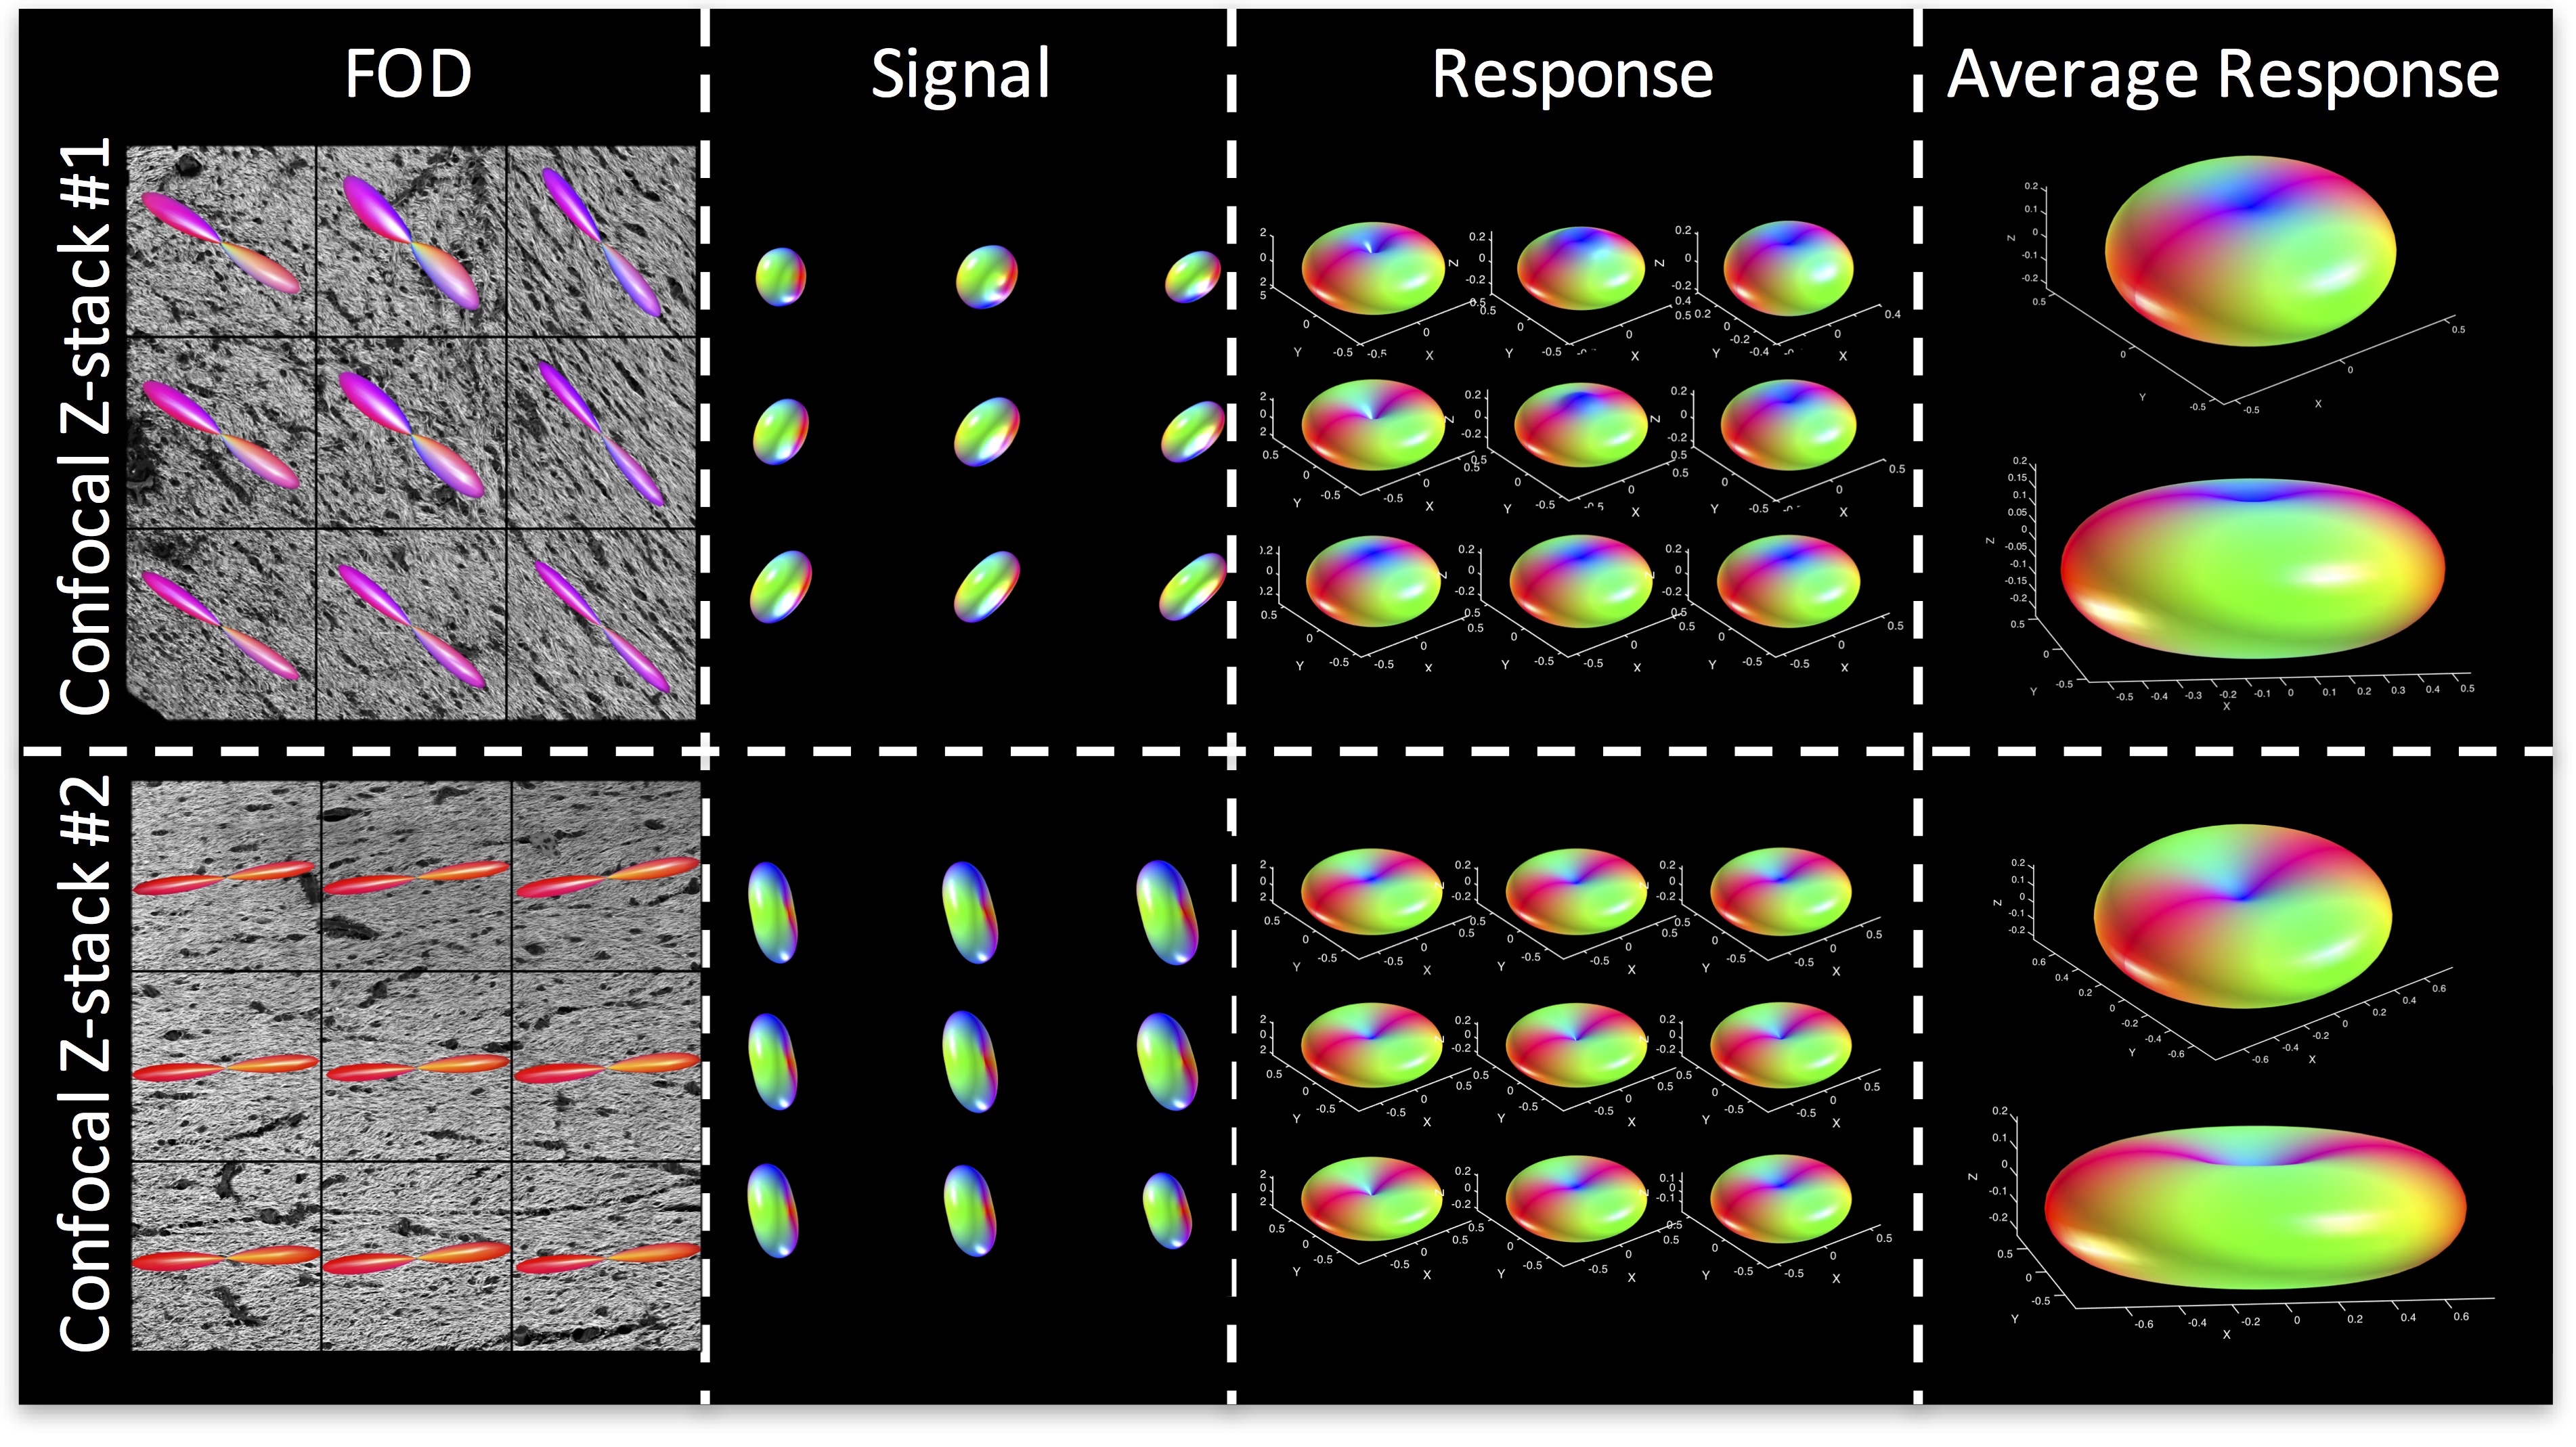
Exemplar FODs, diffusion signals, and response functions are shown in Figure 1 (bottom). Performing similar procedures for all z-stacks yields individual kernels for all voxels. The average histological response function is shown in Figure 2 (A), along with the standard deviation (B) across all histological voxels. The kernels estimated using the 100 highest FA voxels2 (C) as well as an iterative estimation method3 (D) are also shown. The histologically-defined kernel lies somewhere between these two methods.
To highlight the variability in response functions across the brain, we show the average kernel from two different regions with single fiber populations. The average kernel estimated from Region #1 (fornix) kernel indicates more radial signal attenuation, and less axial attenuation, than the “flatter” kernel from Region #2 (corpus callosum). A multivariate analysis of variance indicates that the response functions from these two brain regions differs significantly between the groups (p=1.8E-4), and a two sample Komogorov-Smirnov test of distributions indicates that the average response function from Stack #1 is significantly different than that from Stack #2 (p=3.9E-9). Thus, the optimal kernel varies considerably across brain regions.
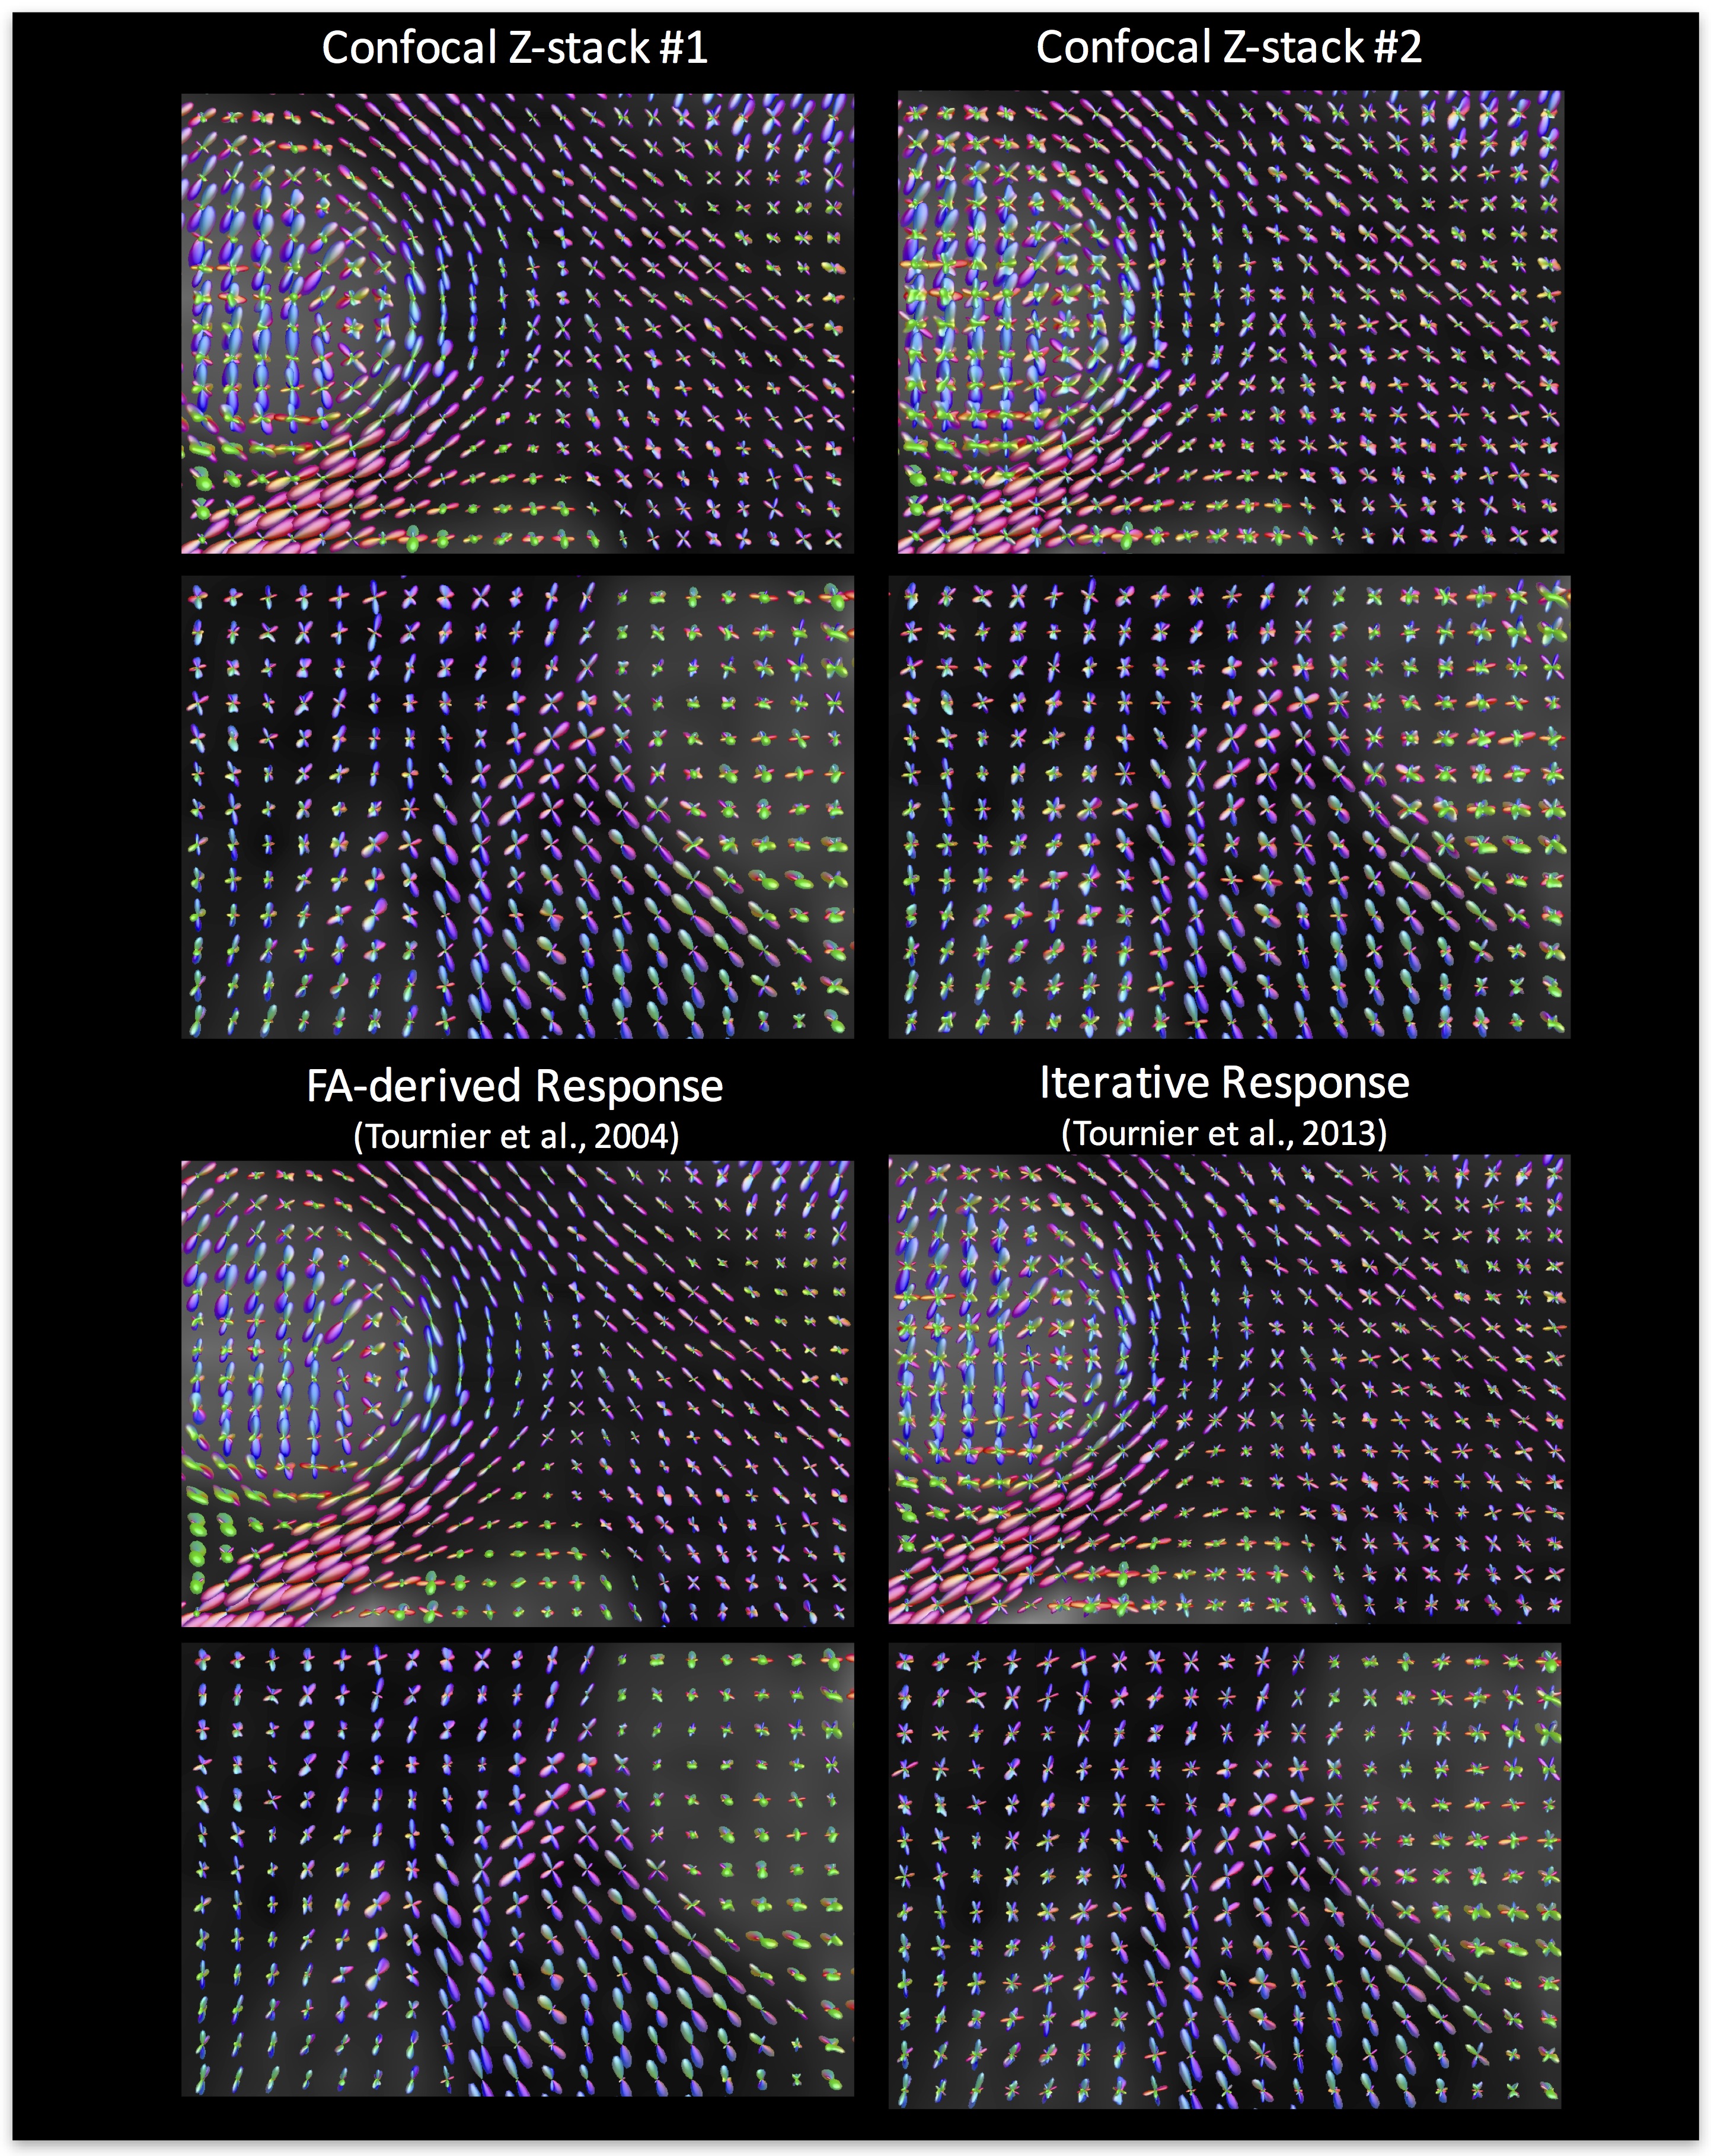
To show the differences in reconstruction when using these kernels (and the two commonly implemented methods), we display the estimated FODs for all four methods in Figure 4. The most obvious differences are the amplification of spurious peaks in those methods with “flat” kernels (Confocal stack #2 and Iterative Kernel), and the reduced prevalence of crossing fibers in the less “flat” kernels.
Discussion and Conclusion
Here, for the first time, we have empirically estimated the linear relationship (i.e., the fiber response function) between the diffusion signal and underlying FOD using 3D histological analysis. We show the average response function over all histological voxels, which differs slightly in shape from those estimated using current best-practices. In addition, we find statistically significant differences in response functions between brain regions, which suggests that a single response function may not be appropriate for use throughout the entire brain, and instead a region-wise, or voxel-wise, response may be more appropriate. Differences in response functions, however, tend to result in similar FODs, with differences being mostly in fiber volume fractions, and particularly the amplification of spurious peaks in the FOD.Acknowledgements
This work was supported by the National Institute of Neurological Disorders and Stroke of the National Institutes of Health under award number RO1 NS058639 and National Institutes of Health grant 1S10 RR 17789. Whole slide imaging was performed in the Digital Histology Shared Resource at Vanderbilt University Medical Center (www.mc.vanderbilt.edu/dhsr).References
1. Anderson, AW. Measurement of fiber orientation distributions using high angular resolution diffusion imaging. Magn. Reson. Med., 54 (2005), pp. 1194-1206
2. Tournier, J.-D.; Calamante, F.; Gadian, D. G. & Connelly, A. Direct estimation of the fiber orientation density function from diffusion-weighted MRI data using spherical deconvolution. NeuroImage, 2004, 23, 1176-1185
3. Tournier, J.-D.; Calamante, F. & Connelly, A. Determination of the appropriate b-value and number of gradient directions for high-angular-resolution diffusion-weighted imaging. NMR Biomedicine, 2013, 26, 1775-1786
4. Schilling, K., Janve, V., Gao, Y., Stepniewska, I., Landman, B.A., Anderson, A.W., 2016. Comparison of 3D orientation distribution functions measured with confocal microscopy and diffusion MRI. Neuroimage 129, 185-197.
Figures