0741
Validation of Diffusion Spectrum Imaging of the Human Tongue with Histology1Diagnostic Radiology, University of Maryland School of Medicine, Baltimore, MD, United States, 2Anatomy and Neurobiology, University of Maryland School of Medicine, Baltimore, MD, United States, 3Neural and Pain Sciences and Orthodontics, University of Maryland School of Dentistry, Baltimore, MD, United States, 4Electrical and Computer Engineering, Johns Hopkins University, Baltimore, MD, United States
Synopsis
In this study provides validation procedure for DSI anisotropy measures versus the histological analysis of the aligned tongue muscles. A fresh ex-vivo sample of the tongue is scanned using DSI multi-shell acquisition then the sample is fixed for further histological analysis and comparison with the fiber tracts using DSI reconstruction. The DSI delineation of muscle fibers is matching the histology images of the same region.
Purpose
The human tongue is known to have a complex architecture of muscles [1]. To fully understand how the organization of the tongue muscle fibers could affect the tongue functionality, diffusion weighted imaging can be used. Studies have shown that Diffusion tensor imaging (DTI) can reconstruct some of the fiber tracts of the human tongue noninvasively [2]. However, DTI assumes single fiber orientation within an imaging voxel, therefore does not resolve for fiber crossing which commonly happens within the tongue muscle. We previously showed diffusion spectrum imaging (DSI) was able to resolve those complex fiber crossings [3]. It is unknown though how well DSI reconstructed crossing fibers represent the underlying tongue muscle fiber structure. In this study for the first time, we validate DSI of the tongue muscle in ex-vivo human tongue muscle against classical H&E staining. This could guide the fine-tuning of the DSI parameters for the reconstruction of the tongue muscle fibers as well as confirming the ability of DSI to correctly delineate the interdigitating tongue muscle fibers.Methods
MR acquisition and reconstruction
Diffusion imaging was performed on a post-mortem tongue of a 68-year-old female, around 48 hours after death. The diffusion images were acquired on a Siemens Prismafit scanner using a Readout-Segmented Echo-Planar diffusion sequence (RESOLVE). TE=79 ms, and TR=6250 ms. A diffusion spectrum imaging scheme was used, and a total of 218 diffusion sampling were acquired. The maximum b-value was 4000 s/mm2. The in-plane resolution was 2.5 mm. The slice thickness was 2.5 mm. The diffusion data were reconstructed using diffusion spectrum imaging [4] with a Hanning filter of 16. Diffusion ODF decomposition [5] was conducted using a decomposition fraction of 0.05.
Preprocessing, histology and ST analysis
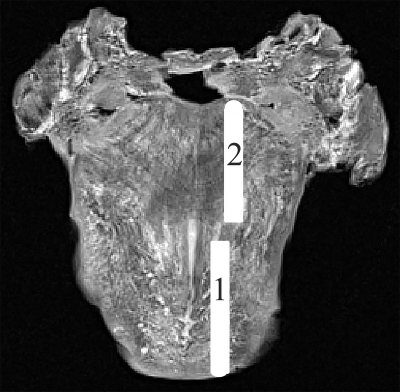
The whole head was first perfused through carotid aorta then immersed in a fixative solution with 3.7%-4.0% formaldehyde in phosphate-buffered saline for three weeks before excision of the tongue. The tongue was then excised using the “mandibular swing” surgical approach for further histological analysis. T2W images were acquired of the excised tongue placed in a container filled with Flourinert (3 M, St. Paul, MN), which is a proton-free solution, for enhanced contrast. Two sagittal sections of the tongue (aligned with the imaging plane) were carefully dissected out from the tongue specimen (as illustrated in Fig. 1), and then subsequently sent for histology processing. Ten full face 5 micron slices were cut every 500 microns and were stained with H & E stain and then digitized using Aperio slide digitizer at 20x magnification. Structure Tensor (ST) analysis was performed on the 5x H&E digitized images of the two slices, using the freely available Structure Tensor toolbox [6] [7] that works with Matlab. DSI studio [8] was used to process the DSI data.
Results and Discussion
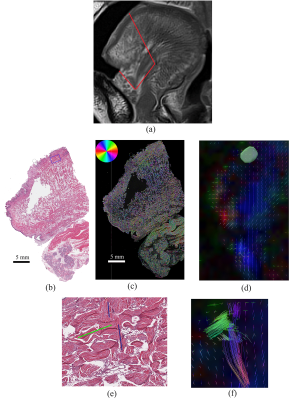
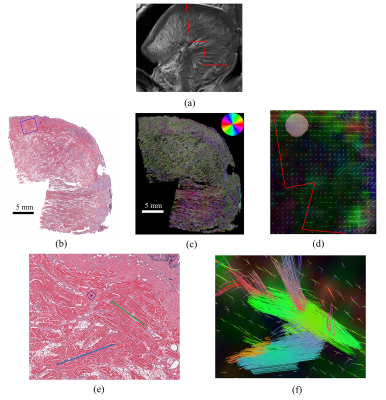
Fig. 1 shows the T2W axial slice of the tongue with the location of the two sagittal sections taken for histology. Fig 2 and 3 each shows an outline (in red) of one of the sagittal section on the post-mortem sagittal T2W image (Fig 2a, Fig 3a), and a comparison between the H&E staining, ST histology analysis and the ODF overlaid on the colored QA of the two slices. A smaller region in the histology image (blue rectangle) is shown in Fig. 2.e and 3.e with the corresponding region chosen as the seed region for fiber tracking in DSI studio to assess the delineation of the muscle fibers using DSI. The interdigitation within the tongue muscle is clearly shown in H&E stained image where multiple muscle directions are visible even in a small region. The interdigitated muscle fibers are well appreciated by DSI as shown in Fig 2f and Fig. 3f.Conclusion
We compared the results between the DSI of a post mortem human tongue with the H&E staining of two slice sections taken from the same tongue after fixation. The fiber tracts delineated by DSI matches the histological structure of the fibers using the H & E stains of the same region. This approach can be repeated for different regions of the tongue to validate the DSI of the whole tongue region. To our knowledge, this is the first study to delineate tongue muscle fiber directions reconstructed using DSI with histology validation. Knowledge gained here will greatly help the understanding of in-vivo tongue muscle fiber structures.Acknowledgements
The work is supported by grant NIH/NIDCD R01 DC014717.
References
[1] M. Stone, J. Woo, J. Lee, T. Poole, A. Seagraves, M. Chung, E. Kim, E. Z. Murano, J. L. Prince and S. S. Blemker, "Structure and variability in human tongue muscle anatomy," Computer Methods in Biomechanics and Biomedical Engineering: Imaging & Visualization, pp. 2168-1171, 2016.
[2] H. Shinagawa, E. Z. Murano, J. Zhuo, B. Landman, R. P. Gullapalli, J. L. Prince and M. Stone, "Tongue muscle fiber tracking during rest and tongue protrusion with oral appliances:A preliminary study with diffusion tensor imaging," Acoustic Science and Technology, vol. 29, pp. 291-4, 2008.
[3] N. M. H. Elsaid, M. Stone, S. Roys, R. P. Gullapalli, J. L. Prince and J. Zhuo, "Diffusion Spectrum Imaging Tractography of the Human Tongue," in Proceedings of the 25th Annual Meeting of ISMRM, Honolulu, Hawaii, 2017.
[4] V. J. Wedeen, P. Hagmann, W. Y. Tseng, T. G. Reese and R. M. Wisskoff, "Mapping complex tissue architecture with diffusion spectrum magnetic resonance imaging.," Magn Reson Med, vol. 54, no. 6, pp. 1377-86, 2005.
[5] F.-C. Yeh, T. D. Verstynen, Y. Wang, J. C. Fernández-Miranda and W.-Y. I. Tseng, "Deterministic diffusion fiber tracking improved by quantitative anisotropy," PLoS ONE, vol. 8, no. 11, p. e80713, 2013.
[6] F. Grussu, T. Schneider, C. Tur, R. L. Yates, M. Tachrount, A. Ianus, M. C. Yiannakas, J. Newcombe, H. Zhang, D. C. Alexander, G. C. DeLuca and C. A. M. G. Wheeler-Kingshott, "Neurite dispersion: a new marker of multiple sclerosis spinal cord pathology?," Annals of Clinical and Translational Neurology, p. (Preprint), 2017.
[7] F. Grussu, T. Schneider, R. L. Yates, H. Zhang, C. A. M. G. Wheeler-Kingshott, G. C. DeLuca and D. C. Alexander, "A framework for optimal whole-sample histological quantification ofneurite orientation dispersion in the human spinal cord," Journal of Neuroscience Methods, vol. 273, pp. 20-32, 2016.
[8] "http://dsi-studio.labsolver.org," [Online].
Figures


