0740
Joint modelling of diffusion MRI and histology1Wellcome Centre for Integrative Neuroimaging, FMRIB, Nuffield Department of Clinical Neurosciences, University of Oxford, Oxford, United Kingdom, 2Department of Anatomy, Donders Institute for Brain, Cognition and Behaviour, Radboud University Medical Centre (Radboudumc), Nijmegen, Netherlands, 3Nuffield Department of Clinical Neurosciences, University of Oxford, Oxford, United Kingdom
Synopsis
Constrained spherical deconvolution determines the orientation of white matter fibres from the diffusion MRI signal. To do so, the diffusion profile of a single fibre is estimated and assumed constant across the sample. However, the diffusion signal is dependent on microstructural properties such as axonal diameter, packing and myelination, which questions the assumption of a single-fibre response function. This multimodal study combines diffusion MRI with histology from the same tissue sample, to test the validity of a ‘brain-wide’ fibre response function. Preliminary results indicate that in practice the fibre response function is indeed dependent on local anatomy.
Introduction
Constrained spherical deconvolution (CSD)1 aims to characterize the distribution of fibre orientations within a diffusion-weighted MRI (dMRI) dataset. CSD approximates the dMRI signal attenuation using a linear model which represents the signal attenuation as the convolution of the within-voxel fibre orientation distribution functions (ODFs ) with a single-fibre response function (FRF). However, the diffusion profile of white matter is dependent on many microstructural parameters including axonal density, packing and myelination. In this work, we combine dMRI and microscopy data from the same tissue sample to investigate the FRF under conditions where the true fibre orientations are known. We consider standard methods for estimating the FRF from measured diffusion signals. We then take this approach further by jointly modelling diffusion MRI with histology data. Hence, we can investigate how the FRF changes with anatomy and ask whether the assumption of a ‘brain-wide’ FRF used in CSD is realistic in practice.Methods
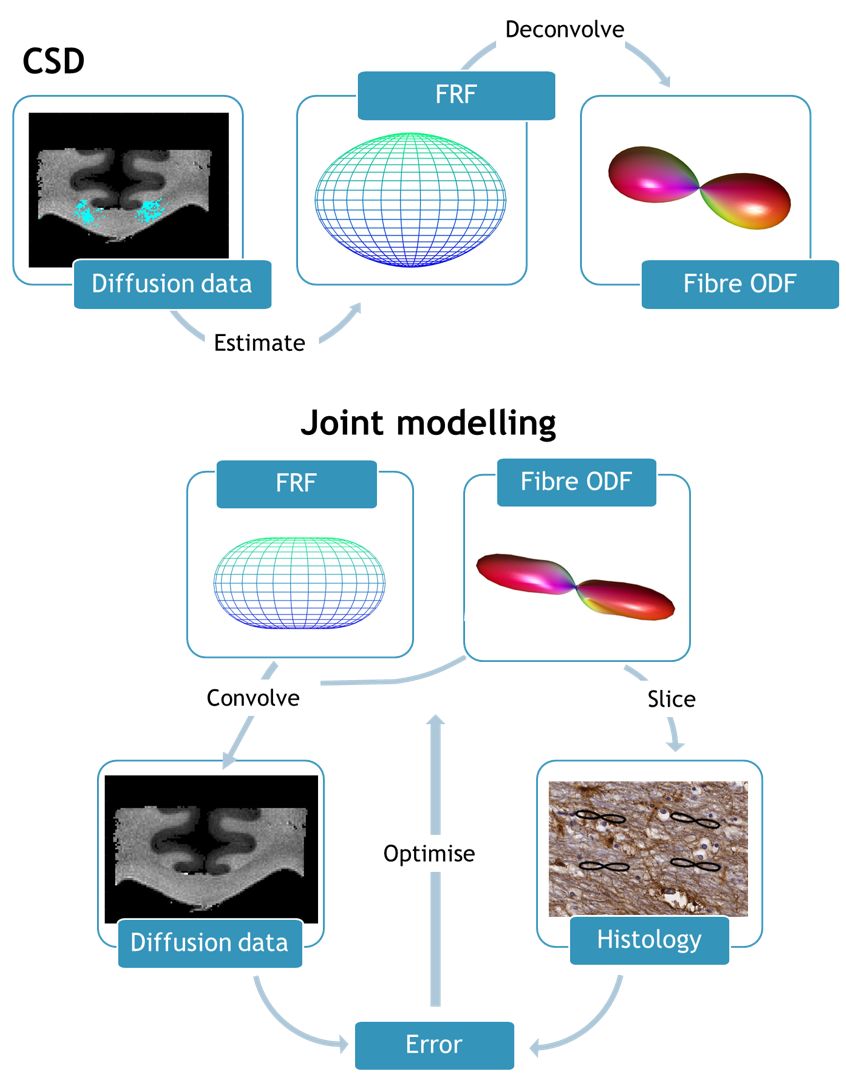
Joint model: The joint model (JM) pipeline is illustrated in Figure 1, and compared with the CSD approach. In CSD, the diffusion signal sampled at the diffusion gradient directions $$$(\theta_{0},\phi_{0})$$$ is modelled as the convolution of the ODF with the FRF: $$S(\theta_{0},\phi_{0})=\int_{S^{2}}ODF(\theta,\phi)FRF(\theta-\theta_{0},\phi-\phi_{0})d\theta d\phi$$
This model was extended to enable joint estimation of the FRF and ODF for datasets with dMRI (informing about both the FRF and ODF in 3D) and histology (providing 2D information about the ODF). The diffusion profile was modelled as a prolate tensor characterised by two apparent diffusion coefficients, parallel and perpendicular to the primary fibre orientation. The ODF was modelled using spherical harmonics (SH). Nonlinear optimisation (MATLAB’s fmincon) was initialised using SH coefficients output from the MRtrix algorithm for CSD2.
MRI: Post-mortem dMRI data of a 5mm thick coronal slice of excised human brain tissue was acquired on a 9.4T preclinical MRI system with a maximum gradient strength of 400mT/m, b-value of 5000s/mm2 over 120 gradient directions, four b=0 images, and an isotropic spatial resolution of 0.4mm3.
Histology: The myelin and astrocyte content were visualised with a spatial resolution of 0.28µm/pix. Using structure tensor analysis3, the primary fibre orientation per pixel was estimated. Patches of 1400x1400 pixels were combined to generate a histology ODF for a ‘superpixel’ comparable to the 0.4mm spatial resolution of dMRI.
Analysis: MRI and histology data were co-registered as described previously4. We compared modelling using conventional CSD approaches to the JM described above. The convolution of the FRF and ODF was directly compared to the diffusion data. Additionally the ODF was sampled in 2D for comparison with histology. For JM, the FRF and ODF were simultaneously fit across a 5x5 neighbourhood of voxels (with a shared FRF but independent ODFs) in both the corpus callosum (CC) and the corticospinal tract (CST).
Results
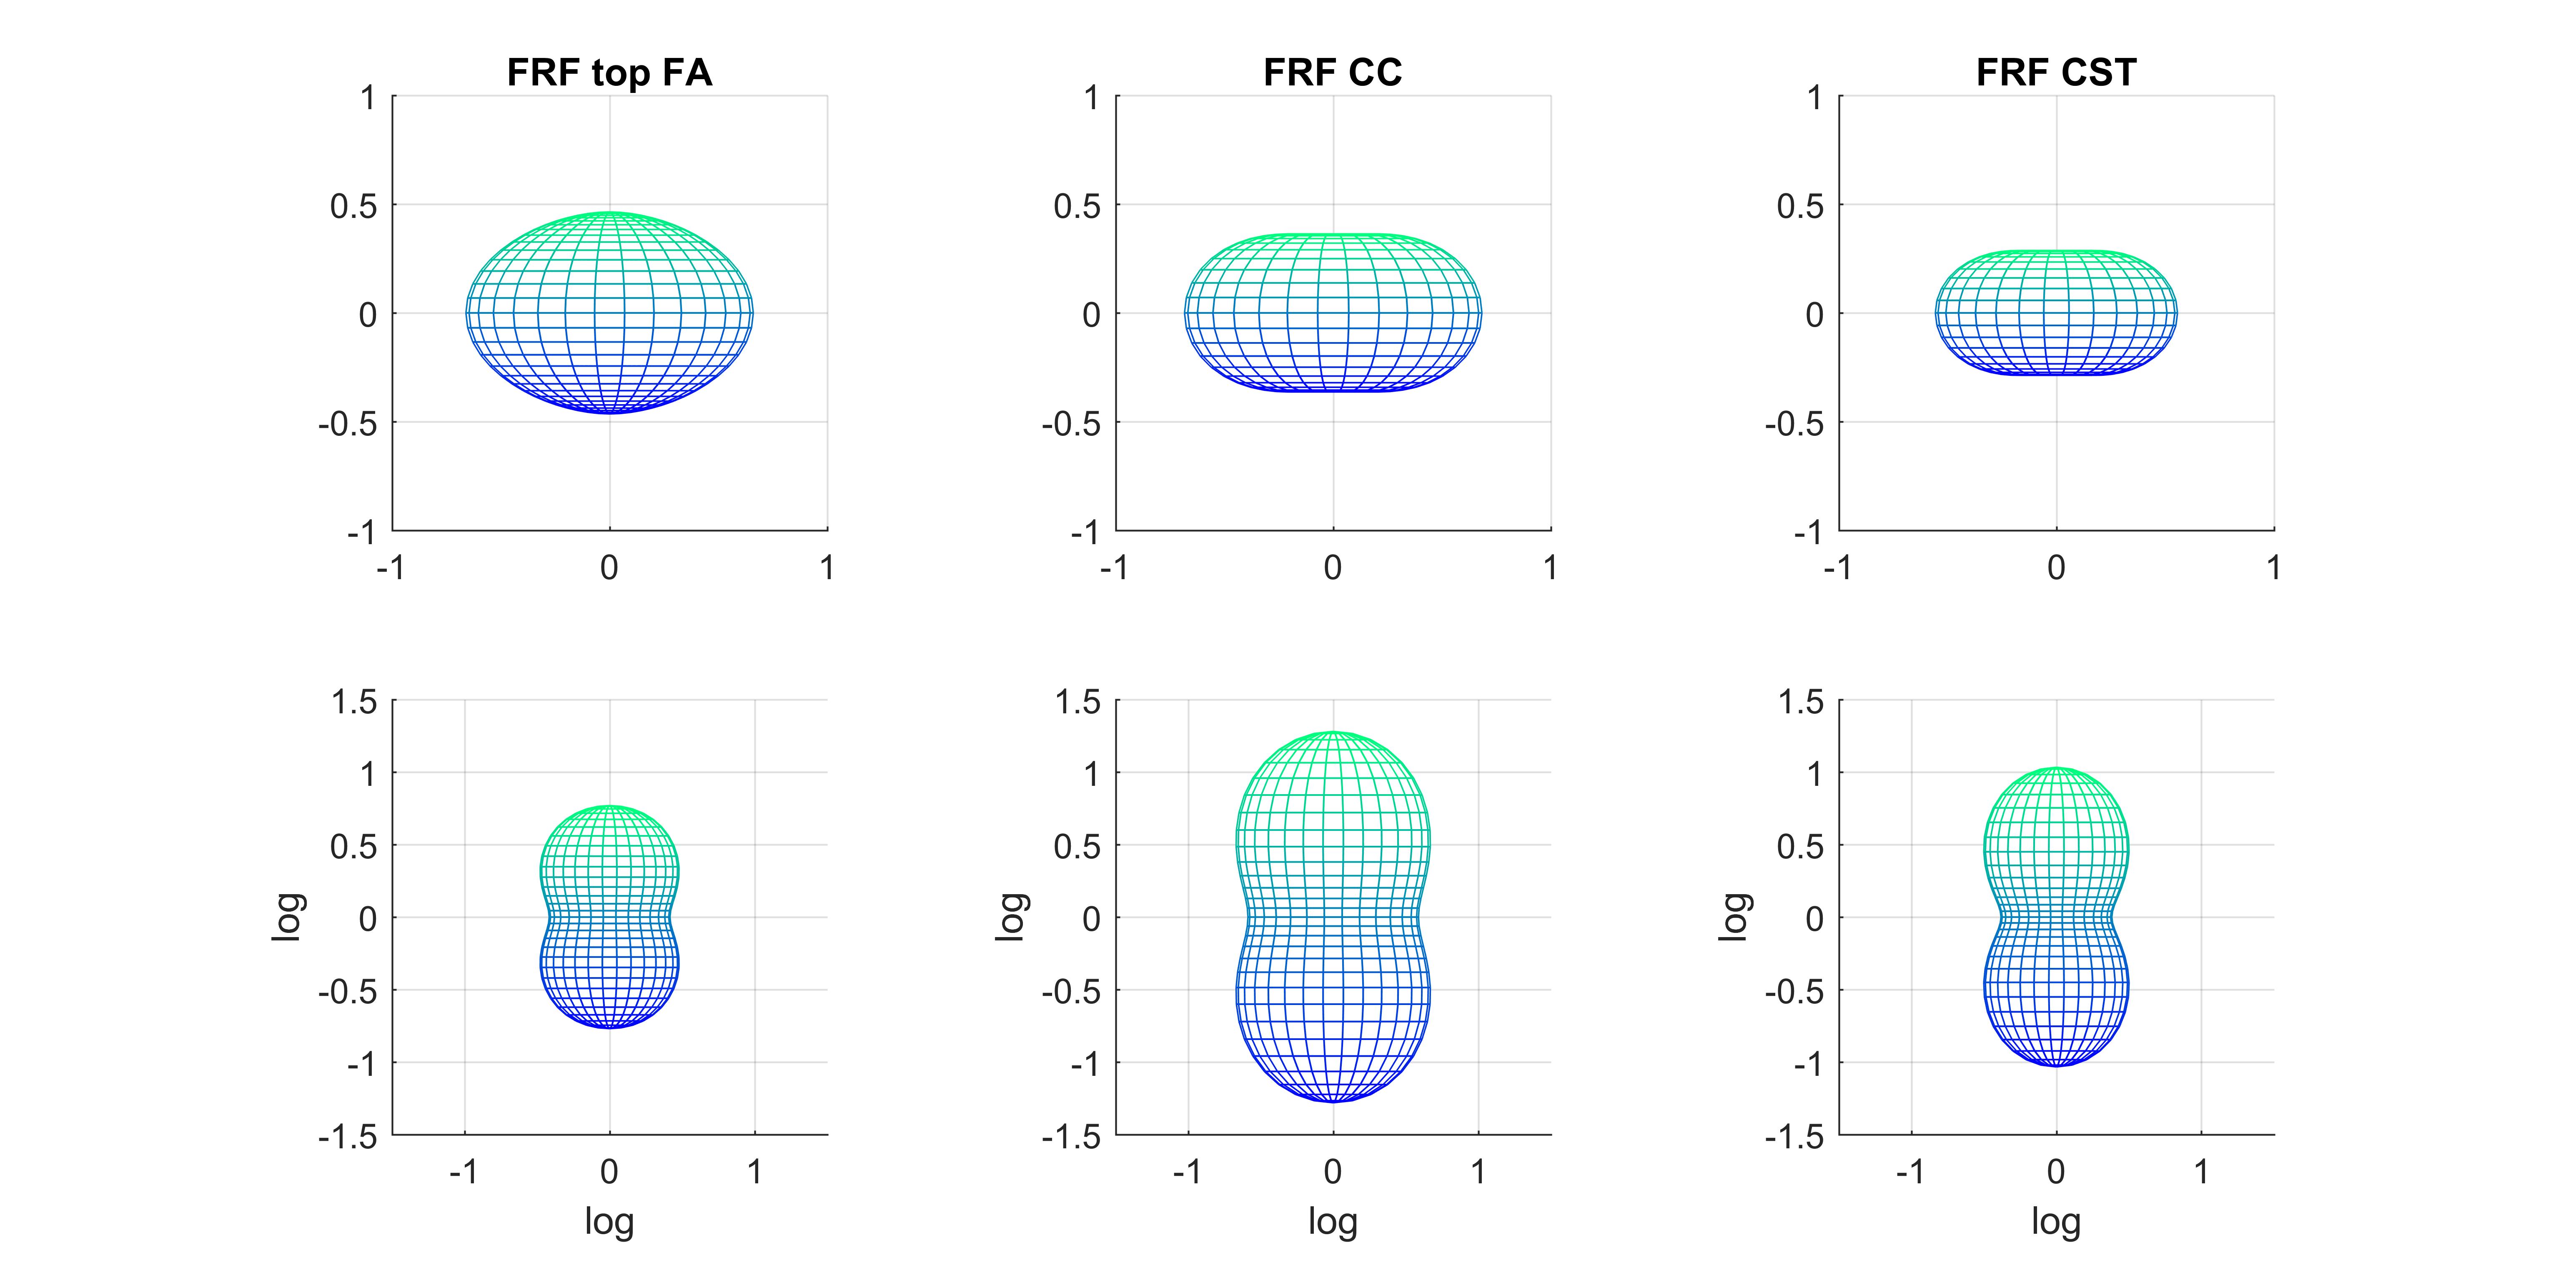
We first considered two ways of estimating the FRF from the diffusion data alone (Figure 2). The FRF derived from our JM approach suggests higher axial diffusivity at the midline of the CC compared to the common approach of averaging the signal attenuation from the 300 highest FA voxels. This is in line with reports suggesting significant fibre dispersion in the CC5.
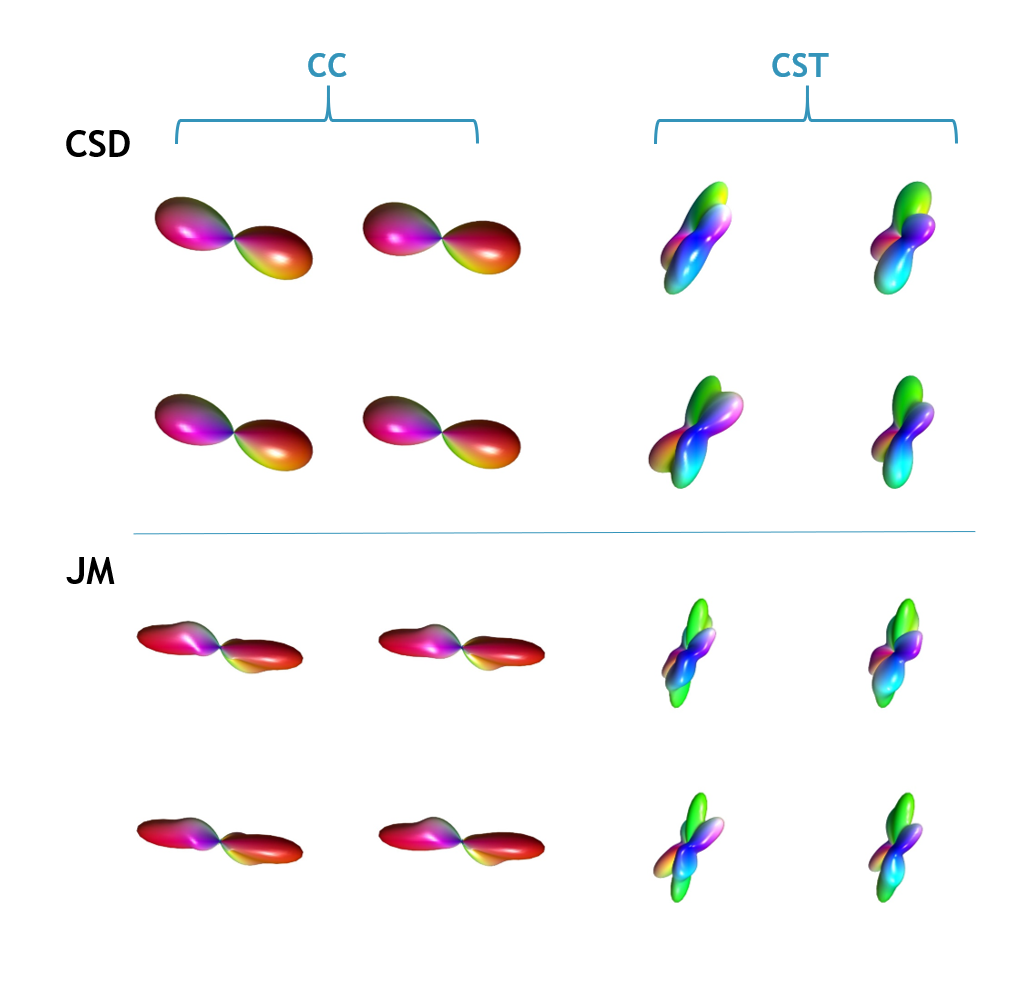
Figure 3 compares the CSD and JM derived fibre ODFs. The JM estimates lower dispersion in the underlying fibres. Again, this likely reflects a shortcoming in using diffusion data to directly estimate the FRF: even in the CC, voxels don’t in general contain a homogeneous, perfectly coherent set of fibres, therefore potentially biasing the amount of dispersion in the estimated ODF. In the CST, the JM also appears to estimate additional distinct fibre populations.
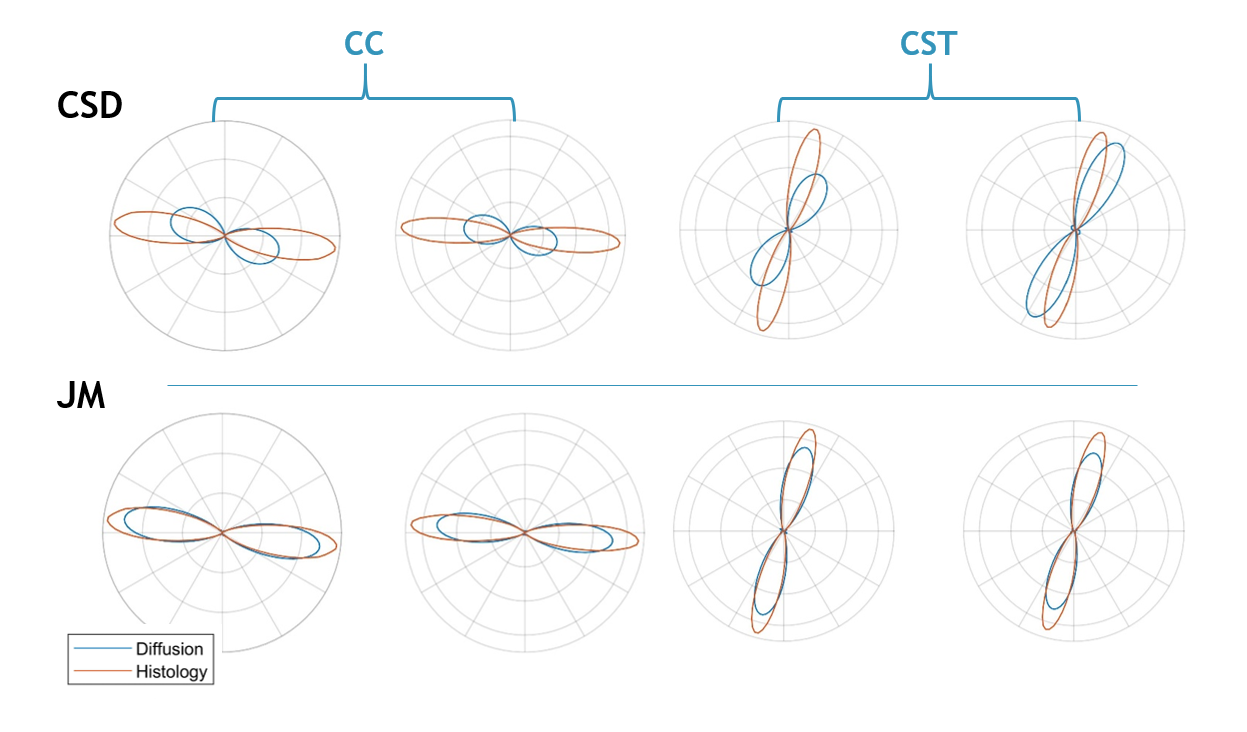
Figure 4 plots the ODFs in the plane of the histology data. Due to its multimodal nature, the JM is constrained to fit the histology defined ODF. This is reflected in the improved agreement of the diffusion ODF with histology in terms of both orientation and dispersion (width).
Discussion and Conclusion
We used a multimodal approach, combining co-registered dMRI and histology of the same sample, to test the validity of a brain-wide fibre response function in spherical deconvolution. Our preliminary results demonstrate that the FRF is dependent on the local anatomy and how the current practice of empirically estimating the FRF can bias the ODF shape. Furthermore, we show that the FRF can be estimated alongside the full ODF with additional, albeit 2D, information provided by the histology. In future work, we aim to build models that combine dMRI with both histology (2D information) and polarised light imaging (additional 3D information on the ODF), acquired in the same sample, to better characterise and constrain joint FRF and ODF estimation.Acknowledgements
This work was supported by funding from the Engineering and Physical Sciences Research Council (EPSRC) and Medical Research Council (MRC) [grant number EP/L016052/1]References
1. J. D. Tournier, F. Calamante, and A. Connelly, “Robust determination of the fibre orientation distribution in diffusion MRI: Non-negativity constrained super-resolved spherical deconvolution,” Neuroimage, vol. 35, no. 4, pp. 1459–1472, 2007.
2. J. D. Tournier, F. Calamante, and A. Connelly, “MRtrix: Diffusion tractography in crossing fiber regions,” Int. J. Imaging Syst. Technol., vol. 22, no. 1, pp. 53–66, 2012.
3. M. D. Budde and J. A. Frank, “Examining brain microstructure using structure tensor analysis of histological sections,” Neuroimage, vol. 63, no. 1, pp. 1–10, 2012.
4. J. Mollink et al., “Evaluating fibre orientation dispersion in white matter: Comparison of diffusion MRI, histology and polarized light imaging,” Neuroimage, vol. 157, no. December 2016, pp. 561–574, 2017.
5. S. Mikula and W. Denk, “High-resolution whole-brain staining for electron microscopic circuit reconstruction,” Nat. Methods, vol. 12, no. 6, pp. 541–546, 2015.
Figures