0736
Post-mortem mapping of cortical layers using combined multicompartmental relaxometry and diffusometry at ultra-high field (7T and 11.7T)1UNIRS, CEA/DRF/Neurospin, Gif-sur-Yvette, France, 2Université Paris-Saclay, Orsay, France, 3FLI / Noeud Paris-Sud, Orsay, France, 4Université François-Rabelais de Tours, INSERM, Imagerie et Cerveau UMR 930, Tours, France, 5UNATI, CEA/DRF/Neurospin, Gif-sur-Yvette, France, 6http://cati- neuroimaging.com/, Gif-sur-Yvette, France
Synopsis
The human cerebral cortex has a laminar structure presenting distinct cell organization and myelination. In this work, we compare the lamination observed from multicompartmental quantitative relaxometry- or diffusometry-based microstructural ultra-high field MRI on a post-mortem human brain visual cortex sample. This study reveals that the quantitative intra-neuritic volume fraction map provides a better delineation of the line of Gennari in the primary visual cortex whereas multicompartment T1 relaxometry provides a better segmentation of the superfical layers. Thus, this study strongly plays in favour of a combination of relaxometry and diffusometry methods to robustly map the cortex lamination in humans.
Introduction
The human cerebral cortex has a laminar structure presenting distinct cell organization and myelination. Cortical thickness has been shown to be associated with neurodegenerative diseases such as Parkinson's or Alzheimer's1,2, but pattern of cortical damage at the laminar level remains unclear. There is therefore a growing interest in imaging the brain at a mesoscopic scale to better map its cortical layers. Complementary to the use of ultra high-field (UHF) MRI to reach this scale, quantitative relaxometry and diffusometry MRI methods are also a promising way to enhance the resolution through the use of multicompartmental models that proved their effectiveness to discriminate cortical layers3,4. In this work, we go further and compare the delineations obtained using multicompartmental diffusometry and relaxometry MRI methods at the mesoscopic scale.Material and methods
Acquisition-
A
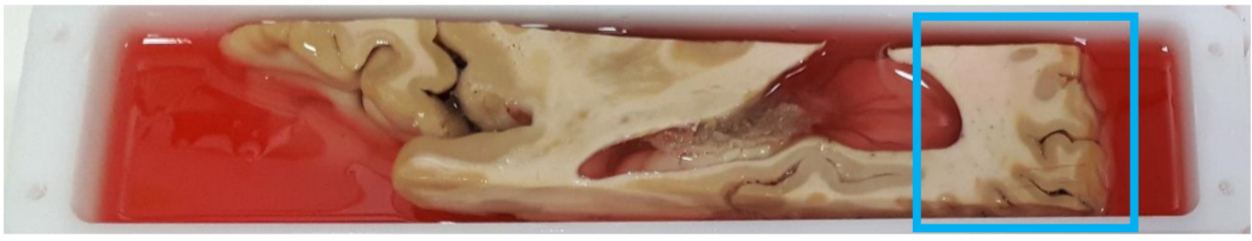
formalin-fixed post-mortem human brain sample containing primary and
secondary visual cortex was soaked in a phosphate-buffered saline
solution for rehydratation before being scanned with a preclinical
11.7T (for anatomical/diffusion MRI) and 7T (for relaxation)
Bruker MRI systems. The binding of the sample within its
container was guaranteed by an electrical insulating gel (Figure1). A
dedicated MRI protocol was tuned with the following parameters:
anatomical scan: isotropic 150μm resolution, TE/TR=12/6000ms;
diffusion-weighted (DW) scans using Pulsed Gradient Spina Echo (PGSE)
sequences: isotropic 300μm resolution, b=2000/4000/6000s/mm2
, 125/125/125directions, TE/TR=30.6/4500ms, δ=5.5ms, Δ=20ms;
T1-mapping scans using 3D inversion-recovery (IR) rapid acquisition
with relaxation enhancement (RARE) sequences: isotropic 300μm
resolution, TE/TR=5.6/3000ms and 122 inversion times spread between
100 and 2900ms.
T1-mapping- T1 analysis was done on a voxel-by-voxel basis by fitting the entire IR dataset to an exponential decay using Powell's NEWUOA5 algorithm.
Microstructure mapping- The 3-shell DW acquisitions were used to infer the neurite density using the NODDI6 model. Fixing the local principal direction estimated from the jointly estimated
DTI model and the diffusivities to d// =1.5.10 -10m2 /s and diso nul, it provided quantitative maps of the intracellular volume fraction representing the neurite density (fintra ). fintra maps were then deblurred with a non-local means agorithm7,8.
Clustering-
A
Gaussian mixture model was used to fit the whole sample T1 and fintra
distributions using a Bayesian Index Criterion (BIC) to define the
optimum number of components. Labels were then associated to each
voxel, based on the minimal distance to the resulting clusters. Labels
corresponding to white matter (WM) were merged to enhance the
visualization of cortical layers.
Results and discussion
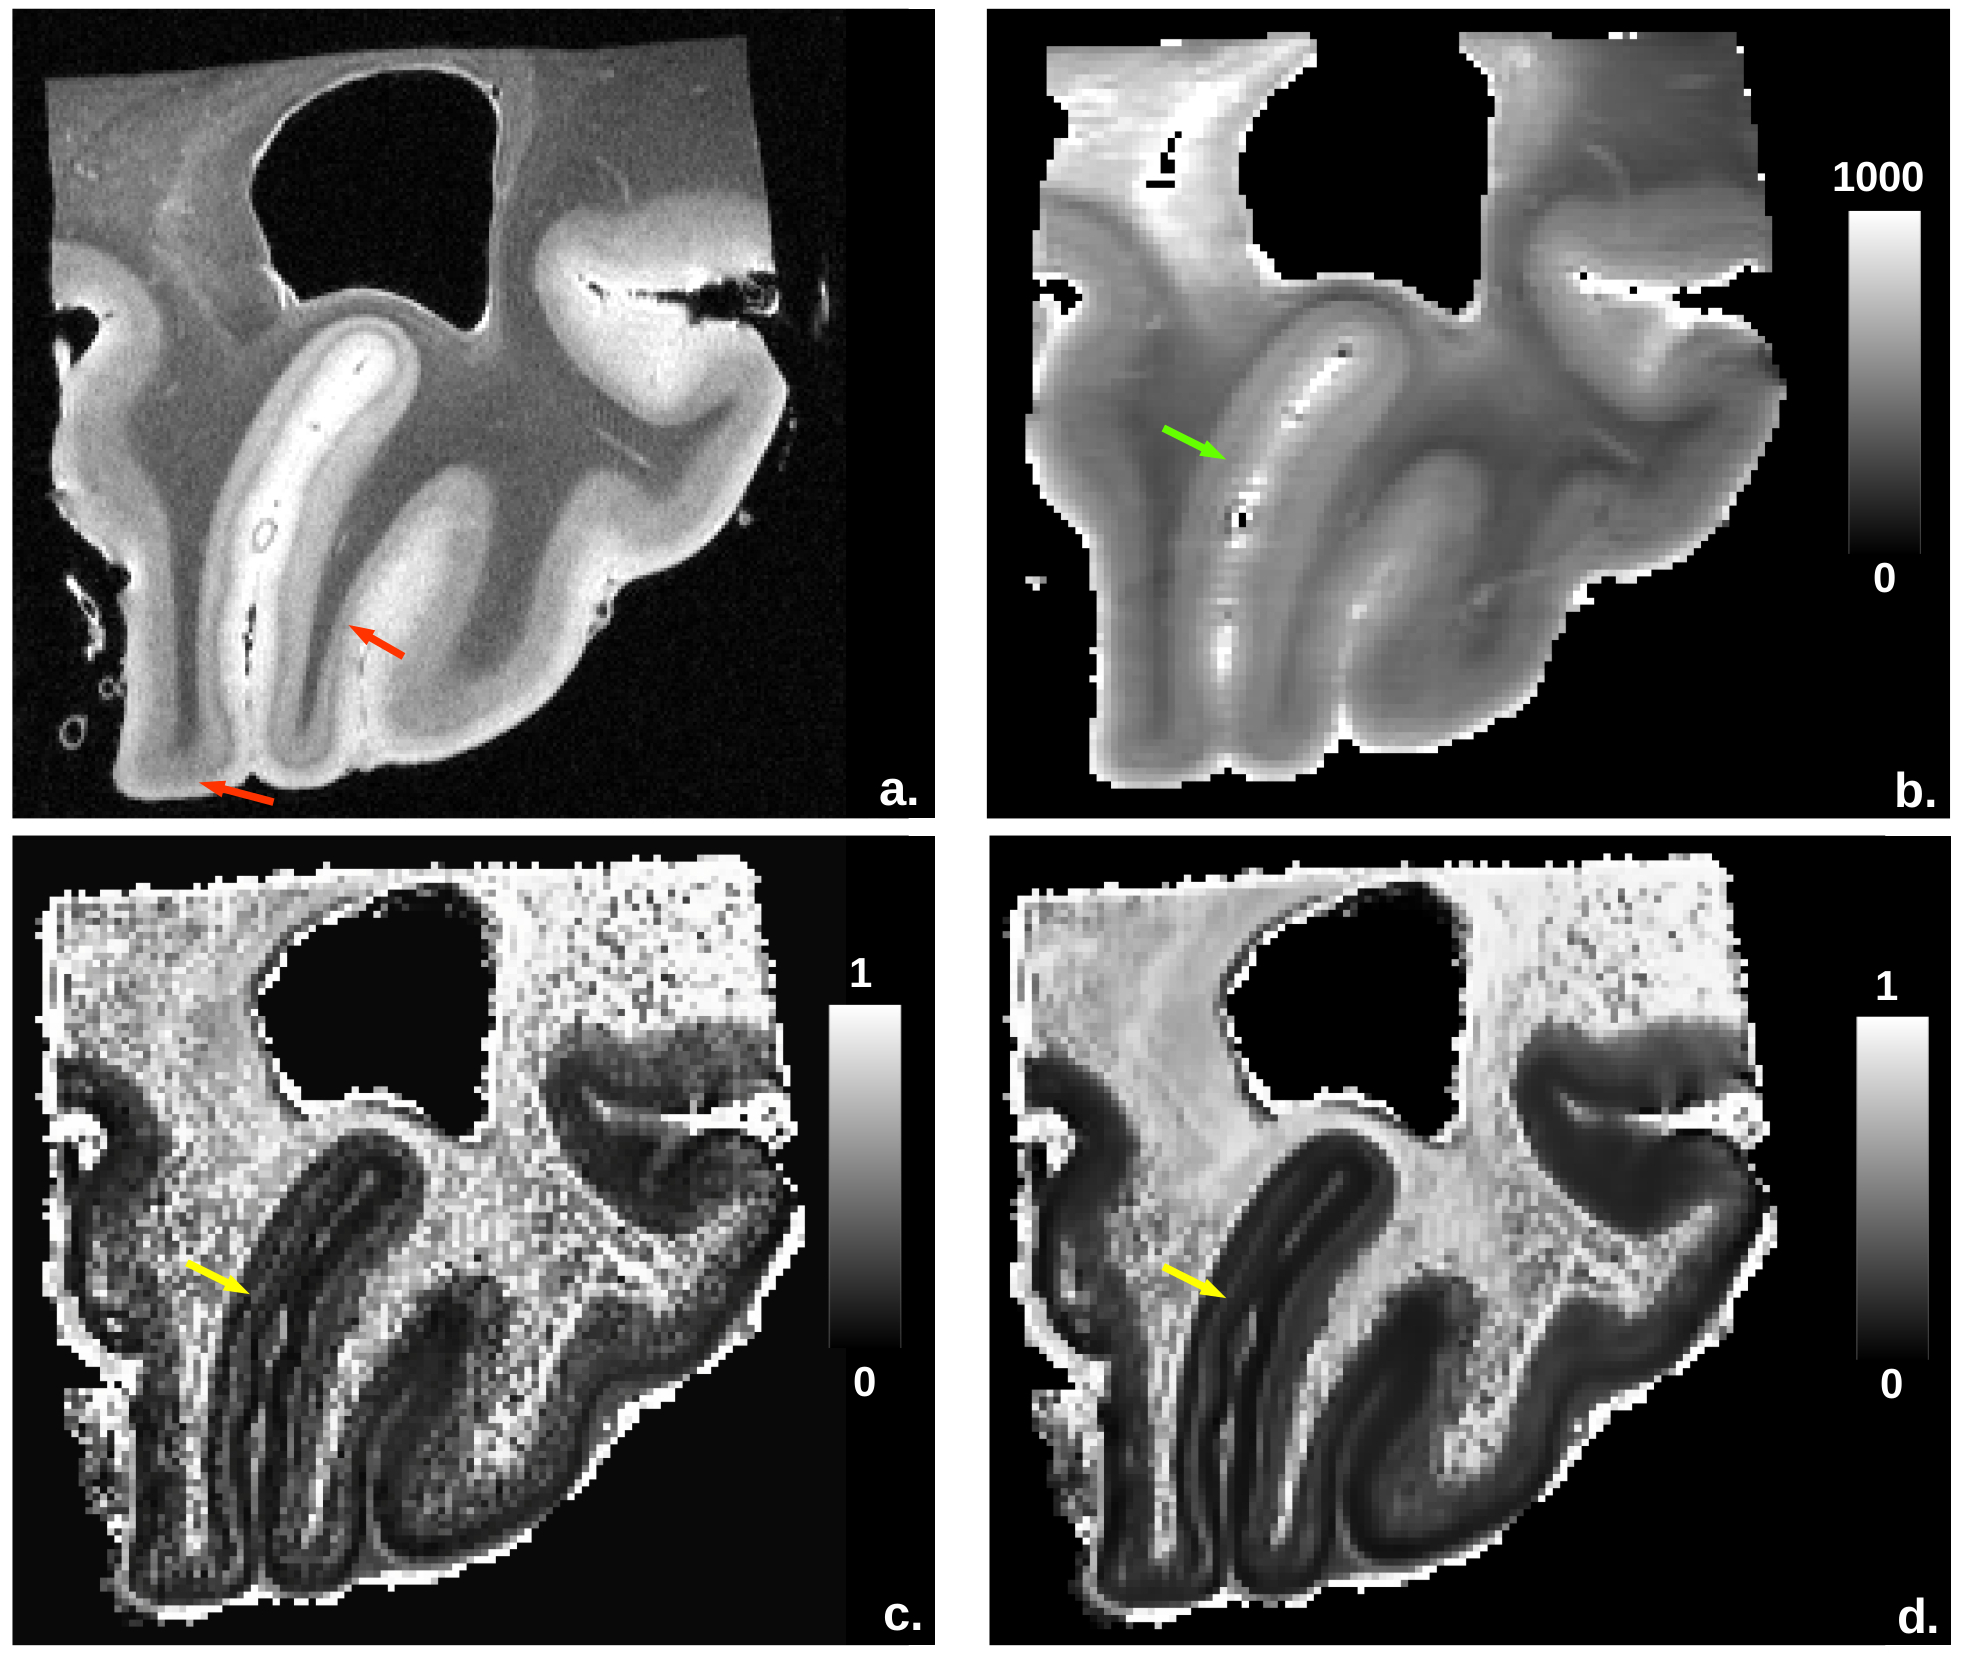
Figure2
depicts the anatomy, fintra and T1 quantitative maps. The anatomical
scan, which perfectly visualized the primary visual cortex, was used as a reference. The fintra map, more sensitive to high neurite density than
T1-relaxometry, finely discriminated the line of Gennari, which appeared as an hypointense line paralell to the cortex surface.
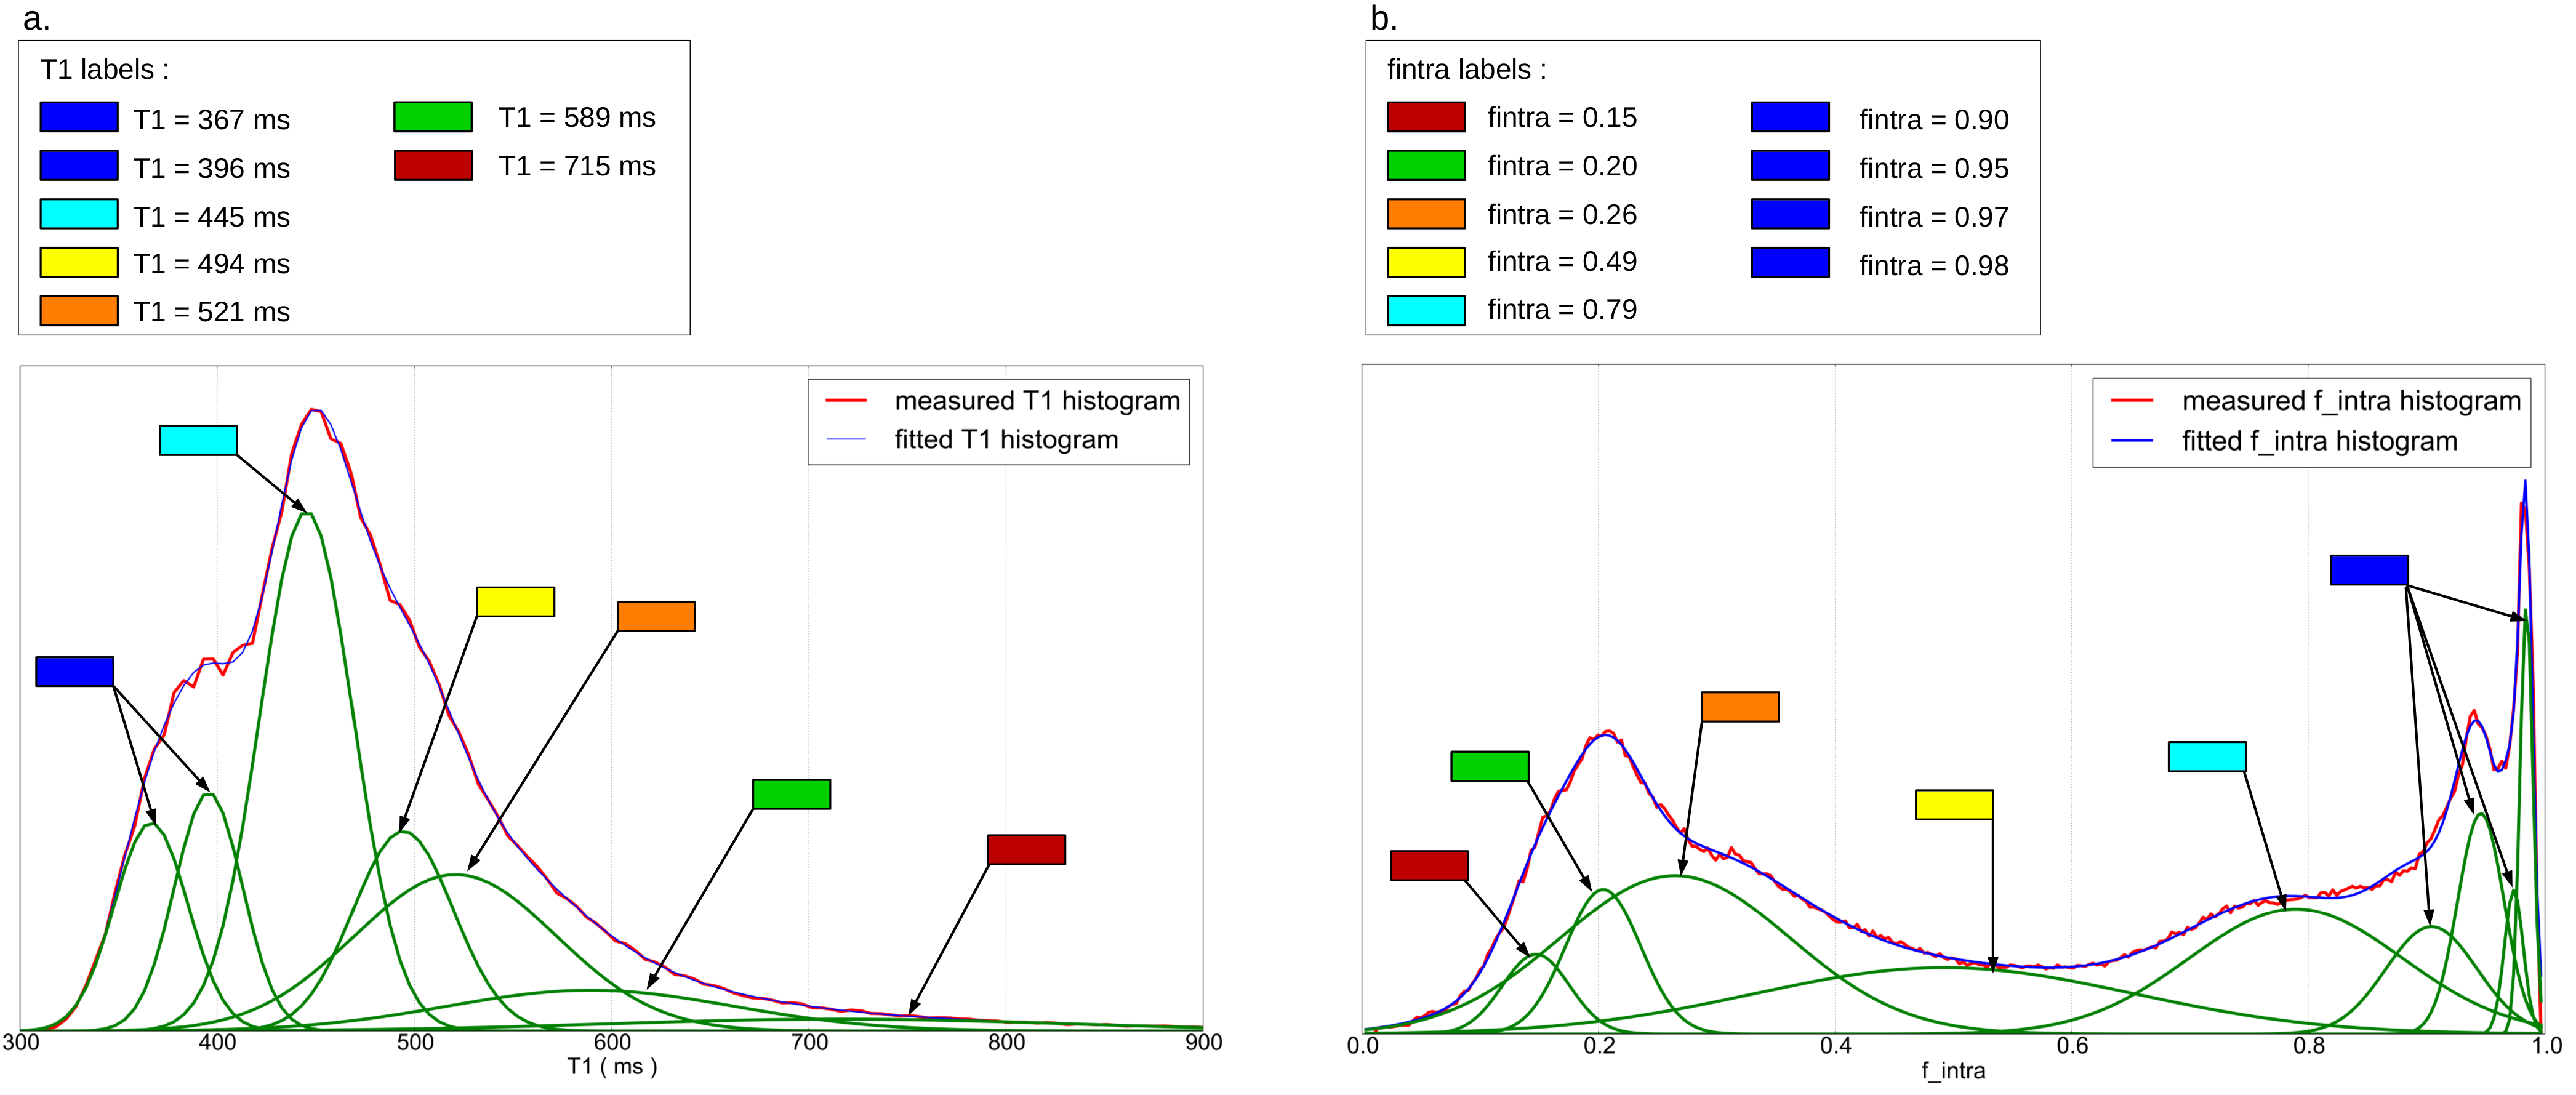
Gaussian
mixture fits are shown in Figure3. Seven clusters were found from the
analysis of the T1 mapping whereas nine clusters were found from the
analysis of the intracellular volume fraction. Low T1 values were
associated to the WM, as well as high fintra values (deep
blue labels). WM presented distinct modes corresponding to various
fiber configurations (crossings, various fiber densities).
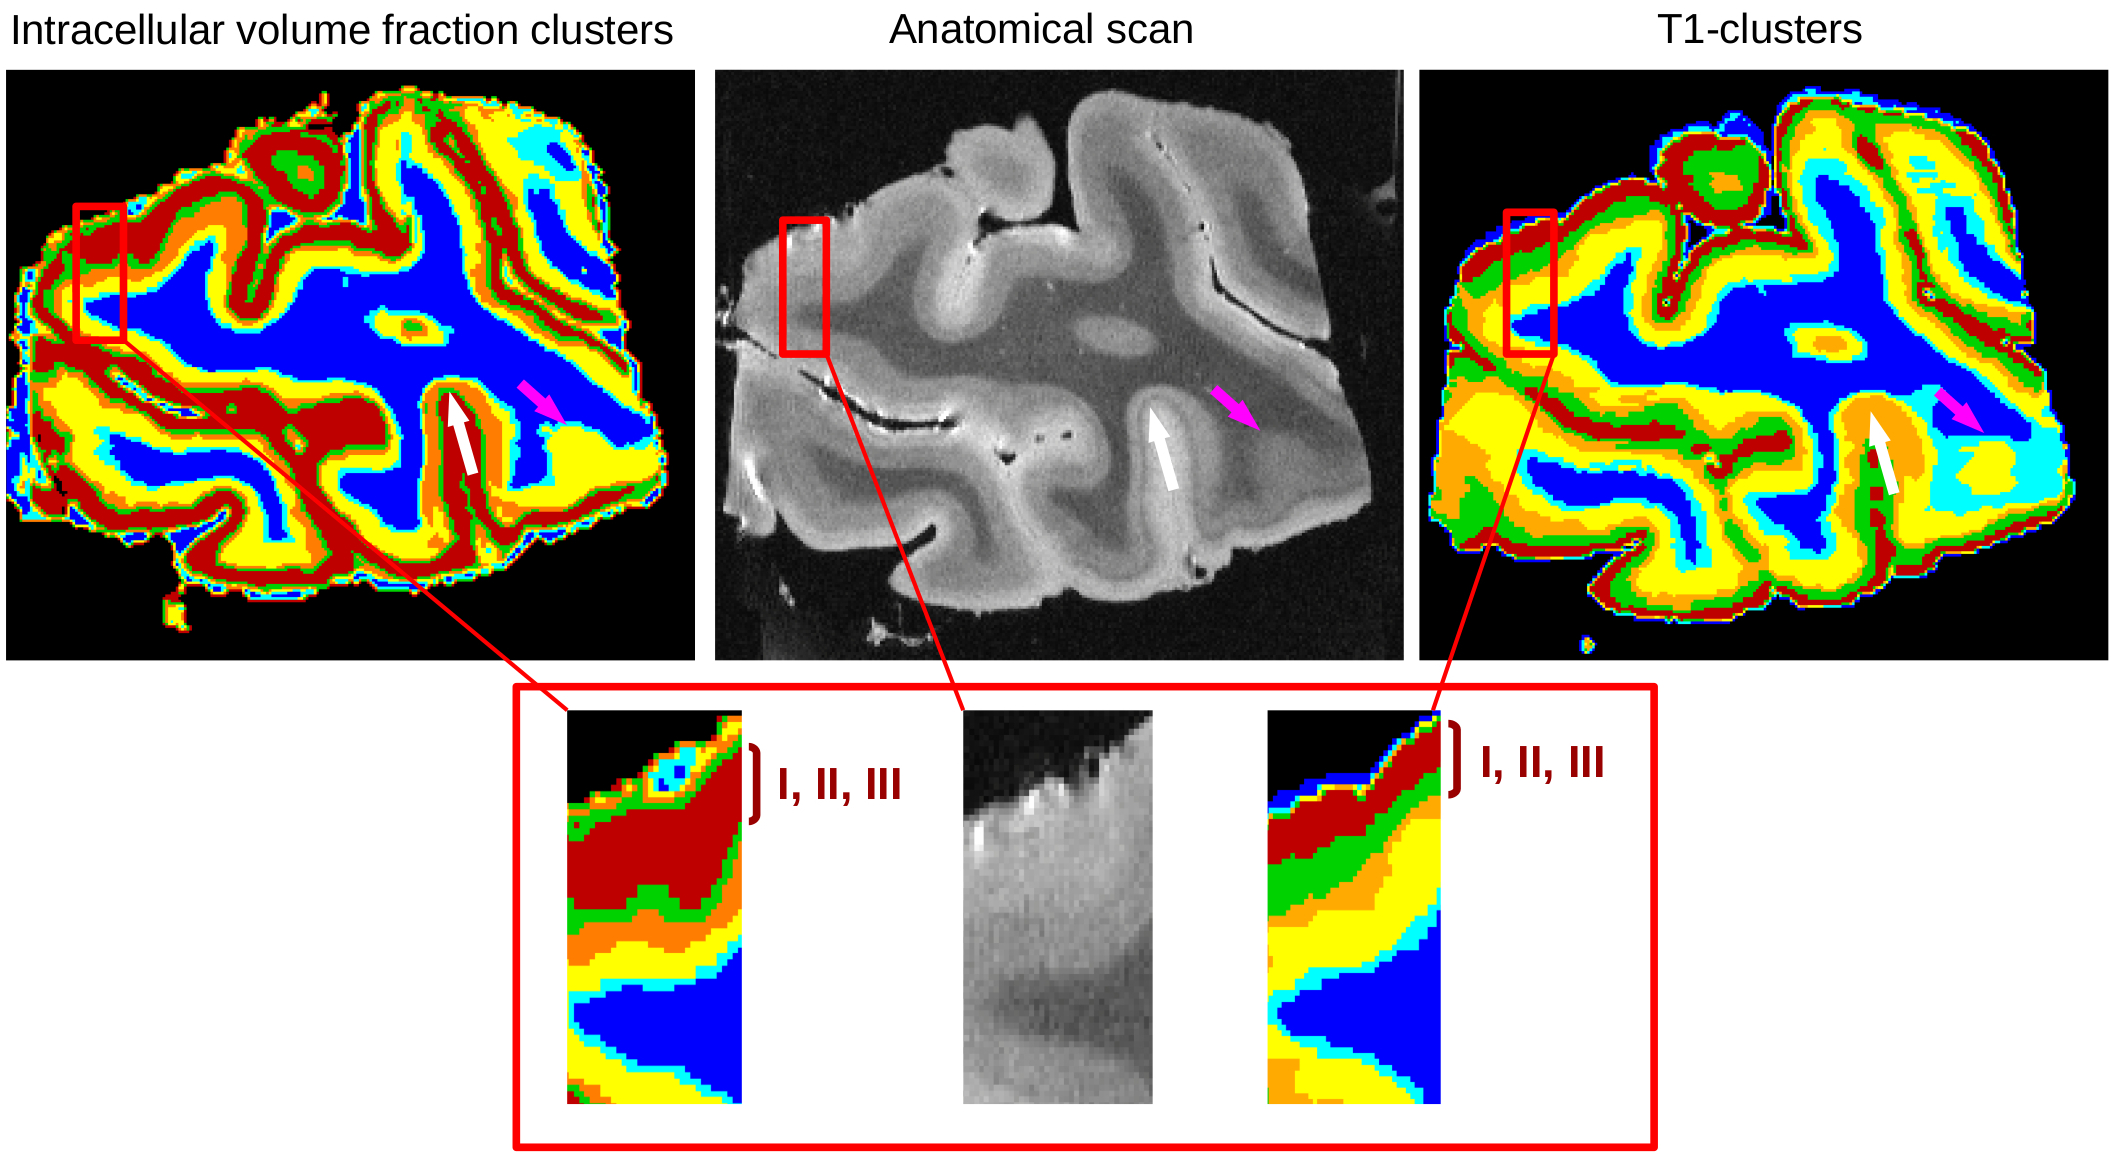
Gray
cortical matter was represented by five labels in both approaches,
allowing to delineate cortical layers, as depicted in Figure4. The
outer layers (I, II and III) were associated to a single mode of the
intracellular volume fraction map (deep red colour), whereas two
labels have been identified from the T1 custering approach (deep red
and green colours). These layers are characterized by low neurite
densities and mainly correspond to two types of cells (granular in
layer II and pyramidal in layer III), thus yielding different T1
values. This result is in agreement with Kleinnijenhui4 showing
a poor intracellular volume fraction in the superficial layers.
Stripes of Baillarger, in layers IV and V, have a high neurite density,
explaining the increased intracellular volume fractions. The deep and
light blue zones respectively correspond to voxels containing only WM and voxels
containing both WM and gray matter (GM). White and pink arrows
highlighted regions where the fintra-based clustering seems to provide patterns of cortical layers more consistent with the anatomical scan than T1-based clustering. Green line folllows the line of
Gennari (white arrow) and the limit between WM and GM is well
established (pink arrow).
Conclusion
In this work, we demonstrated that the association of UHF-MRI relaxometry and diffusion MR microscopy allows to robustly detect the cortical layers in a complementary way exploiting the magnetic and diffusive properties of their cellular environment. Clustering based on the neurite density map accurately delineates the stria of Gennari, but displays layers I, II and III as a whole since they have a poor neurite density, whereas clustering based on T1-relaxometry delineates boundaries in superficial layers.Acknowledgements
This work was partially funded by the European FET Flagship ‘Human Brain Project’ (SP2) FP7-ICT-2013-FET-F/604102.
The authors acknowledge the donor who gave his body to science for this study.
References
1. Fjell, Anders M., et al. "What is normal in normal aging? Effects of aging, amyloid and Alzheimer's disease on the cerebral cortex and the hippocampus." Progress in neurobiology 117 (2014): 20-40.
2. Jubault, Thomas, et al. "Patterns of cortical thickness and surface area in early Parkinson's disease." Neuroimage 55.2 (2011): 462-467.
3. Lifshits, Shlomi, et al. "Resolution considerations in imaging of the cortical layers." NeuroImage (2017).
4. Kleinnijenhui et al, "Detailed laminar characteristics of the human neocortex revealed by NODDI." Proc.ISMRM (Abstract #0837), 2013.
5. Powell, Michael JD. "The NEWUOA software for unconstrained optimization without derivatives." Large-scale nonlinear optimization. Springer US, 2006. 255-297.
6. Zhang, Hui, et al. "NODDI: practical in vivo neurite orientation dispersion and density imaging of the human brain." Neuroimage61.4 (2012): 1000-1016.
7. Buades, Antoni, Bartomeu Coll, and Jean-Michel Morel. "Non-local means denoising." Image Processing On Line 1 (2011): 208-212.
8. Condat, Laurent. "A simple trick to speed up and improve the non-local means." (2010).
Figures