0734
Validation of diffusion MRI models and tractography algorithms using chemical tracing1Harvard-MIT Health Sciences and Technology, Massachusetts Institute of Technology, Cambridge, MA, United States, 2Athinoula A. Martinos Center for Biomedical Imaging, Massachusetts General Hospital and Harvard Medical School, Charlestown, MA, United States, 3University of Rochester School of Medicine, Rochester, NY, United States, 4McLean Hospital, Belmont, MA, United States
Synopsis
Brain circuitry is still poorly understood, posing a challenge to the validation of diffusion MRI (dMRI) tractography. Many aspects of tractography algorithms, such as their choice of diffusion model or deterministic vs. probabilistic approach, can impact on their performance. Therefore, beyond a qualitative validation, we need quantitative metrics for comparing and optimizing these algorithms. In this work we perform a systematic evaluation of different diffusion models and tractography algorithms by assessing their accuracy with respect to chemical tracing in macaques. We find that the combination of probabilistic tractography and GQI/DSI model yields the best results, and that accuracy does not always improve with higher angular resolution.
Purpose
dMRI tractography is the only non-invasive technique for reconstructing white matter (WM) pathways in the brain. However, factors such as diffusion model and tractography algorithm can affect its performance and the lack of ground truth poses a challenge for quantifying its anatomical accuracy. Here, we use chemical tracing in a monkey for validating the accuracy of the WM pathways reconstructed from dMRI data using different diffusion models and tractography algorithms. Previous studies that performed validation using chemical tracing have used dMRI with low angular resolution1–3, or compared tracer and dMRI from different animals1,4,5, or only focused on the terminations of connections rather than the entire path6–8. Here, we collected ex-vivo dMRI data with 515 gradient directions and a bmax of 40k on twelve macaque brains, one of which also received a tracer injection in Brodmann area (BA) 10. We fit various dMRI models to the data and use them for tractography, extending our previous work where we only performed such an evaluation for a single model9. We compare methods based on their accuracy in reconstructing the true connections identified by the tracer.Methods
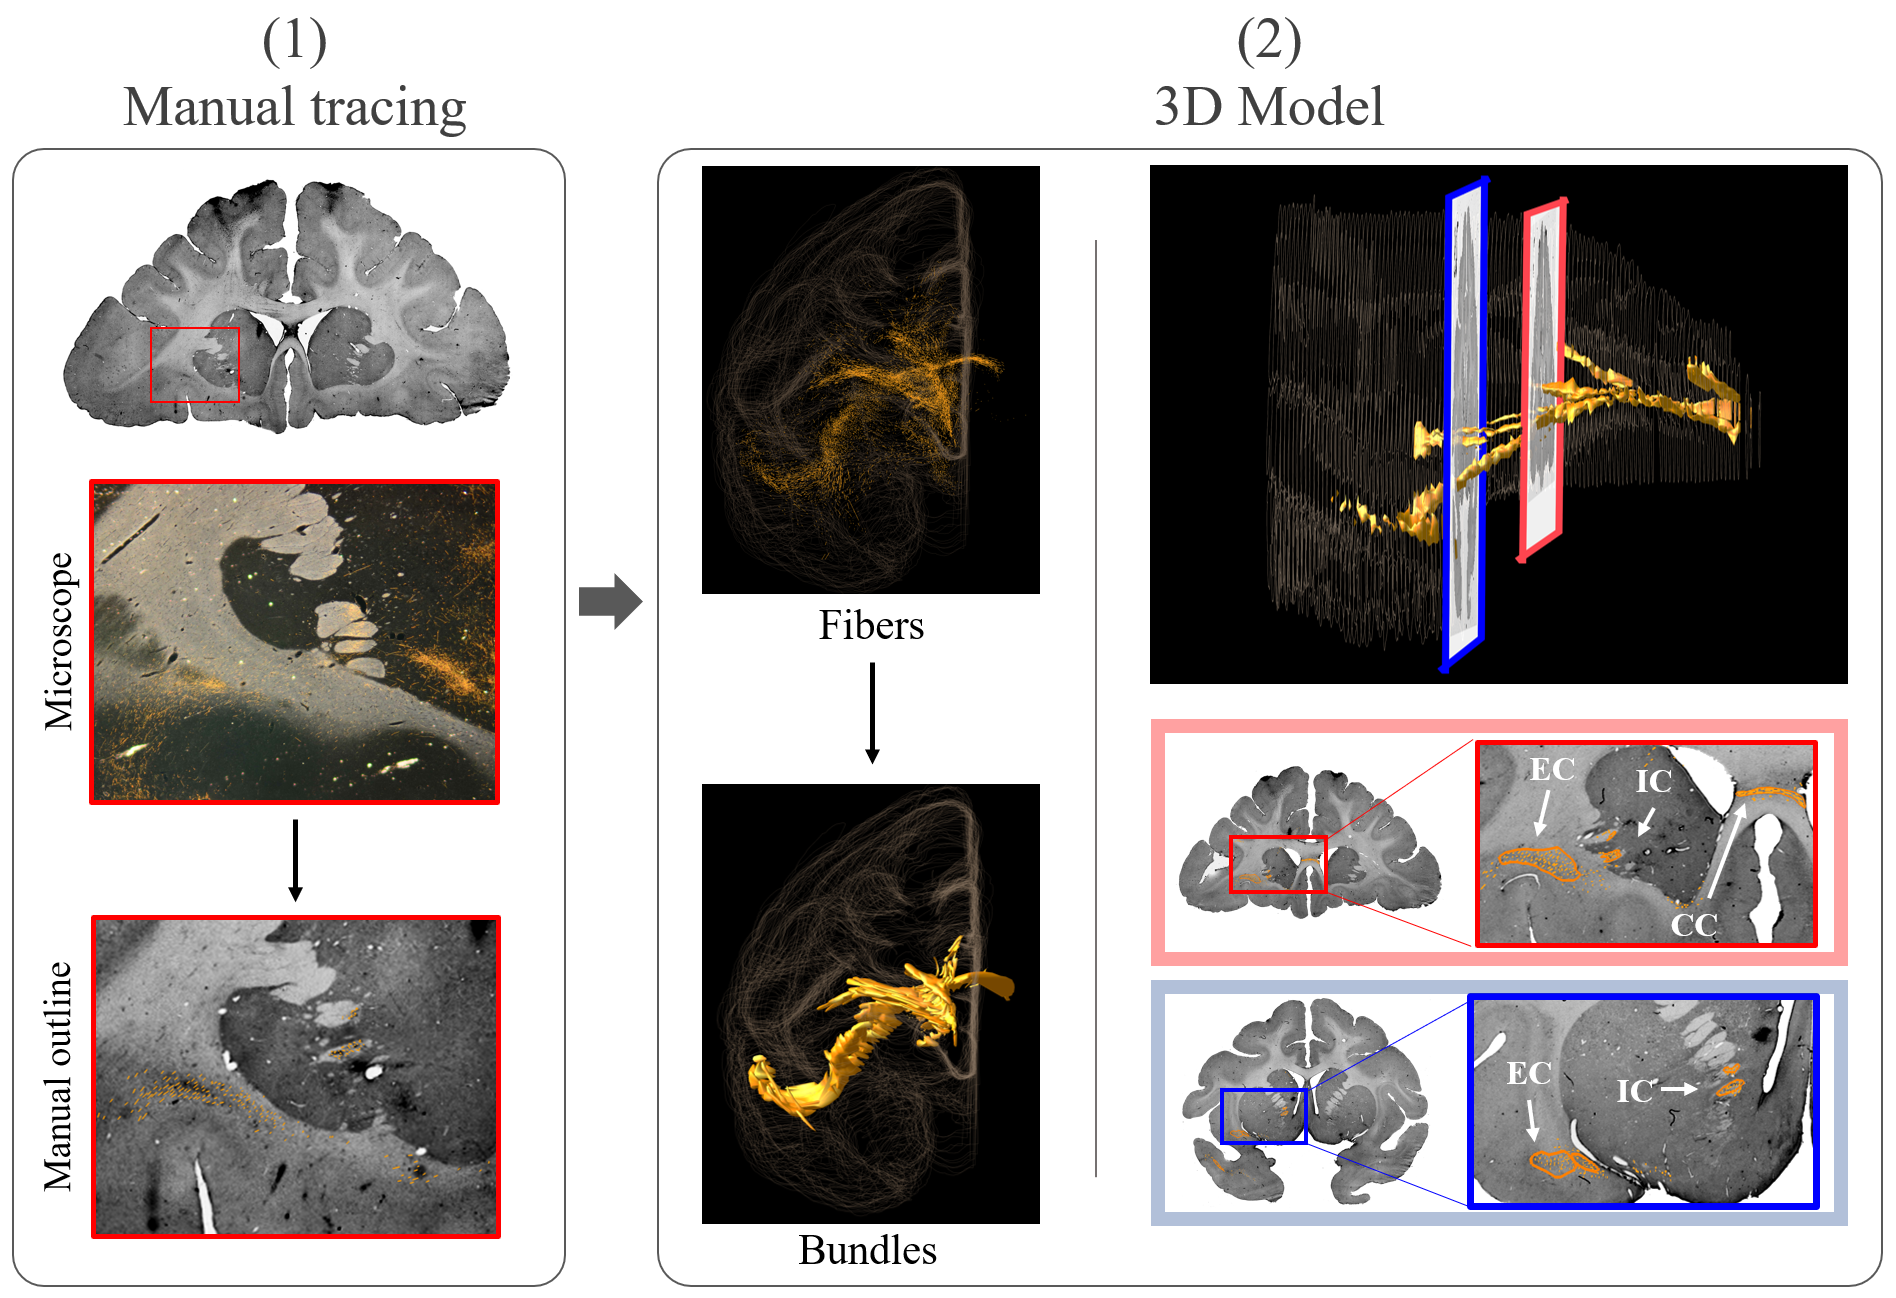
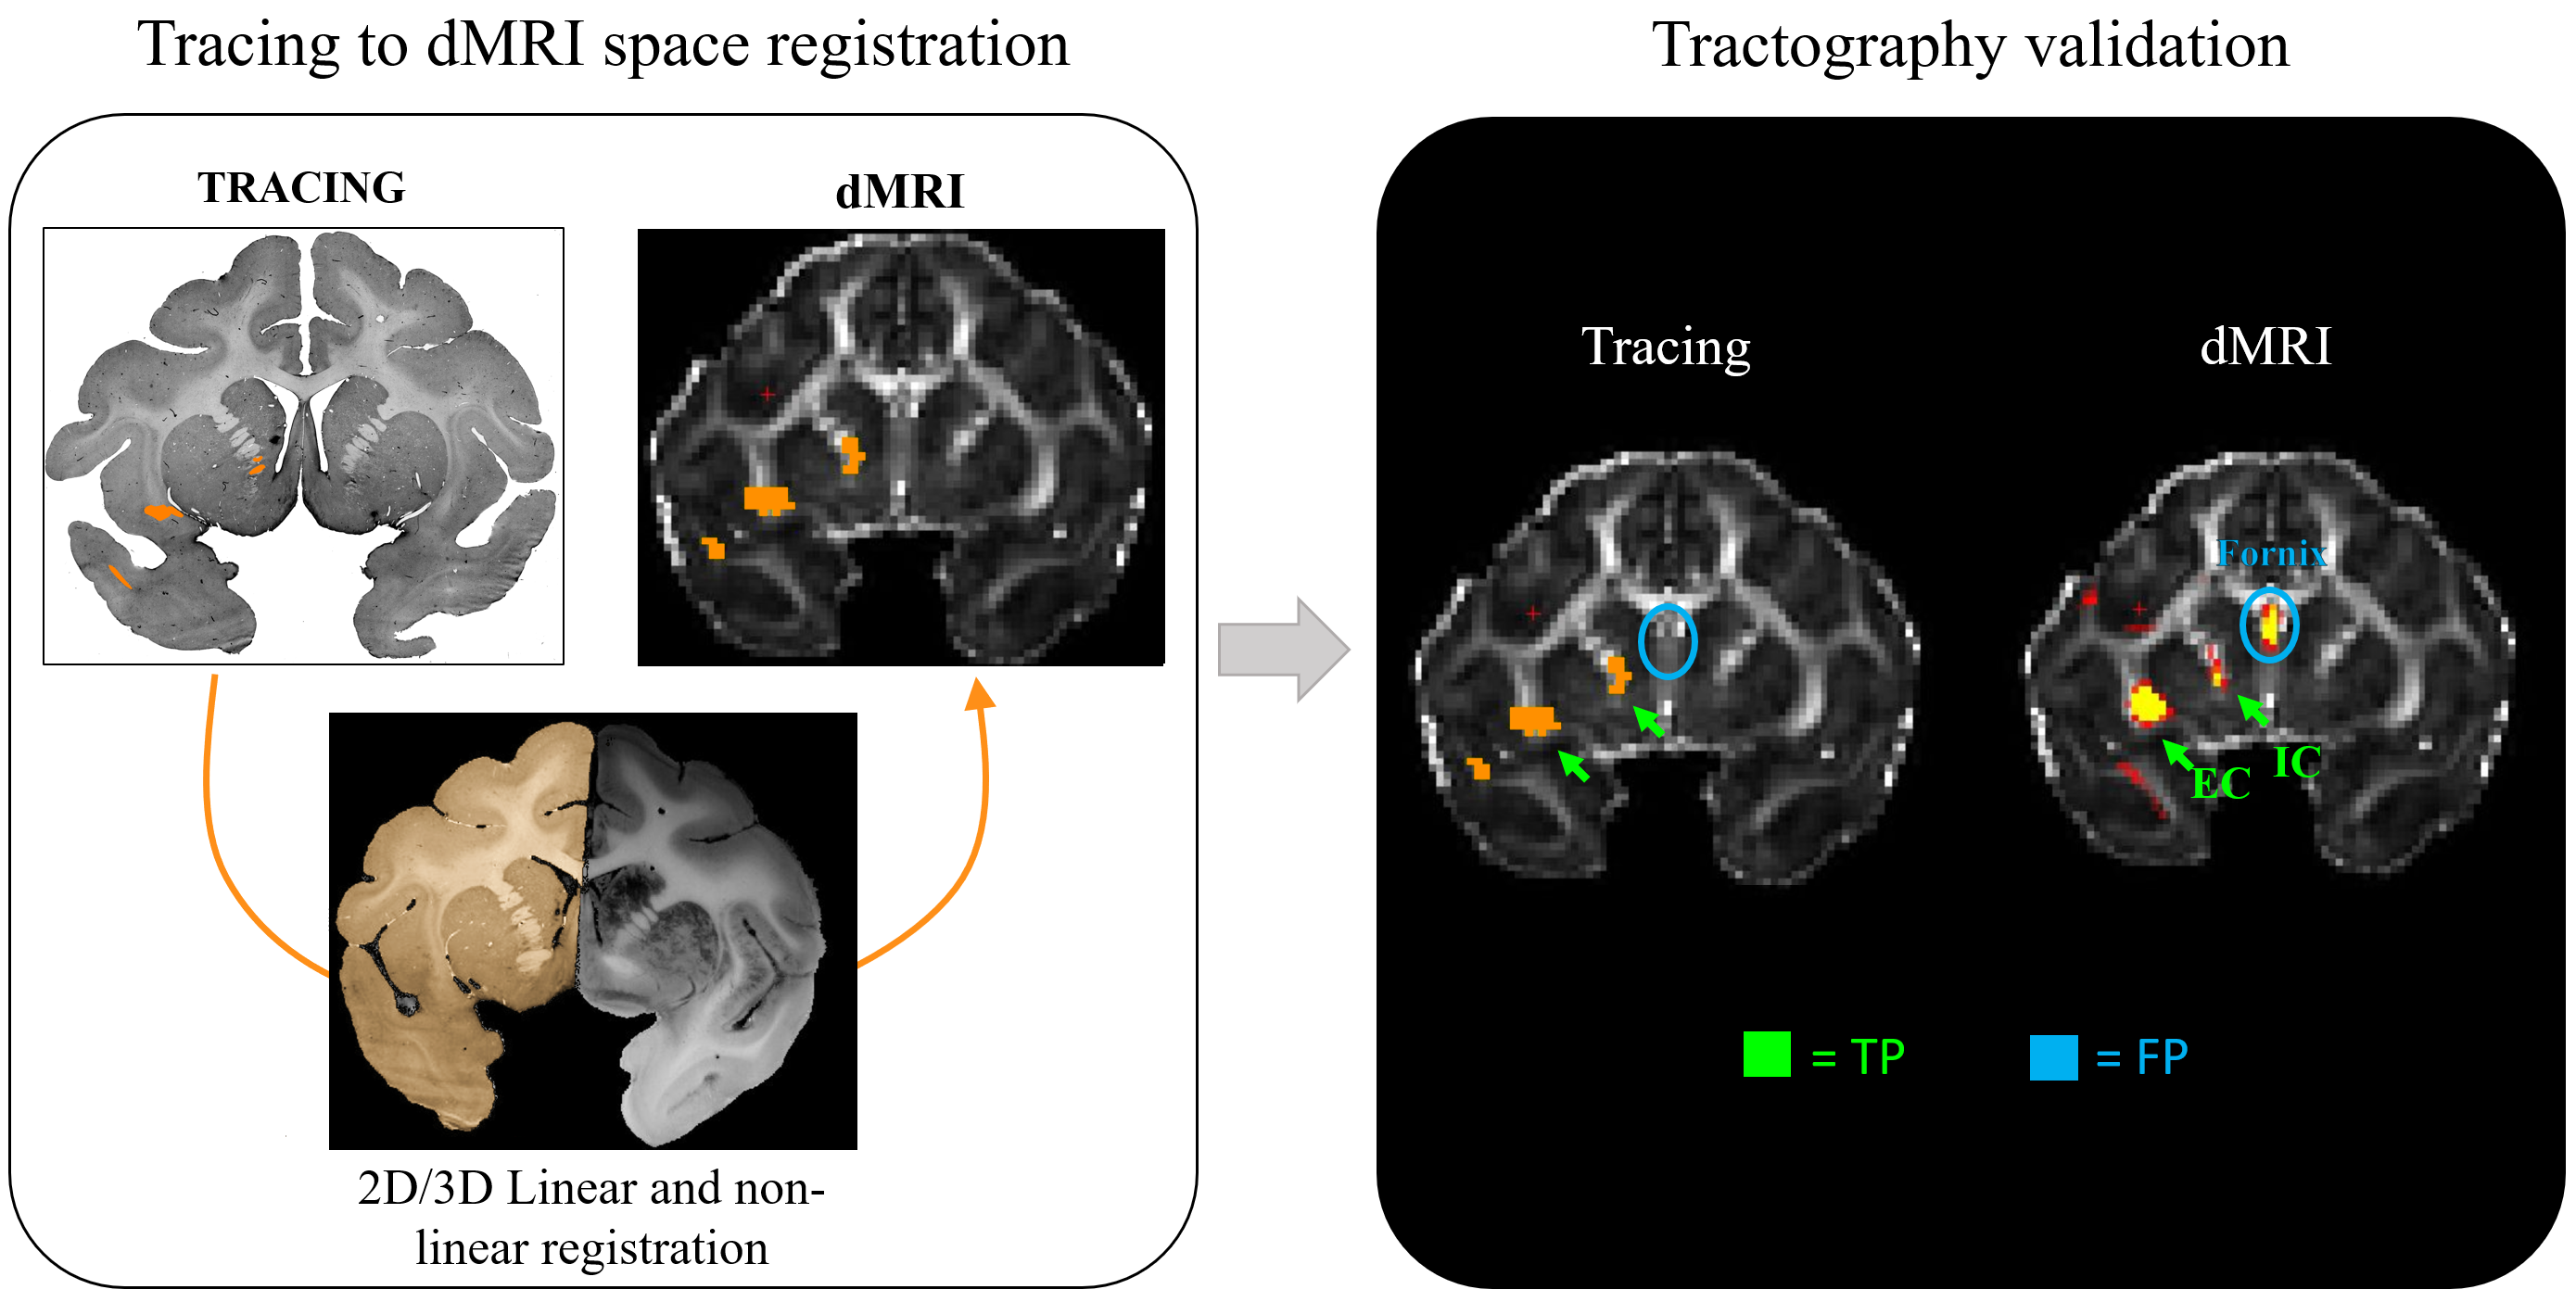
Monkey tracing: An adult macaque was injected with Lucifer yellow in BA10. Following perfusion, the brain was imaged ex-vivo in a 4.7T MRI system with maximum gradient=480mT/m. dMRI data was collected using a 2-shot EPI sequence with δ=15ms, Δ=19ms, 515 directions, 0.7mm resolution and bmax=40000s/mm2. The brain was sectioned and stained to visualize the tracer. Axon bundles were manually traced with Neurolucida software, assembled across sections into a 3D model, and aligned to the dMRI data using a combination of linear10 and non-linear transformations11 (Figure 1-2). We used the same protocol to scan twelve macaque brains.
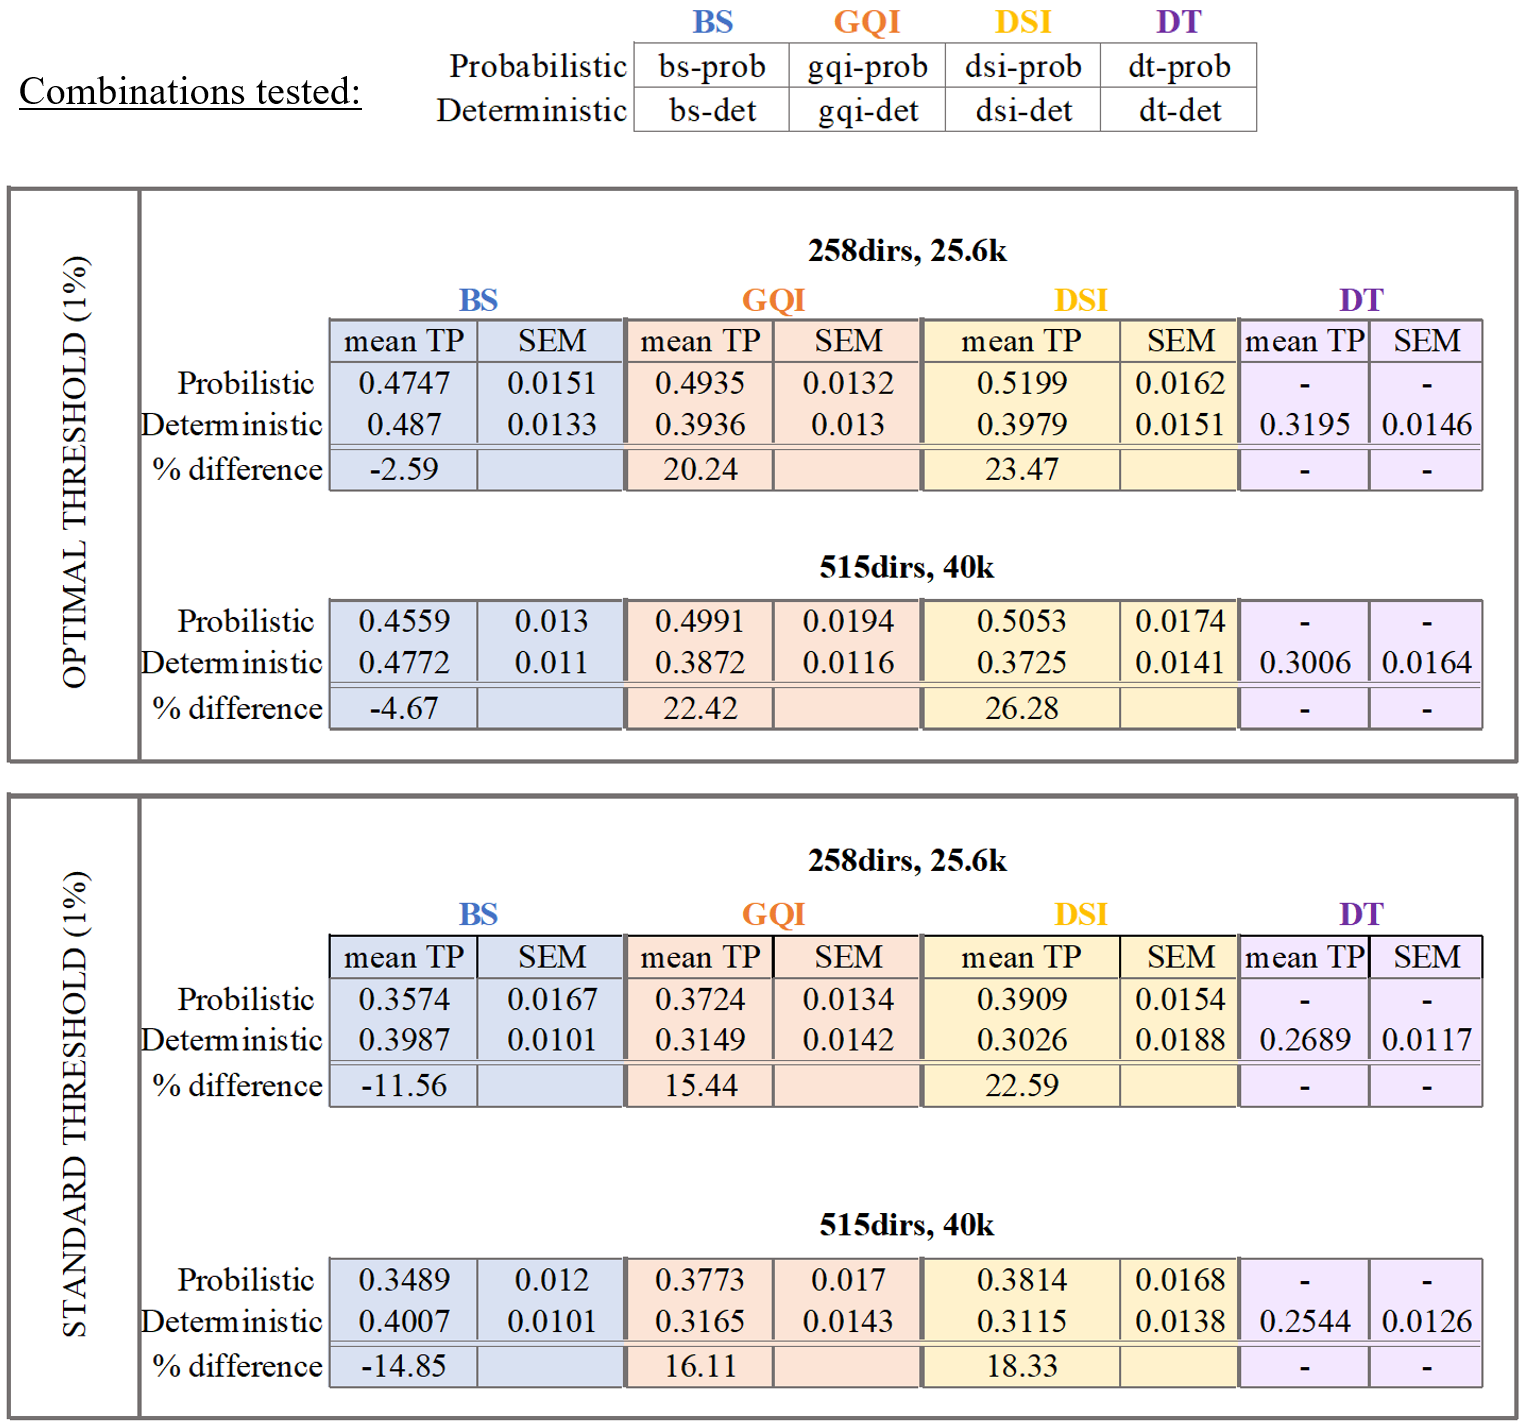
dMRI data analysis: Analyses were performed on the original dMRI dataset of each monkey, and on a reduced dataset with 258 directions and bmax=25600s/mm2. We fit four models to each dataset: diffusion tensor (DT)12 , ball-and-stick (BS)13, generalized q-sampling imaging (GQI)14 and diffusion spectrum imaging (DSI)15. We then performed deterministic and probabilistic tractography in DSI studio and FSL, respectively, using the injection site as seed. A voxel reached by both the dMRI tractography and the tracer was deemed a true positive (TP); one reached only by tractography was deemed a false positive (FP). The combinations of tractography algorithm and model tested are listed in Table 1.
Results
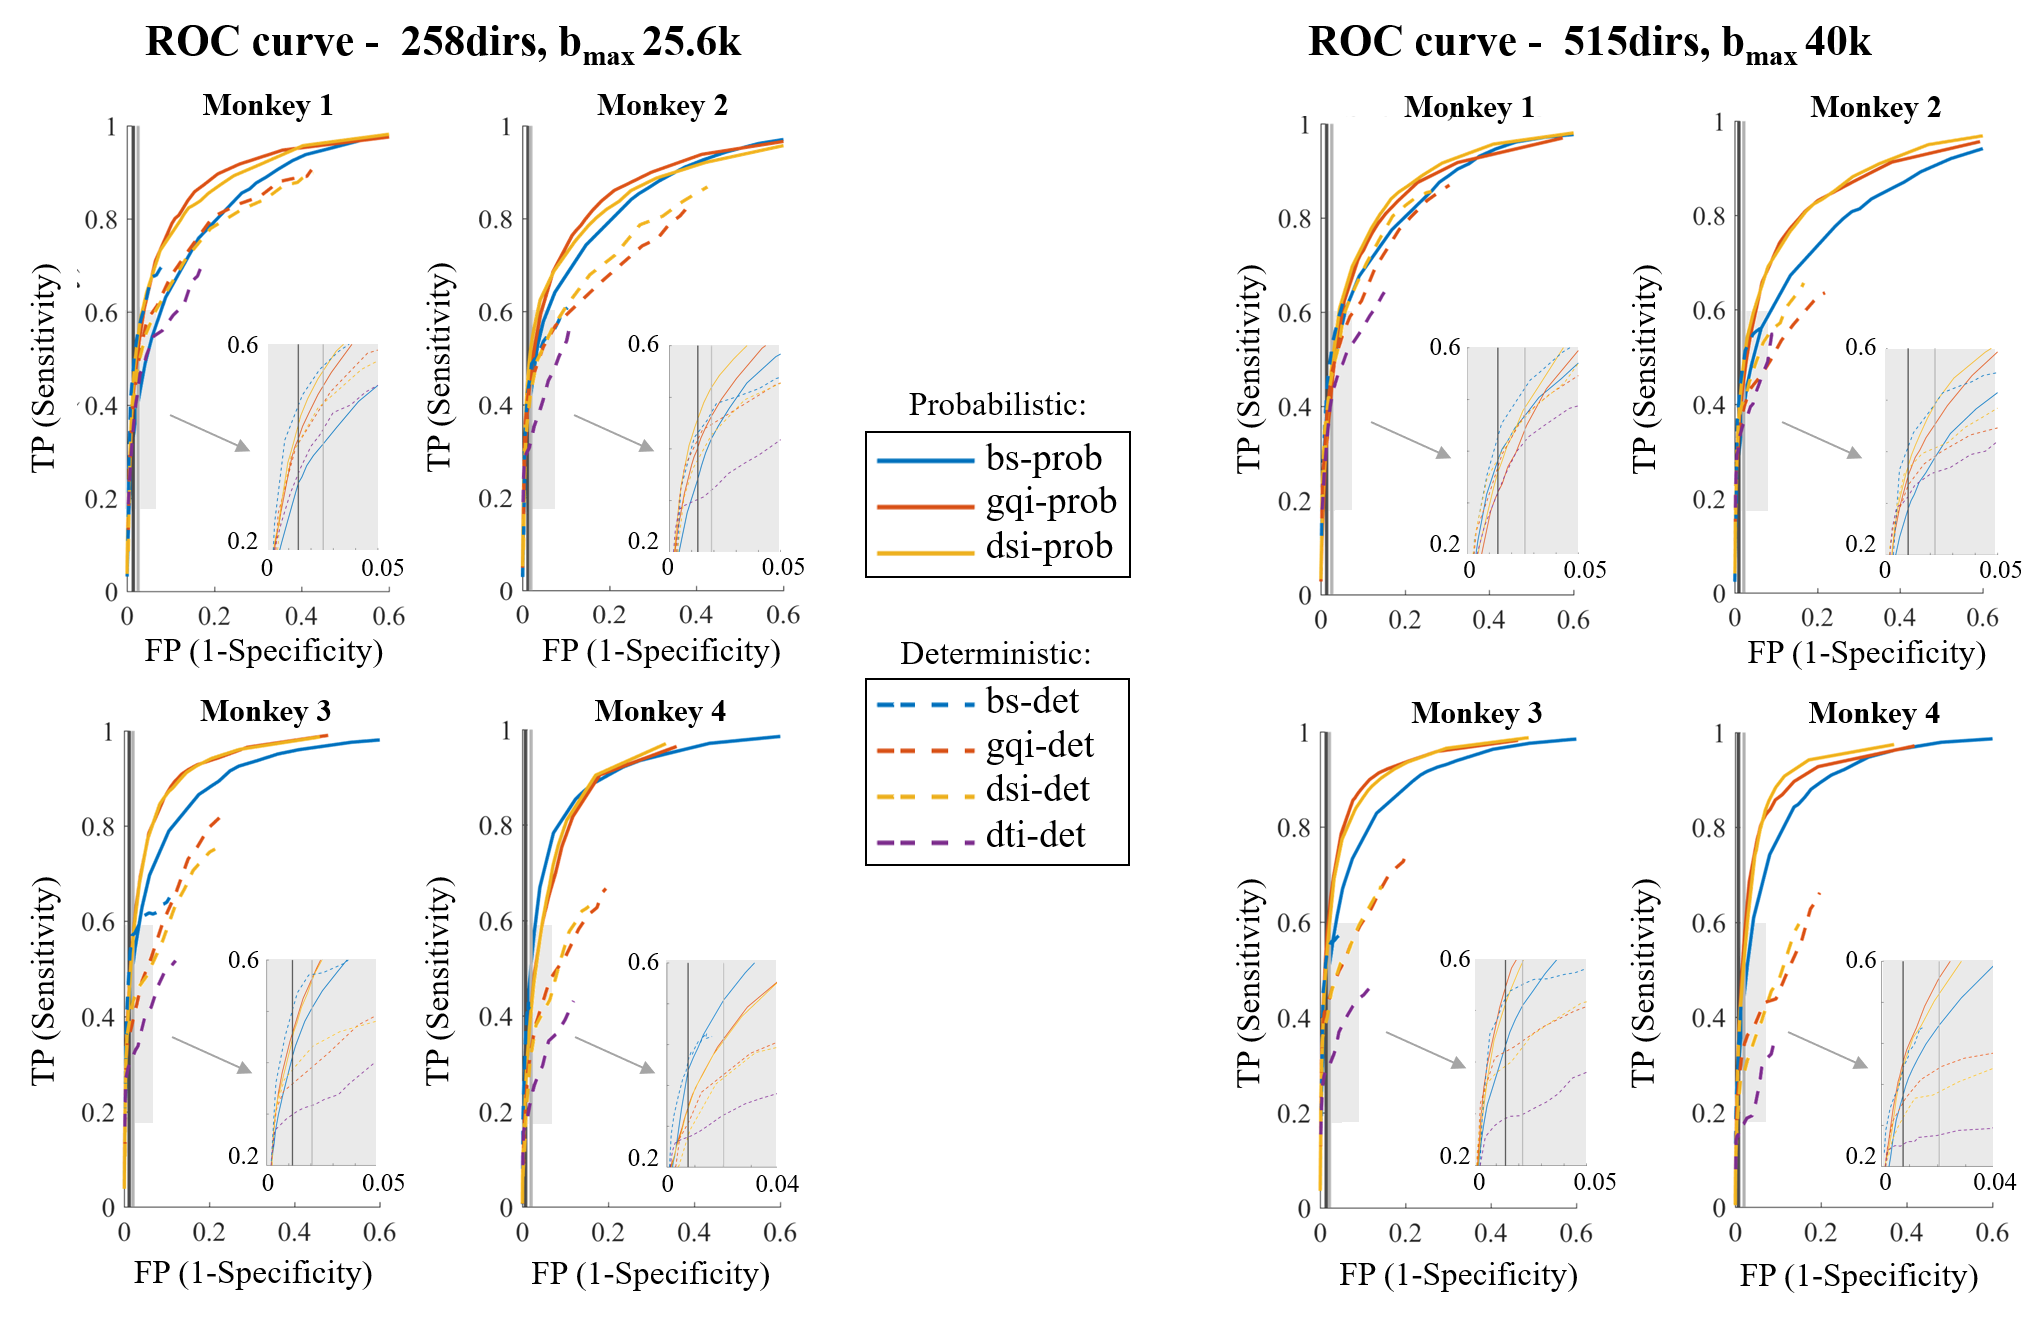
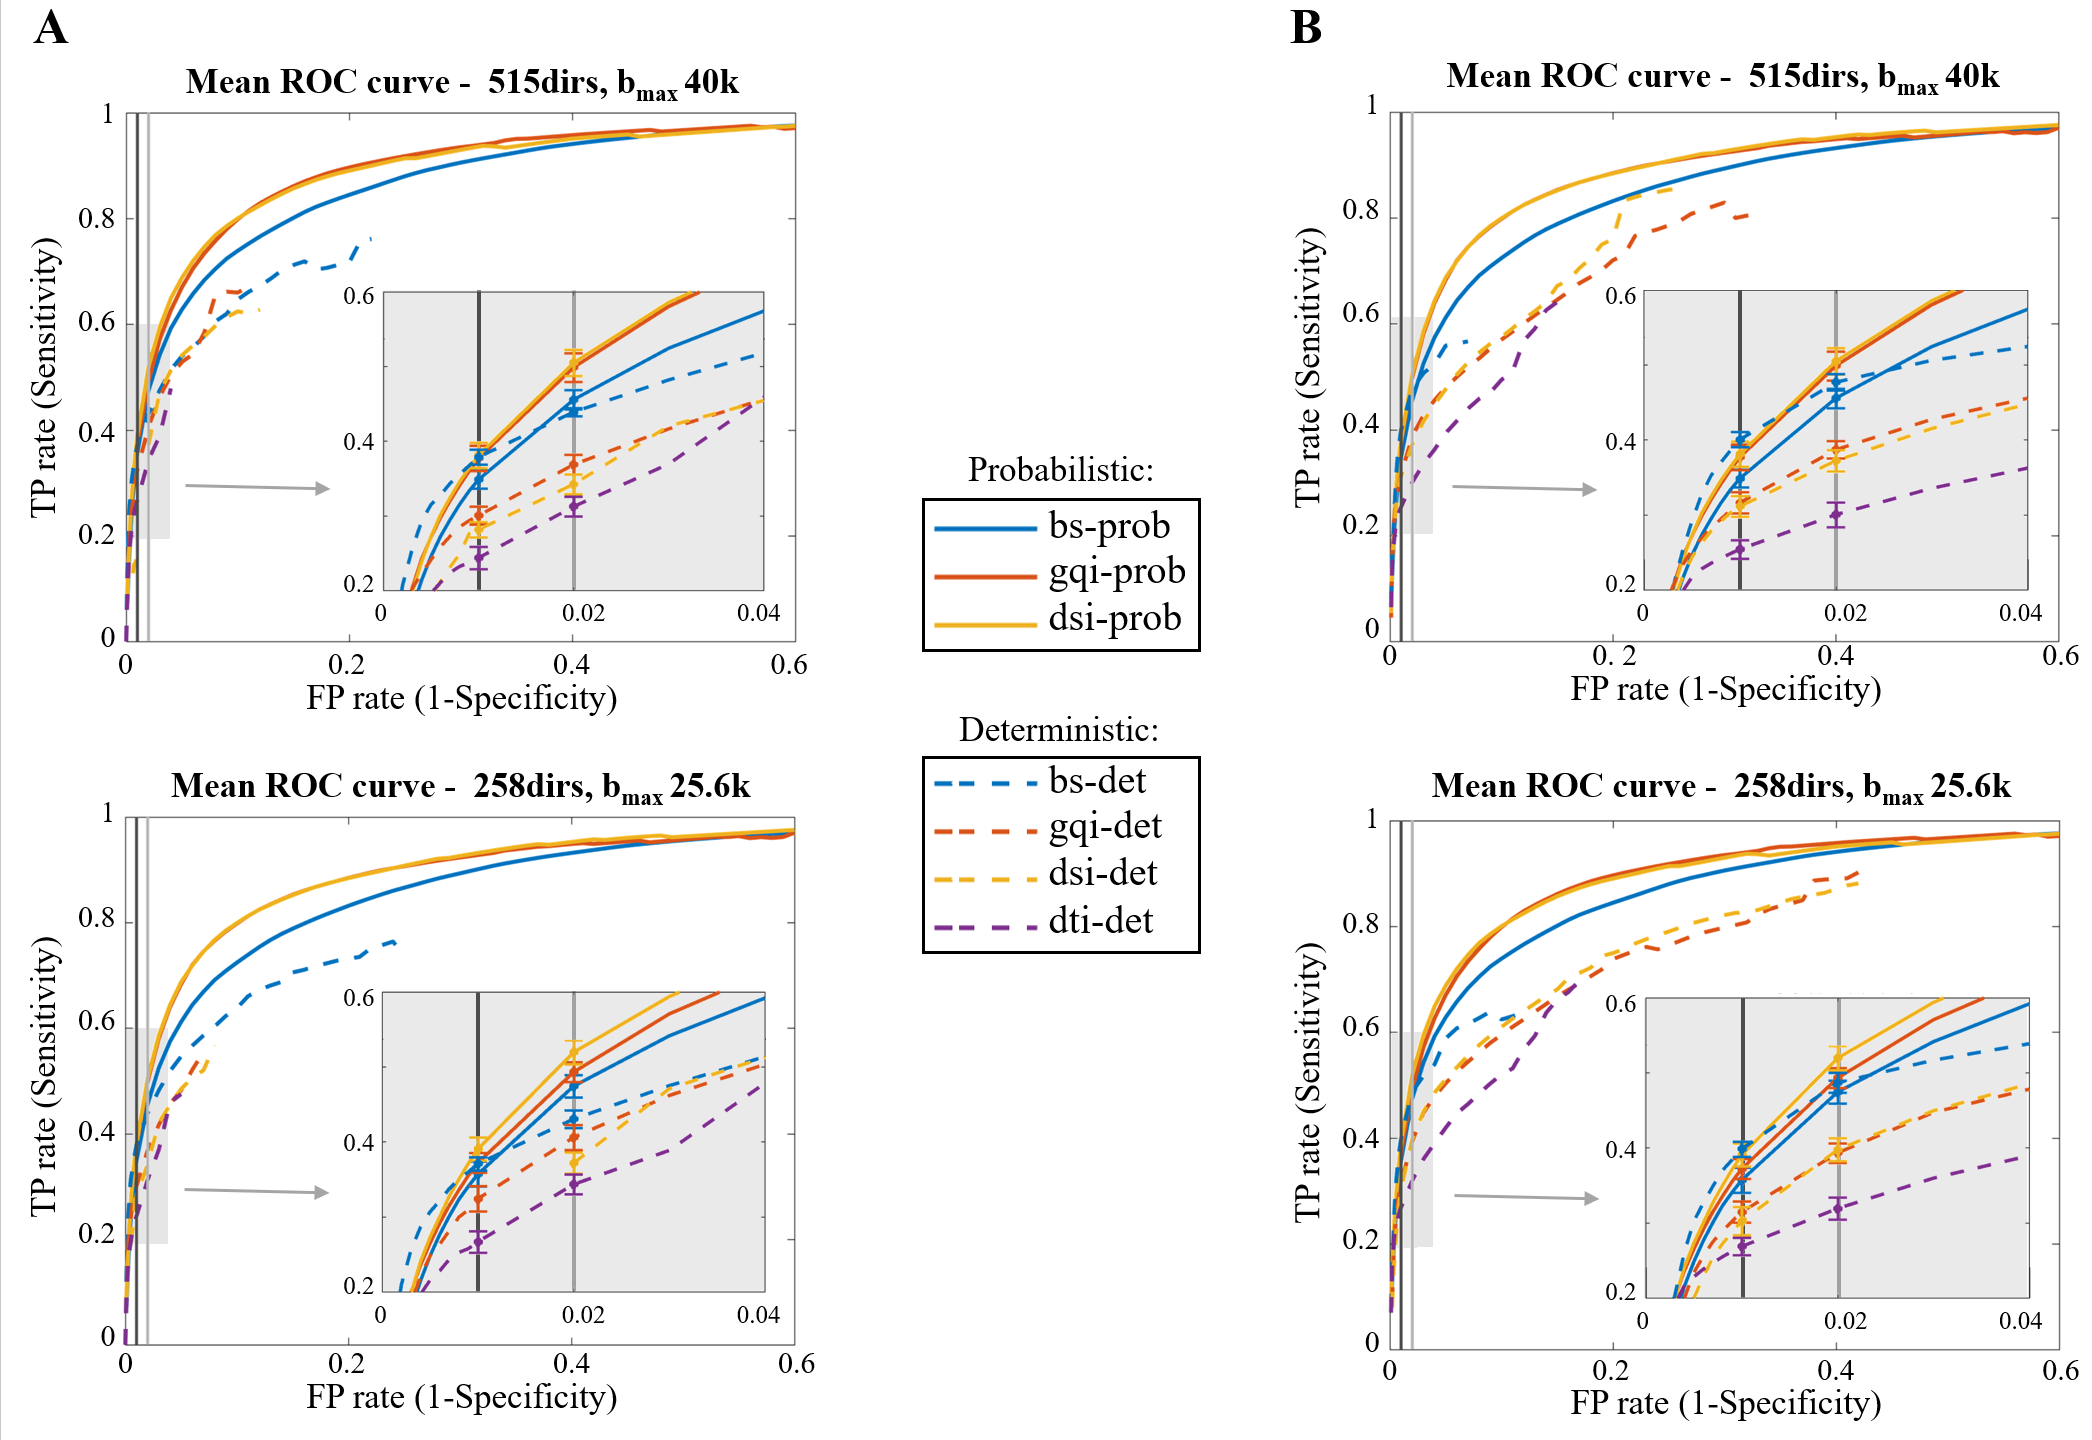
We evaluated accuracy on each dataset by computing the fraction of voxels reached by tractography that are present and absent in the chemical tracings (TP and FP rate, respectively) and producing receiver-operating characteristic (ROC) curves for each diffusion model and tractography algorithm combination (Fig. 3 and 4). We obtained different points on the ROC curve by varying the threshold for probabilistic tractography, and the maximum bending angle or minimum fractional anisotropy (FA) for deterministic tractography. On both figures, we highlight the operating points corresponding to two thresholds of the BS probabilistic maps: the commonly used 1% (standard; ST) and a manually selected threshold for visualizing all bundles that exist in the tracing data (optimal; OP).Discussion
Our findings show that probabilistic tractography generally outperformed deterministic (Fig. 3-4), with GQI and DSI having a 4% and 8% higher TP rate than BS, respectively (Table 1). Interestingly, however, BS performed similarly, and occasionally better, with a deterministic than a probabilistic algorithm, especially at the ST threshold. We found that the bending angle threshold (Fig. 4B) had a more dramatic effect on the accuracy of deterministic tractography than the FA threshold (Fig. 4A). Finally, we saw only minimal improvements in performance when comparing the full and partial dataset (515dirs/bmax40k and 258dirs/bmax25.6k, respectively) for all diffusion models and tractography algorithms tested, which is consistent with results on the BS model from our previous work9.Conclusion
We performed an objective and quantitative evaluation of different dMRI models and tractography algorithms in terms of their accuracy in reconstructing pathways from area BA10. In our comparisons, the combination of probabilistic tractography and GQI or DSI model yielded the best results, especially at the OP threshold. Notably, the OP and ST thresholds are close, suggesting that 1% is a reasonable default choice of threshold, when there is no a priori knowledge on which connections exist. We found only minor improvements in accuracy across all methods between the full and reduced datasets, suggesting that none of these approaches are taking advantage of information contained in very high b-value images. These results are specific to the accuracy in reconstructing frontal pole connections, but our future work will investigate whether they can be generalized to projections of other areas.Acknowledgements
No acknowledgement found.References
1. Thomas, C. et al. Anatomical accuracy of brain connections derived from diffusion MRI tractography is inherently limited. Proc. Natl. Acad. Sci. 111, 16574–16579 (2014).
2. Gao, Y. et al. Validation of DTI tractography-based measures of primary motor area connectivity in the squirrel monkey brain. PLoS One 8, e75065 (2013).
3. Dauguet, J. et al. Comparison of fiber tracts derived from in-vivo DTI tractography with 3D histological neural tract tracer reconstruction on a macaque brain. Neuroimage 37, 530–538 (2007).
4. Jbabdi, S., Lehman, J. F., Haber, S. N. & Behrens, T. E. Human and monkey ventral prefrontal fibers use the same organizational principles to reach their targets: tracing versus tractography. J. Neurosci. 33, 3190–201 (2013).
5. Schmahmann, J. D. et al. Association fibre pathways of the brain: Parallel observations from diffusion spectrum imaging and autoradiography. Brain 130, 630–653 (2007).
6. Hagmann, P., Gigandet, X. & Meuli, R. Quantitative validation of MR tractography using the CoCoMac database. Proc Intl Soc Mag Reson Med 16, (2008).
7. van den Heuvel, M. P. et al. Comparison of diffusion tractography and tract-tracing measures of connectivity strength in rhesus macaque connectome. Hum. Brain Mapp. 36, 3064–3075 (2015).
8. Donahue, C. J. et al. Using Diffusion Tractography to Predict Cortical Connection Strength and Distance: A Quantitative Comparison with Tracers in the Monkey. J. Neurosci. 36, 6758–70 (2016).
9. Grisot, G., Safadi, Z., Lehman, J. F., Haber, S. N. & Yendiki, A. Optimization of acquisition parameters for diffusion MRI using chemical tracing. in International Society for Magnetic Resonance in Medicine (ISMRM) (2016). at <http://indexsmart.mirasmart.com/ISMRM2016/PDFfiles/2035.html>
10. Reuter, M., Rosas, H. D. & Fischl, B. Highly accurate inverse consistent registration: a robust approach. Neuroimage 53, 1181–96 (2010).
11. Avants, B. B., Epstein, C. L., Grossman, M. & Gee, J. C. Symmetric diffeomorphic image registration with cross-correlation: Evaluating automated labeling of elderly and neurodegenerative brain. Med. Image Anal. 12, 26–41 (2008).
12. Basser, P. J., Mattiello, J. & LeBihan, D. Estimation of the effective self-diffusion tensor from the NMR spin echo. J. Magn. Reson. B 103, 247–54 (1994).
13. Behrens, T. E. J., Berg, H. J., Jbabdi, S., Rushworth, M. F. S. & Woolrich, M. W. Probabilistic diffusion tractography with multiple fibre orientations: What can we gain? Neuroimage 34, 144–155 (2007).
14. Schmahmann, J. D. et al. Association fibre pathways of the brain: parallel observations from diffusion spectrum imaging and autoradiography. Brain 130, 630–653 (2007).
15. Wedeen, V. J., Hagmann, P., Tseng, W.-Y. I., Reese, T. G. & Weisskoff, R. M. Mapping complex tissue architecture with diffusion spectrum magnetic resonance imaging. Magn. Reson. Med. 54, 1377–1386 (2005).
Figures