0733
SYNCHROTRON X-RAY PHASE-CONTRAST IMAGING TO SIMULATE DIFFUSION TENSOR MRI: APPLICATION TO TRACTOGRAPHY1CREATIS UMR 5220, U1206, University of Lyon, Lyon, France, 2Institut Pascal UMR 6602, Université Clermont Auvergne, Le Puy en Velay, France, 3Laboratoire CarMeN, University of Lyon, Lyon, France, 4Lyon Neuroscience Research Center, Lyon, France, 5LARIS, UMR INRA IRHS, Université d'Angers, Angers, France
Synopsis
As it provides the only method for mapping neural tracts in vivo, diffusion MRI tractography is gaining importance in clinical and neuroscience research. However, the precision of tractography results is influenced by many factors. In this study, we propose a highly realistic simulator based on real data acquired by synchrotron x-ray phase-contrast imaging. This imaging technique with histology-like resolution is demonstrated to reveal adequately the mouse brain in 3D by comparison with classical histology, which loses continuity along the sectioning axis. We expect that our simulator may serve as a tool for the validation and optimization of tractography algorithms.
INTRODUCTION
Diffusion
tensor imaging (DTI) is a powerful tool for investigating structural
properties of brain in vivo. Tractography is a 3D modelling technique
to infer neural tracts using
DTI data. However, the precision of
tractography results are influenced by many factors: image quality,
choice of tracking algorithms and parameters. To date, various
strategies were applied to validate tractography: MRI neural tracers
1,2, dissection
3,4 or
histology in post-mortem tissue 5,6,
physical phantoms 7,8 or
simulations 9,10.
The latter gains in importance since simulation allows for a direct
comparison of tracking results on simulated data with the ground
truth. Yet, current simulation approaches use a virtual fiber
environnement. In this study, we propose a simulator based on real
data acquired by synchrotron x-ray phase-contrast imaging (SPCI).
This imaging technique with histology-like resolution is demonstrated
to reveal adequately the mouse brain in 3D by comparison with
classical histology.METHODS
Synchrotron x-ray experiments: We imaged 8 post-mortem mouse brains on beamline ID19 at the European Synchrotron Radiation Facility in Grenoble, France. The experimental SPCI acquisition setup was described in detail in 11. It produced for the whole mouse brain a 3D volume of 2048x2048x2000 isotropic voxels of 8 μm. Such a volume encoded on 32 bits occupied 26 GB of memory.
Histology: We used the histological data from the Mouse Brain Architecture project 12. They correspond to 100 myelin stained coronal sections of 20 μm thick with an in-plane resolution of 6 μm and 1400x800 pixels. Adjacent 2D sections were aligned using a local rigid registration method to form an estimation of the 3D volume.
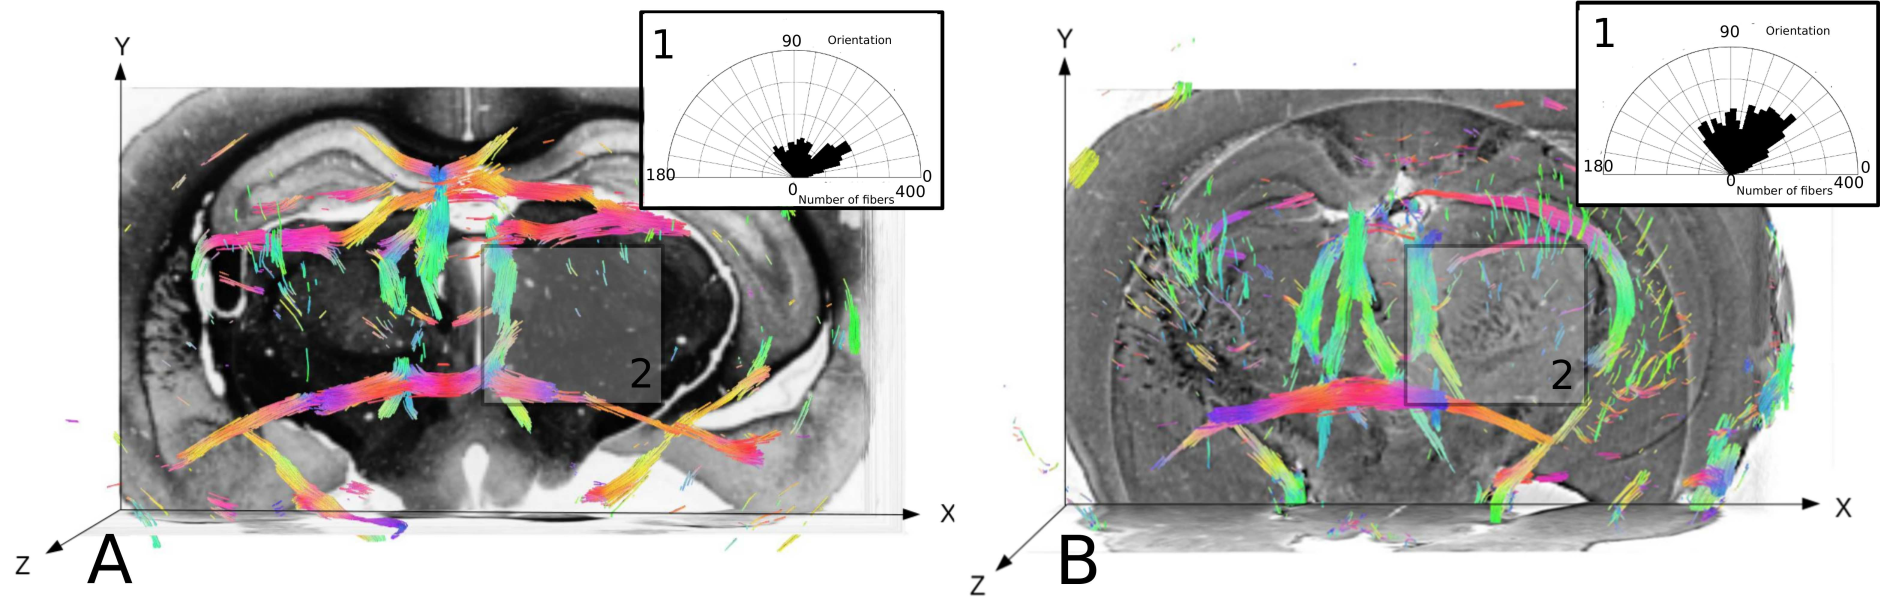
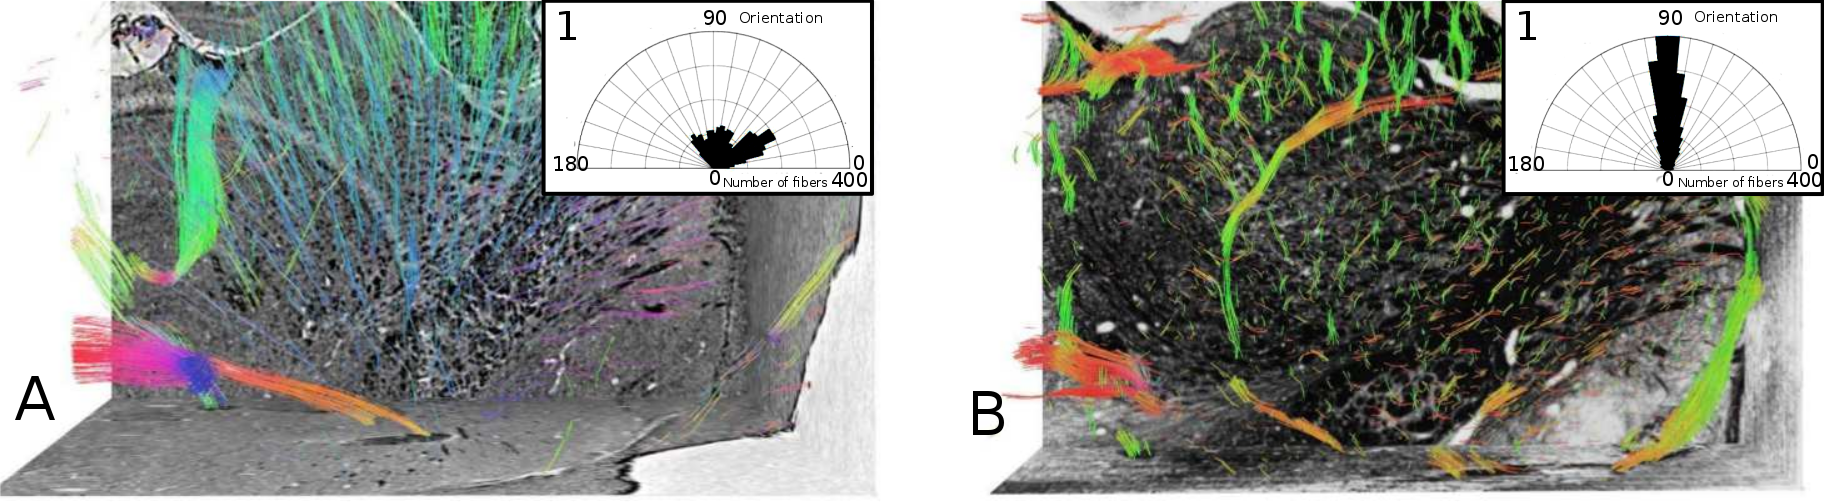
Data analysis: Local fiber orientation were extracted from the classical histology and SPCI data using multiscale Hessian-based methods 13. It consists of computing a Hessian matrix for each voxel from a local neighbourhood. Hessian is a matrix representation of the data partial derivatives and defines a second order symmetric positive tensor. This tensor is then diagonalized and the primary fiber orientation corresponds to the eigenvector associated with the largest magnitude eigenvalue. To analyse the continuity of biological structures in datasets from SPCI and classical histology, we studied specifically the angle between the primary fiber orientation and the rostro-caudal axis (z axis on Fig. 1 and 2).
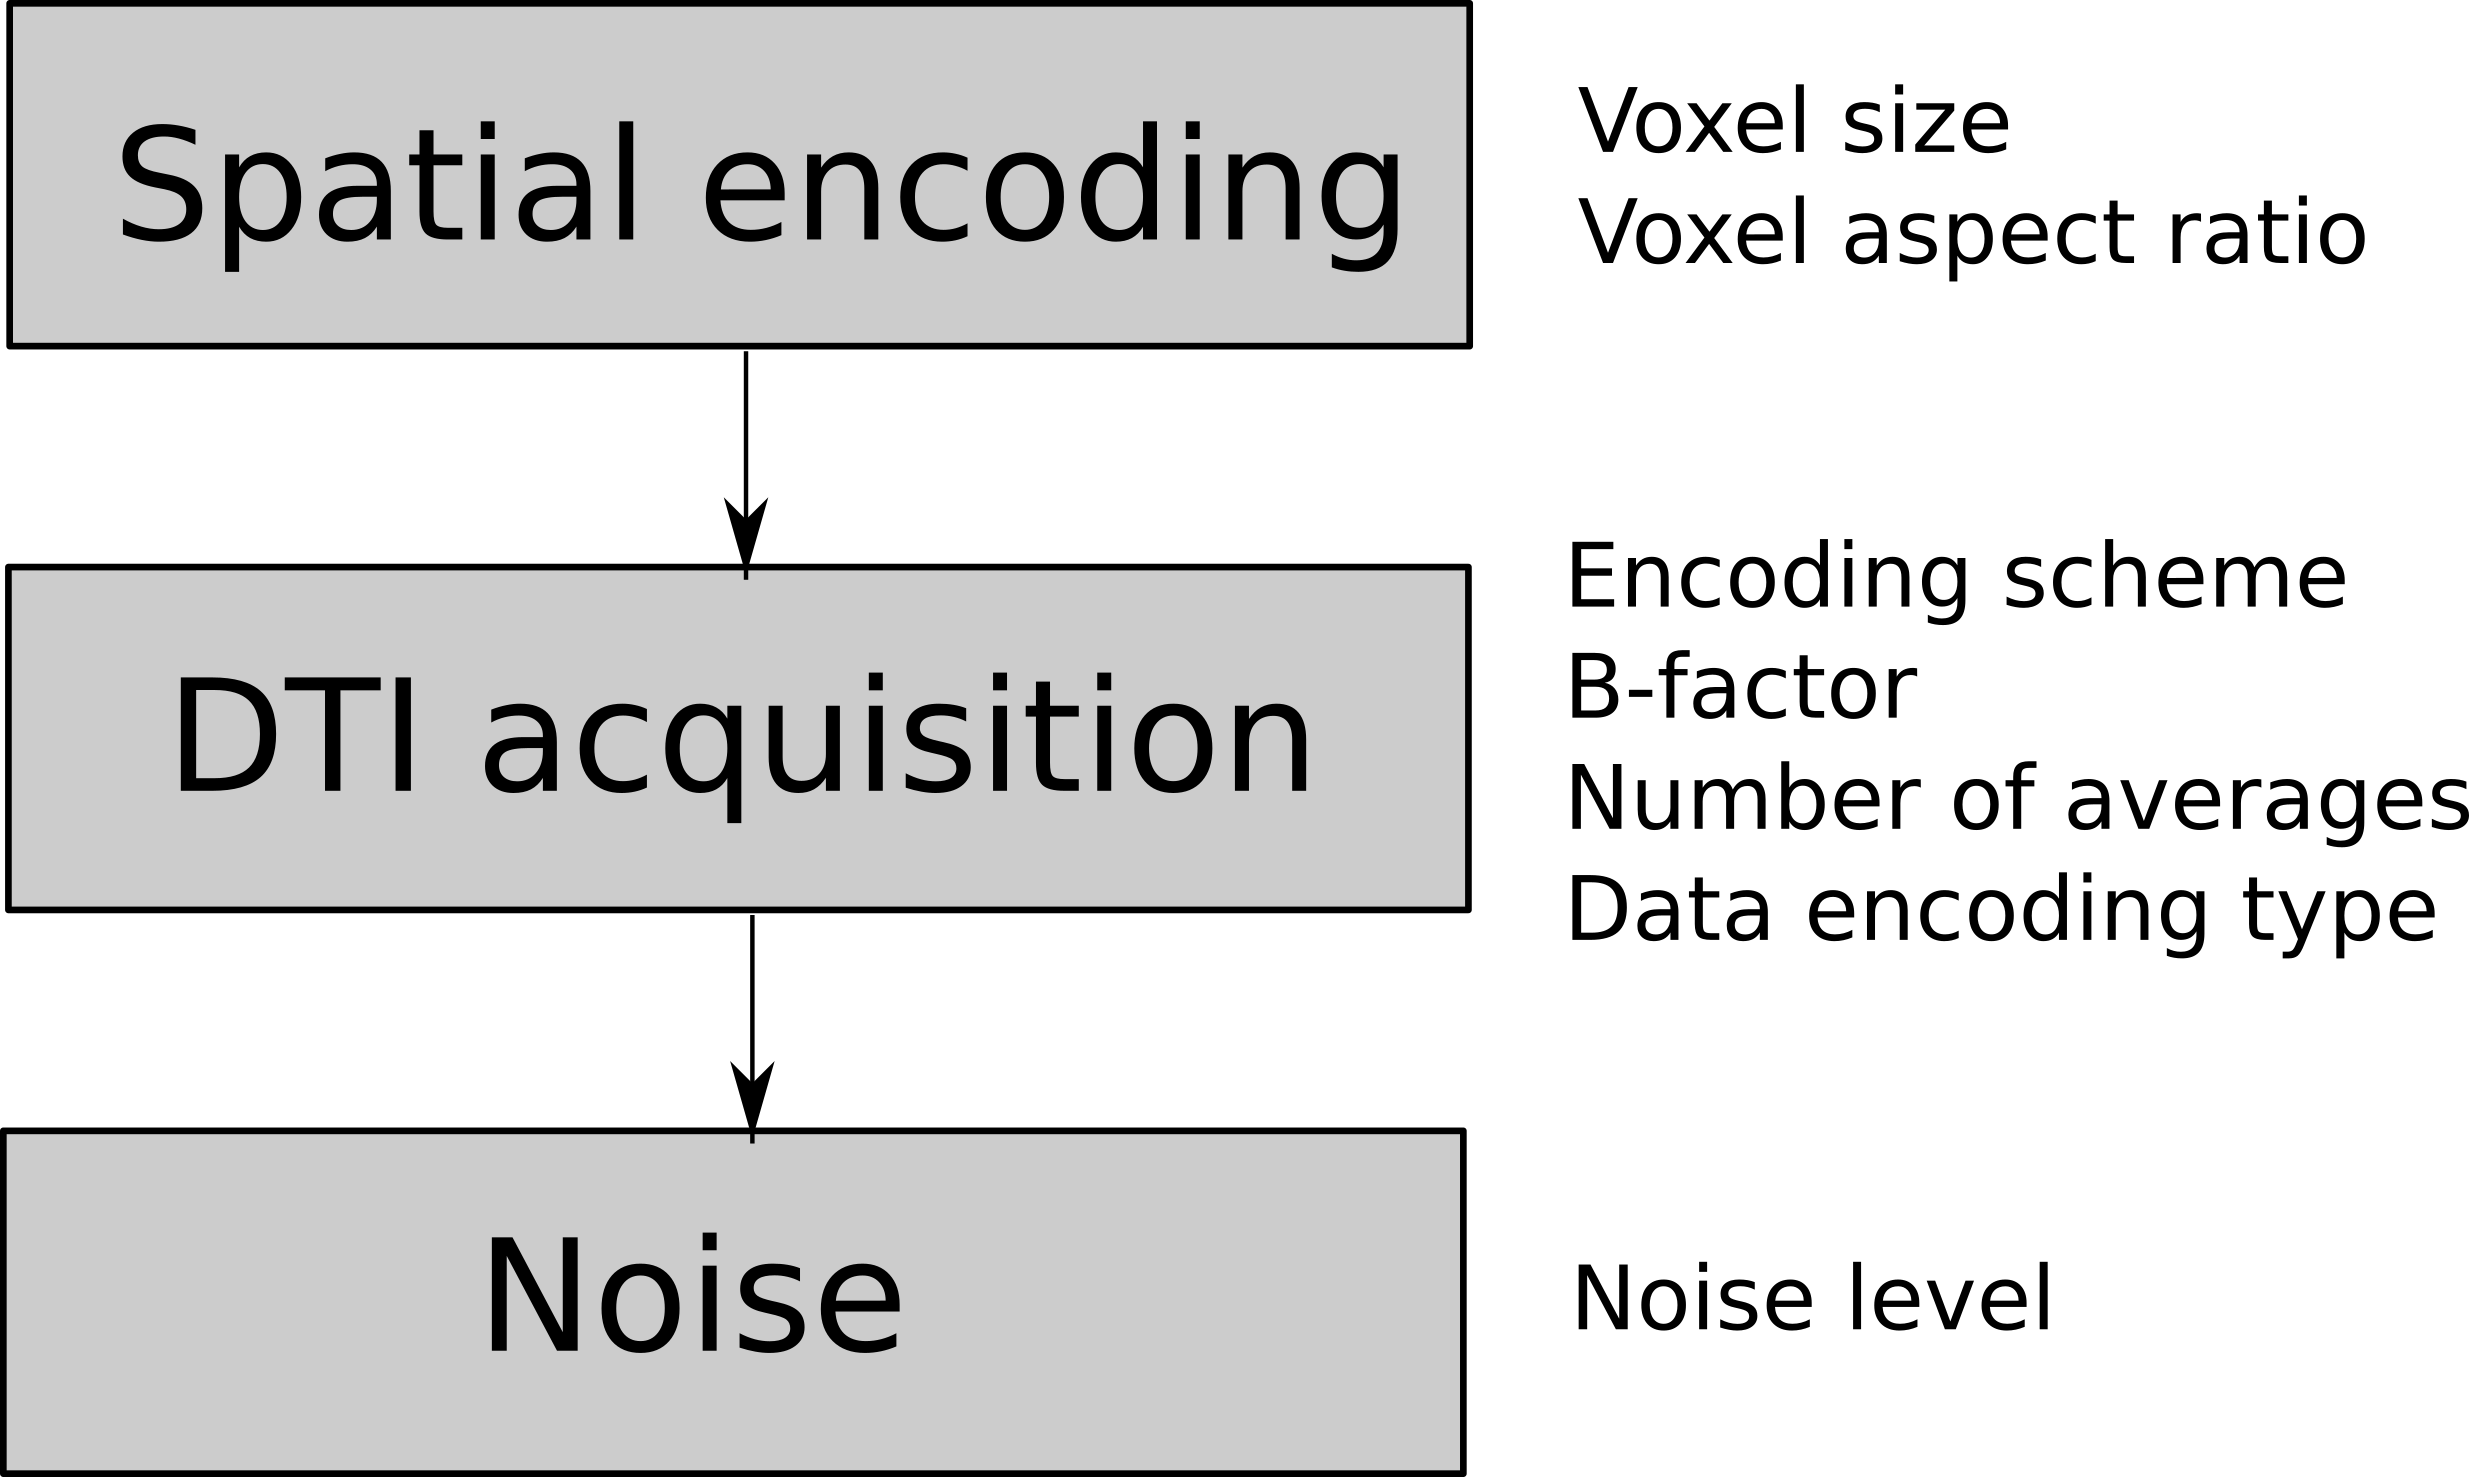
Simulation: The tensors extracted from the SPCI data are the model of diffusion tensor used for simulation. We developed a simulation system that is flexible enough to synthesize DTI datasets from a variety of MRI acquisition setups. To do so, seven technical parameters were considered (Fig. 3). First, spatial encoding is defined from voxel size and voxel aspect ratio, where each subvolume contains a subset of tensors from the SPCI data. These tensors are averaged by an appropriate method 14 to produce tensor fields at a specific scale. Then, DTI acquisition as described by Stejskal-Tanner equation is parametrized by encoding scheme, b-factor, number of averages and data encoding type. This step produces noiseless synthetic images. Finally, random gaussian noise is added to the noiseless synthetic images to simulate ideal MRI noise.
RESULTS AND DISCUSSION
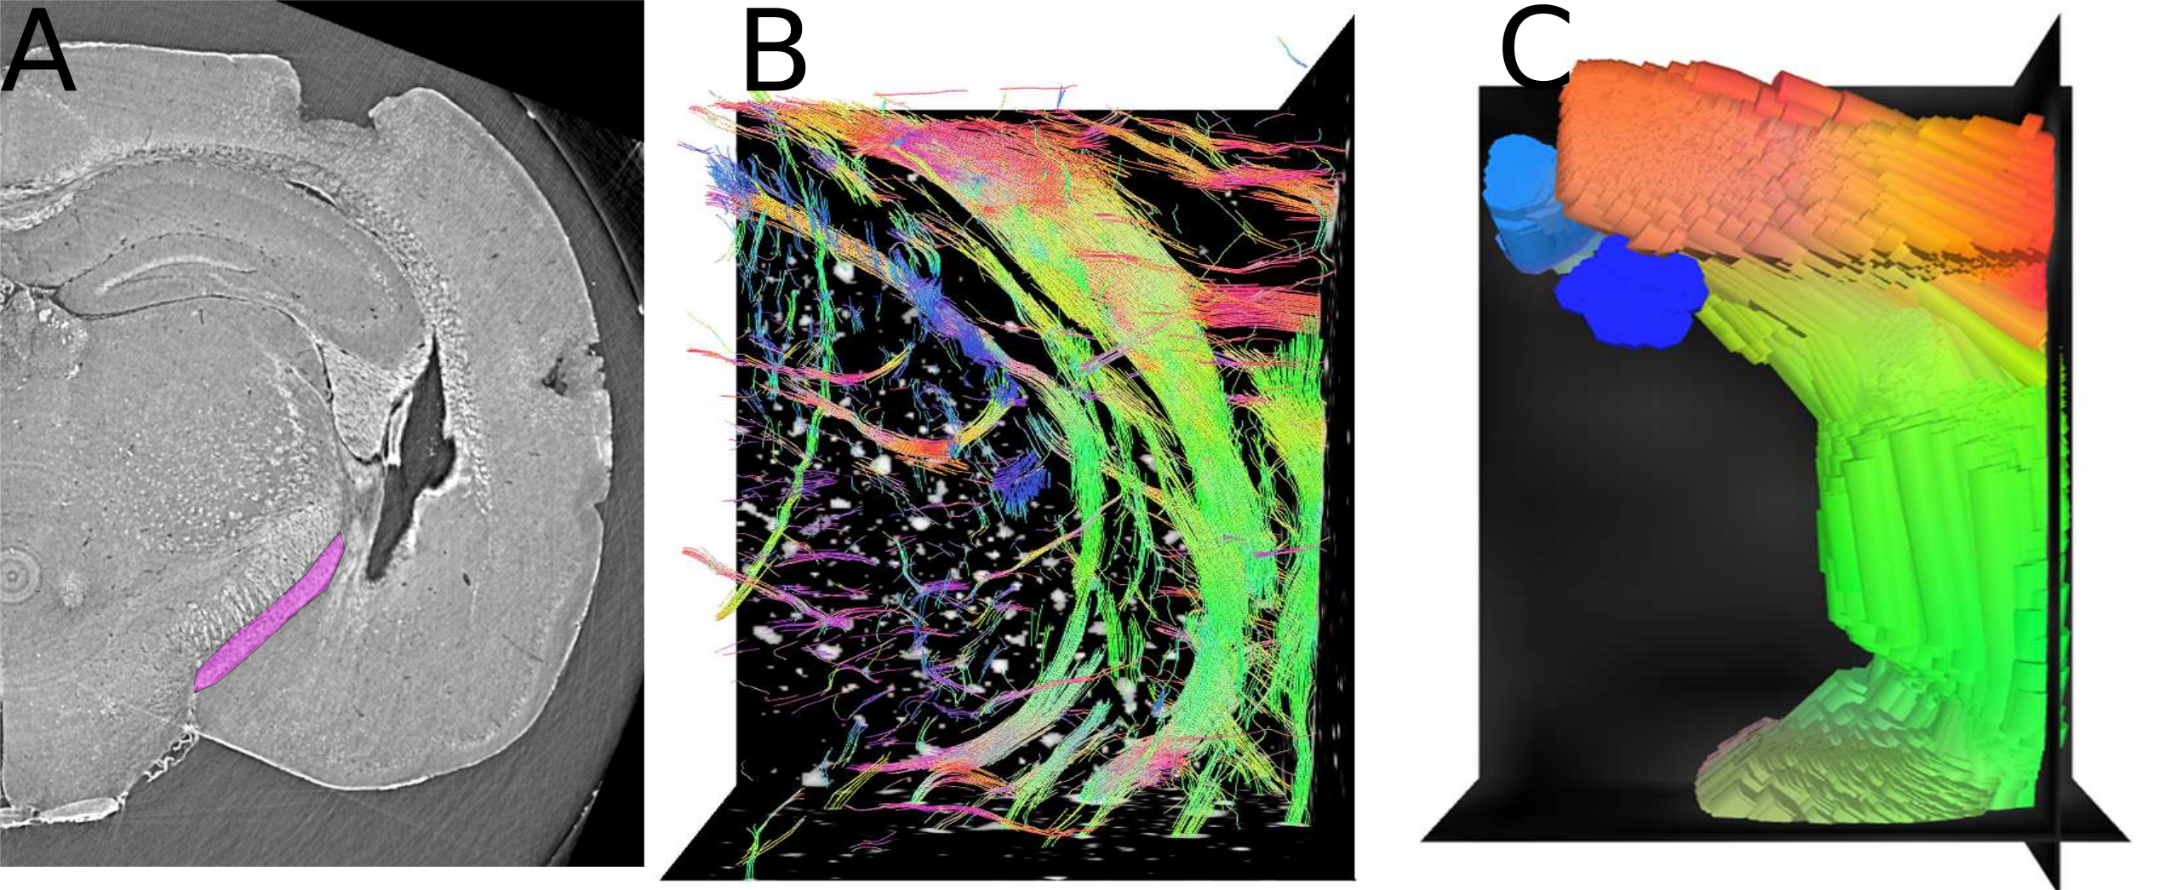
We investigated classical histology and SPCI at two different scales. At coarse scale, data represented the whole mouse brain and were down-sampled 4 times to let only appear big fibrous structures: classical histology and SPCI produced the same results (Fig 1). At fine scale, data represented only the caudate putamen and were at full resolution: classical histology produced a fiber angle distribution indicating only fibers in x-y plane (Fig 2, B: orientation=90°) and hence was not able to follow tiny structures along z-axis despite registration. This fact can be explained by tissue sectioning that lead to sample distortion and hence loss of continuity in structures. Note that this is not the case of SPCI which therefore appear as an effective 3D histology. Finally, we performed two types of simulations from SPCI data: one at cellular scale (Fig 4, B) and one at macroscopic scale (Fig 4, C). These results illustrate the simulator flexibility and demonstrate its ability to simulate different architectures and scales of neural fibers.CONCLUSION
This work compared classical histology to SPCI and demonstrated the huge potential of this latter as a 3D histology able to track tiny structures of various orientations without loss of continuity. On the basis of SPCI data, we proposed a novel DTI simulator that has a general and flexible framework, enabling to assess the abilities and limitations of a large range of acquisition setups. We expect that this simulator may serve as a tool for the validation and optimization of tractography algorithms.Acknowledgements
This work was performed within the framework of the LABEX PRIMES (ANR-11-LABX-0063) of Université de Lyon, within the program "Investissements d’Avenir" (ANR-11-IDEX-0007) conducted by the French National Research Agency (ANR). This work was supported by the European Synchrotron Research Facility (ESRF, project MD-499) through the allocation of beam time.References
1. Dauguet J. et al. Comparison of fiber tracts derived from in-vivo DTI tractography with 3D histological neural tract tracer reconstruction on a macaque brain. Neuroimage 2007;37(2):530-538.
2. Jbabdi S et al. Human and monkey ventral prefrontal fibers use the same organizational principles to reach their targets: tracing versus tractography. Journal of Neuroscience 2013;33(7):3190-3201.
3. Fernandez-Miranda JC et al. High-definition fiber tractography of the human brain: neuroanatomical validation and neurosurgical applications. Neurosurgery 2012;71(2):430-453.
4. Zemmoura I et al. Fibrascan: a novel method for 3D white matter tract reconstruction in MR space from cadaveric dissection. NeuroImage 2014;103:106-118.
5. Seehaus A et al. Histological validation of high-resolution DTI in human post mortem tissue. Frontiers in neuroanatomy 2015;9:98.
6. Mollink J et al. Evaluating fibre orientation dispersion in white matter: Comparison of diffusion MRI, histology and polarized light imaging. NeuroImage 2017;157:561-574.
7. Pullens P et al. Ground truth hardware phantoms for validation of diffusion-weighted MRI applications. Journal of magnetic resonance imaging 2010;32(2):482-488.
8. Fillard P et al. Quantitative evaluation of 10 tractography algorithms on a realistic diffusion MR phantom. Neuroimage 2011;56:220-234.
9. Neher PF et al. Fiberfox: Facilitating the creation of realistic white matter software phantoms. Magnetic Resonance in Medicine 2014;72(5):1460-1470.
10. Perrone D et al. D-brain: Anatomically accurate simulated diffusion MRI brain data. PloS one 2016;11(3):e0149778.
11. Rositi H et al. Information-based analysis of X-ray in-line phase tomography with application to the detection of iron oxide nanoparticles in the brain. Optics Express 2013;21:27185–96.
12. The Mouse Brain Architecture project, http://mouse.brainarchitecture.org/seriesbrowser/viewer/1631/. Accessed November 8, 2017.
13. Rositi H et al. Computer vision tools to optimize reconstruction parameters in X-ray in-line phase tomography. Physics in medicine and biology 2014;59(24):7767–75.
14. Moakher M. On the averaging of symmetric positive-definite tensors. Journal of Elasticity 2006;82(3):273-296.
Figures