0732
Lower oxygenation in the peripheral subarachnoid space reflects decreased cerebral blood flow in dementia-related brain structures1Radiology, UMC Utrecht, Utrecht, Netherlands, 2UMC Utrecht, Utrecht, Netherlands, 32Danish Research Center for Magnetic Resonance, Center for Functional and Diagnostic Imaging and Research, Copenhagen University Hospital Hvidovre, Hvidovre, Denmark, 4Department of Radiology, MR Research, John Hopkins Medical Center, Baltimore, MD, United States
Synopsis
We evaluated the relationship between cerebral blood flow (CBF) and T2 of peripheral CSF. The rationale behind this hypothesized association is the presumed dependency of T2 on oxygenation. The T2 of CSF was related to CBF and cognition in a group with cognitive decline. In contrast, no relationship was found between the T2 and CBF in a healthy aging cohort suggesting no relation between the T2 of CSF and oxygenation. Further investigation regarding the relation between T2 of CSF and cognition in the healthy aging cohort are ongoing and could shed light on the value of T2 as a biomarker.
Introduction
Disappointing outcomes of clinical trials on patients with Alzheimer’s disease or Mild-Cognitive-Impairment1 (MCI) have recently shifted the focus of dementia research towards younger persons and the earlier stages of cognitive decline, with the goal of discovering early biomarkers, or revealing the pathogenetic mechanisms underlying dementia. Previous work has demonstrated a higher transverse relaxation rate (T2) of CSF in dementia patients compared to healthy controls.2 The pathogenesis behind this difference is not clearly understood, and it remains to be elucidated whether the T2 of CSF can be used as a biomarker for future cognitive decline. We evaluate the relationship between cerebral blood flow (CBF) and T2 of peripheral CSF with the goal of ascertaining the dependence of T2 on cortical oxygenation. This evaluation is based on the knowledge that vascular pathologies and dysfunction play a critical role in cognitive impairment, and the hypothesis that these effects result in reduced CBF and consequently lower oxygenation in the subarachnoidal space. A lower T2 of CSF would, then, be caused by lower oxygenation in the subarachnoidal space due to vascular pathology or decreased CBF. Our work primarily focuses on a cohort of patients with cognitive decline, but is extended to a healthy aging cohort to increase knowledge of the diagnostic value of the T2 of CSF.Methods
For this study, two separate cohorts were investigated. MR imaging (3T) was performed in both cohorts and consisted of 3D-T1-weighted imaging (FOV=232x256x192, voxels=1x1x1mm3, TR/TE=8187/4.5ms), a T2-FLAIR sequence (TR/TI/TE=11000/2800/125ms, voxels=1x1x3mm3), a CSF MRI sequence to obtain atrophy and the T2 (FOV=240x240x161mm3, voxels=3x3x7mm3 0:57min),2 and a pseudocontinuous Arterial Spin Labeling (pCASL) EPI sequence (voxels=3x3x7mm3, FOV=240x119x240mm3, TR/TE4000/14ms, post label delay=1525-2160ms). Subjects included in the first cohort were recruited from an ongoing IRB-approved dementia study.3 A thorough cognitive assessment was performed in this study; verbal word fluency was assessed with the 60 second animal naming task and episodic memory was assessed with immediate and delayed recall. For the second cohort, subjects were recruited from a study evaluating biomarkers for postoperative cognitive decline in healthy, elderly individuals(http://www.biocog.eu/). Pre-operative MRI data of these subjects was used in our analyses. Data of the CSF-MRI and ASL-MRI sequences were processed using IDL6.1. Subject-specific gray matter masks (cognitive decline group) and a standard space mask (healthy aging group) were used to evaluate gray matter CBF. Lastly, CBF in the precuneus and the posterior cingulate was evaluated. Multiple linear regression and correlation analysis was performed with R.7 The multiple regression models included either (regional) CBF as the dependent variable, and peripheral CSF T2 and the degree of atrophy as independent variables. If cognition was the dependent variable, CBF was included as a dependent variable. We expected poorer cognitive performance and a lower CBF to be related to a higher T2.Results
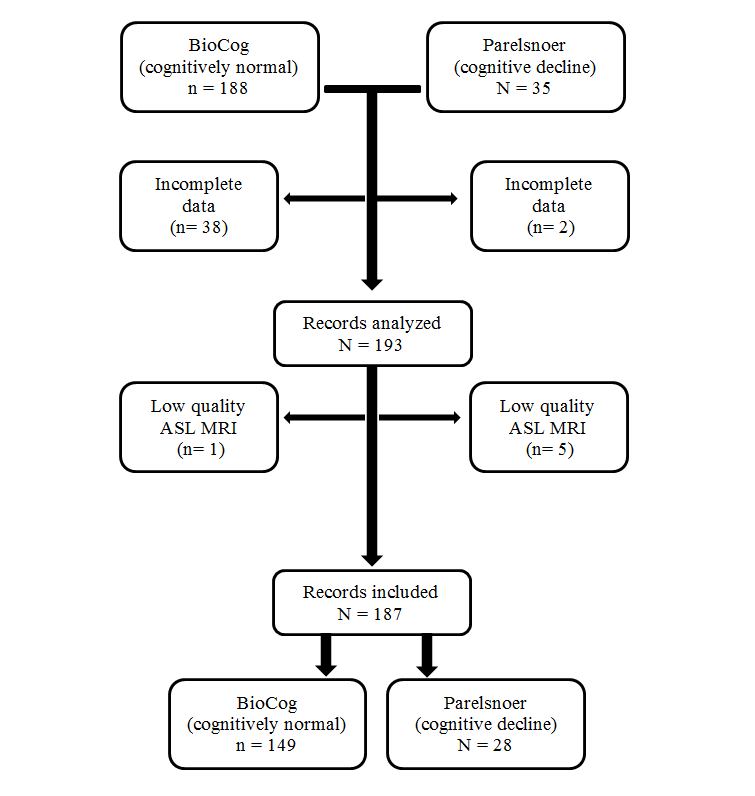
Twenty-eight individuals (75±7 y.o.) were included from the cohort with cognitive decline (CD), and 149 participants (72±5 y.o.) were included from the cohort of cognitively normal, elderly individuals (CN)(Figure 1, Table 1).
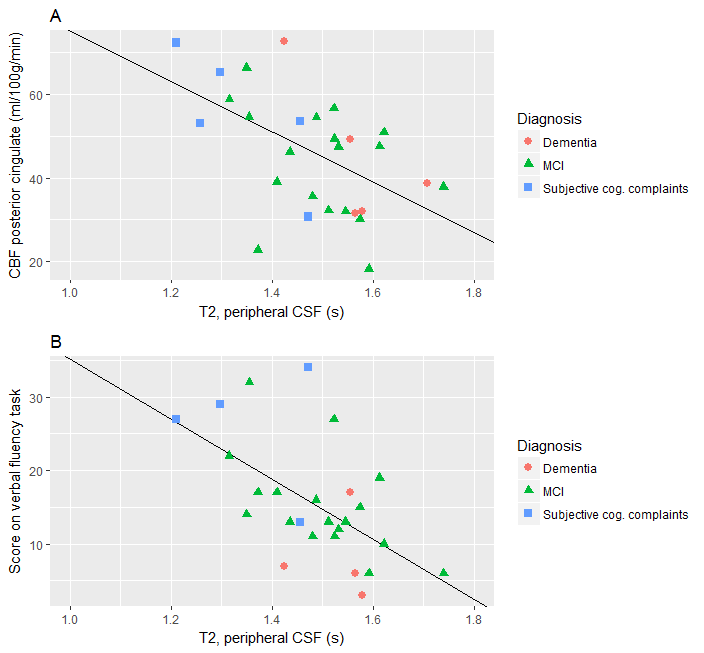
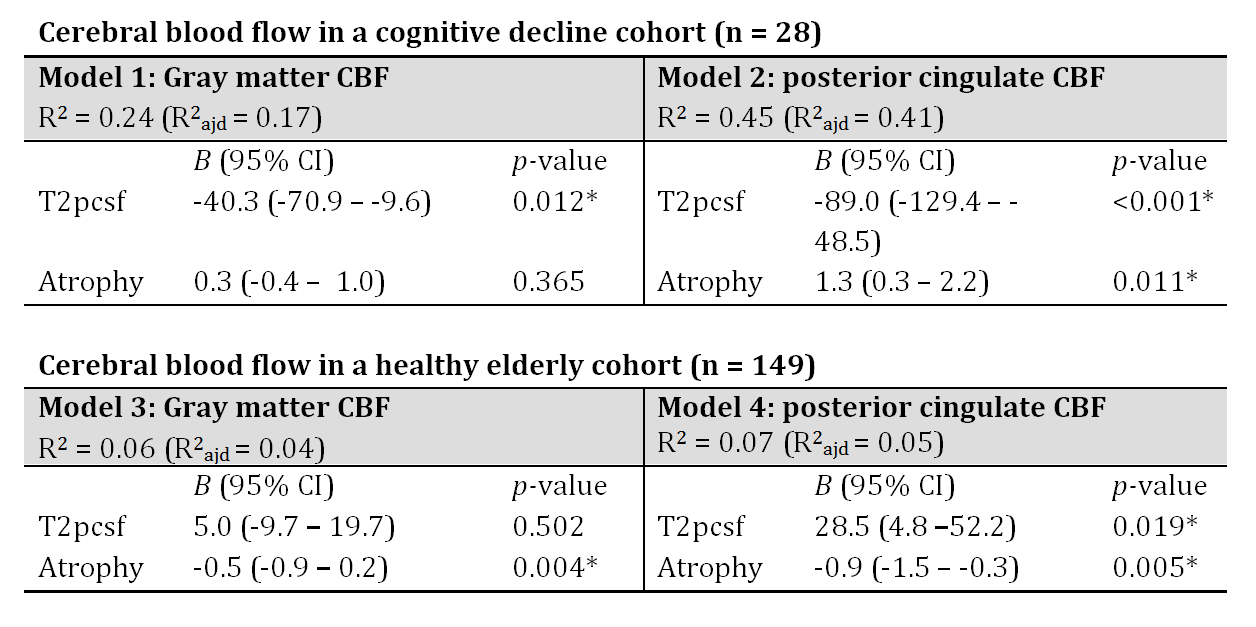
The T2 of peripheral CSF (T2pCSF) was related to (gray matter) CBF in CD but not CN (p = 0.01 and p=0.50, respectively (Table 2).
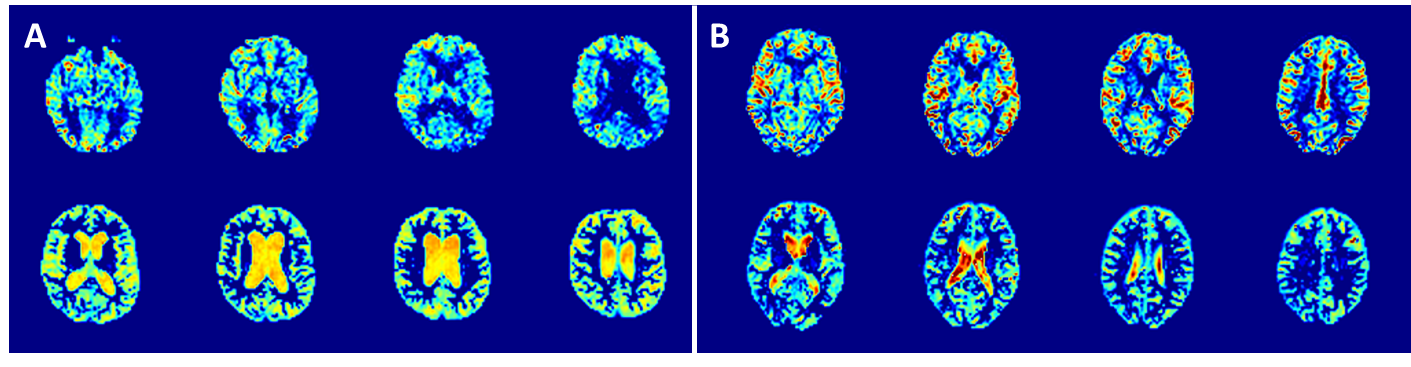
The T2pCSF was also a predictor of CBF in the frontal, occipital, parietal lobe and in the precuneus and posterior cingulate gyrus. Two example cases can be seen in Figure 3.
Cognition data was only available for the group with cognitive decline. The T2pCSF was identified as a determinant for all three cognitive tasks: the 60 second animal naming task for verbal fluency (p=0.02) and the immediate (p=0.01) and delayed recall (p=0.04) episodic memory tasks (Figure 2). No regional CBF measure showed a correlation with cognitive performance (all p-values higher than 0.05).
Conclusion and discussion
In this study, we proposed a higher T2pCSF to be an indirect marker of a lower degree of CSF oxygenation. Comparable to an earlier study we found the T2pCSF to be higher in patients with dementia compared to patients with subjective cognitive complaints. The T2pCSF was related to CBF in a cohort of cognitive decline but not in healthy aging, while similar CBF variations were found in both cohorts. This rejects our hypothesis that the T2pCSF is related to cortical blood flow and, consequently, it suggests there is no relation between T2pCSF and oxygenation in the subarachnoidal space. The higher T2pCSF in subject with cognitive decline might be related to accumulation of cellular debris or amyloid plaques. Investigations regarding the relation between T2pCSF and cognition in the healthy aging cohort are ongoing and can shed light on the prognostic value of T2pCSF for cognitive decline.Acknowledgements
This work was supported by the Netherlands Organization for Scientific Research (NWO) under grant n°91712322 (JH), and the European Research Council under grant agreements n°637024 (JH).References
1. Sperling RA, Jack CR, Aisen PS. Testing the right target and right drug at the right stage. Science Translational Medicine. 2011;3:111cm133-111cm133
2. De Vis JB, Zwanenburg JJ, van der Kleij LA, Spijkerman JM, Biessels GJ, Hendrikse J, Petersen ET. Cerebrospinal fluid volumetric mri mapping as a simple measurement for evaluating brain atrophy. European Radiology. 2016;26:1254-1262
3. Aalten P, Ramakers IH, Biessels GJ, de Deyn PP, Koek HL, OldeRikkert MG, Oleksik AM, Richard E, Smits LL, van Swieten JC, Teune LK, van der Lugt A, Barkhof F, Teunissen CE, Rozendaal N, Verhey FR, van der Flier WM. The dutch parelsnoer institute - neurodegenerative diseases; methods, design and baseline results. BMC Neurology. 2014;14:254
4. Alsop DC, Dai W, Grossman M, Detre JA. Arterial spin labeling blood flow mri: Its role in the early characterization of alzheimer’s disease. Journal of Alzheimer's disease : JAD. 2010;20:871-880
5. Buckner RL, Snyder AZ, Shannon BJ, LaRossa G, Sachs R, Fotenos AF, Sheline YI, Klunk WE, Mathis CA, Morris JC, Mintun MA. Molecular, structural, and functional characterization of alzheimer's disease: Evidence for a relationship between default activity, amyloid, and memory. The Journal of Neuroscience. 2005;25:7709-7717
6. Tzourio-Mazoyer N, Landeau B, Papathanassiou D, Crivello F, Etard O, Delcroix N, Mazoyer B, Joliot M. Automated anatomical labeling of activations in spm using a macroscopic anatomical parcellation of the mni mri single-subject brain. NeuroImage. 2002;15:273-289
7. R Core Team. R: A language and environment for statistical computing. 2017
Figures