0731
Development of advanced multiparametric MRI biomarkers of Alzheimer’s diseaseAshley M. Stokes1, Zhiqiang Li2, James G. Pipe2, Richard J. Caselli3, Marwan N. Sabbagh4, and Leslie C. Baxter5
1Translational Bioimaging Group, Barrow Neurological Institute, Phoenix, AZ, United States, 2Magnetic Resonance Technology Design Group, Barrow Neurological Institute, Phoenix, AZ, United States, 3Mayo Clinic - Arizona, Scottsdale, AZ, United States, 4Neurology, Alzheimer’s and Memory Disorders, Barrow Neurological Institute, Phoenix, AZ, United States, 5Human Brain Mapping Laboratory, Barrow Neurological Institute, Phoenix, AZ, United States
Synopsis
The goal of this project is to establish advanced MRI signatures of each stage of Alzheimer’s disease (AD), including preclinical, mild cognitive impairment (MCI), and dementia stages. These advanced imaging methods will allow us to non-invasively investigate the underlying neurobiological changes that precede cognitive impairment. While structural MRI is known to change with disease progression, advanced MR imaging may provide more specific signatures of disease progression. The asymptomatic and MCI phases represent a clear potential for early intervention, and the non-invasive methods developed here may identify patients along the clinical trajectory of AD.
Introduction
It has been estimated that a 10-year delay in the onset of AD may essentially eliminate the disease [1], highlighting the importance of early detection. Although structural MRI is widely used in the assessment of AD-induced morphological changes [2], these changes are known to occur late in the AD trajectory and may not be ideal early biomarkers. Functional and molecular changes precede brain atrophy [3,4] and may be detectable using advanced MRI in the earlier MCI phases, when intervention would prove most beneficial. The goal of this project is to establish advanced MR imaging signatures that are phenotypical of each stage of AD. In this study, arterial spin labeling (ASL) is used to measure cerebral blood flow (CBF), intravoxel incoherent motion diffusion-weighted imaging (IVIM-DWI) provides measures of perfusion fraction and diffusion, chemical exchange saturation transfer (CEST) is used to probe AD-related molecular species, and susceptibility-weighted imaging (SWI) is sensitive to iron deposition. Each of these metrics was chosen for its sensitivity to a known or suspected pathological change associated AD. We hypothesize that these advanced metrics may provide early biomarkers for incipient MCI or AD, prior to morphological changes.Methods
Three subject groups were recruited for this cross-sectional study: cognitively normal (CN), MCI, and AD (Table 1). All subjects underwent cognitive testing using the Montreal Cognitive Assessment (MoCA), functional assessment staging (FAST), and clock draw immediately prior to MRI. MRI data were acquired at 3T (Ingenia, Philips). Structural MRI data was obtained using ADNI (Alzheimer's Disease Neuroimaging Initiative) protocols [5], and structural parcellation was performed using FreeSurfer software [6,7]. CBF was measured using a 3D spiral-based pseudo-continuous ASL pulse sequence (TR/TE = 4400/15 ms, voxel size = 2.75 x 2.75 x 6 mm3, 90 mm inferior labeling distance, 1800 ms label duration, and 2000 ms post-labeling delay) [8]. Control and tagged image pairs were acquired, along with an additional proton-density (PD)-weighted imaging volume, to quantify voxel-wise CBF maps. The perfusion-insensitive diffusion coefficient (D) and blood volume fraction (fp) were obtained using IVIM-DWI (single-shot spin-echo EPI sequence with TR/TE = 6000/50 ms, voxel size = 2.5 mm isotropic, 40 slices, with three orthogonal diffusion-encoding directions and 8 b-values (b = 0, 25, 50, 75, 100, 200, 500, 1000 s/mm2)). The diffusion data were normalized to the b = 0 data and then fit to a bi-exponential model to obtain IVIM parameters [9]. Glutamate (3.0 ppm) and amide (3.5 ppm) proton transfer (APT) were probed using pulsed CEST sequence (3D gradient-echo, TR/TE = 54/8.7 ms, voxel size = 1.5 x 1.5 x 5.0 mm3, 26 slices, 25 ms 1 μT gauss pulse with 48 interleaved offsets). Quantification of GluCEST [10] and APT was calculated using the residual from a Lorentzian fit. SWI was acquired to quantify cerebral microbleeds (3D multi-gradient-echo, TR/TE/ΔTE = 31/7.2/6.2 ms, 4 echoes, voxel size = 1.0 mm isotropic). Minimum intensity projections (minIP) were reconstructed with 10 mm slice thickness. All data were registered to the T1-weighted image volume using the affine (12 DOF) registration algorithm FLIRT (FSL, FMRIB Centre, Univ. of Oxford) for ROI analysis. Regional metrics were compared using an unpaired t-test. Work is ongoing to acquire longitudinal data in this cohort.Results / Discussion
Mean (± standard deviation) scores for the MoCA, FAST, and clock-draw are shown in Table 1. Figure 1 illustrates representative imaging examples from each group and imaging method. Across all subjects, regional analysis of structural MRI (Figure 2) revealed significantly reduced cortical thickness and hippocampal volume, while lateral and inferior lateral ventricular volumes were elevated. Figure 3 shows the regional analyses for the advanced MRI biomarkers. Both cerebral cortex and cerebral WM showed lower perfusion for the AD subjects, though these results were not significant. The perfusion-insensitive (IVIM-D) diffusion coefficient showed significant differences in the cerebral cortex, with increased diffusion in the AD subjects (p = 0.002 for CN vs. AD and p = 0.004 for MCI vs. AD). These results may indicate altered microstructural characteristics. GluCEST was reduced in the AD subjects, consistent with prior MR spectroscopy results [11]; additionally, APT-CEST showed lower CEST signal in the AD subjects, suggesting altered protein content in these patients. SWI analysis is currently underway to quantify and characterize cerebral microbleeds in each group.Conclusions
This study lays the framework for the development of advanced multi-parametric MRI to characterize the neuropathological changes that occur in Alzheimer’s disease. These advanced imaging signatures may be early indicators of incipient AD-related MCI or dementia, when intervention would prove most beneficial.Acknowledgements
This work was supported by Arizona Alzheimer’s Consortium, Barrow Neurological Foundation, and Philips Healthcare.References
[1] DeKosky ST, Marek K. Looking Backward to Move Forward: Early Detection of Neurodegenerative Disorders. Science (80- ) 2003;302:830–4. doi:10.1126/science.1090349.[2] Frisoni GB, Fox NC, Jack Jr. CR, Scheltens P, Thompson PM. The clinical use of structural MRI in Alzheimer disease. Nat Rev Neurol 2010;6:67–77. doi:10.1038/nrneurol.2009.215.
[3] Jack Jr CR, Knopman DS, Jagust WJ, Shaw LM, Aisen PS, Weiner MW, et al. Hypothetical model of dynamic biomarkers of the Alzheimer’s pathological cascade. Lancet Neurol 2016;9:119–28. doi:10.1016/S1474-4422(09)70299-6.
[4] Li TQ, Wahlund LO. The search for neuroimaging biomarkers of Alzheimer’s disease with advanced MRI techniques. Acta Radiol 2011;52:211–22. doi:10.1258/ar.2010.100053.
[5] Jack Jr. CR, Bernstein MA, Fox NC, Thompson P, Alexander G, Harvey D, et al. The Alzheimer’s Disease Neuroimaging Initiative (ADNI): MRI methods. J Magn Reson Imaging 2008;27:685–91. doi:10.1002/jmri.21049.
[6] Dale A, Fischl B, Sereno MI. Cortical Surface-Based Analysis: I. Segmentation and Surface Reconstruction. Neuroimage 1999;9:179–94.
[7] Fischl B, Sereno MI, Dale A. Cortical Surface-Based Analysis: II: Inflation, Flattening, and a Surface-Based Coordinate System. Neuroimage 1999;9:195–207.
[8] Li Z, Schär M, Wang D, Zwart NR, Madhuranthakam AJ, Karis JP, et al. Arterial spin labeled perfusion imaging using three-dimensional turbo spin echo with a distributed spiral-in/out trajectory. Magn Reson Med 2016;75:266–73. doi:10.1002/mrm.25645.
[9] Meeus EM, Novak J, Withey SB, Zarinabad N, Dehghani H, Peet AC. Evaluation of intravoxel incoherent motion fitting methods in low-perfused tissue. J Magn Reson Imaging 2016. doi:10.1002/jmri.25411.
[10] Haris M, Nath K, Cai K, Singh A, Crescenzi R, Kogan F, et al. Imaging of glutamate neurotransmitter alterations in Alzheimer’s disease. Nmr Biomed 2013;26:386–91. doi:10.1002/nbm.2875.
[11] Rupsingh R, Borrie M, Smith M, Wells JL, Bartha R. Reduced hippocampal glutamate in Alzheimer disease. Neurobiol Aging n.d.;32:802–10. doi:10.1016/j.neurobiolaging.2009.05.002.
Figures
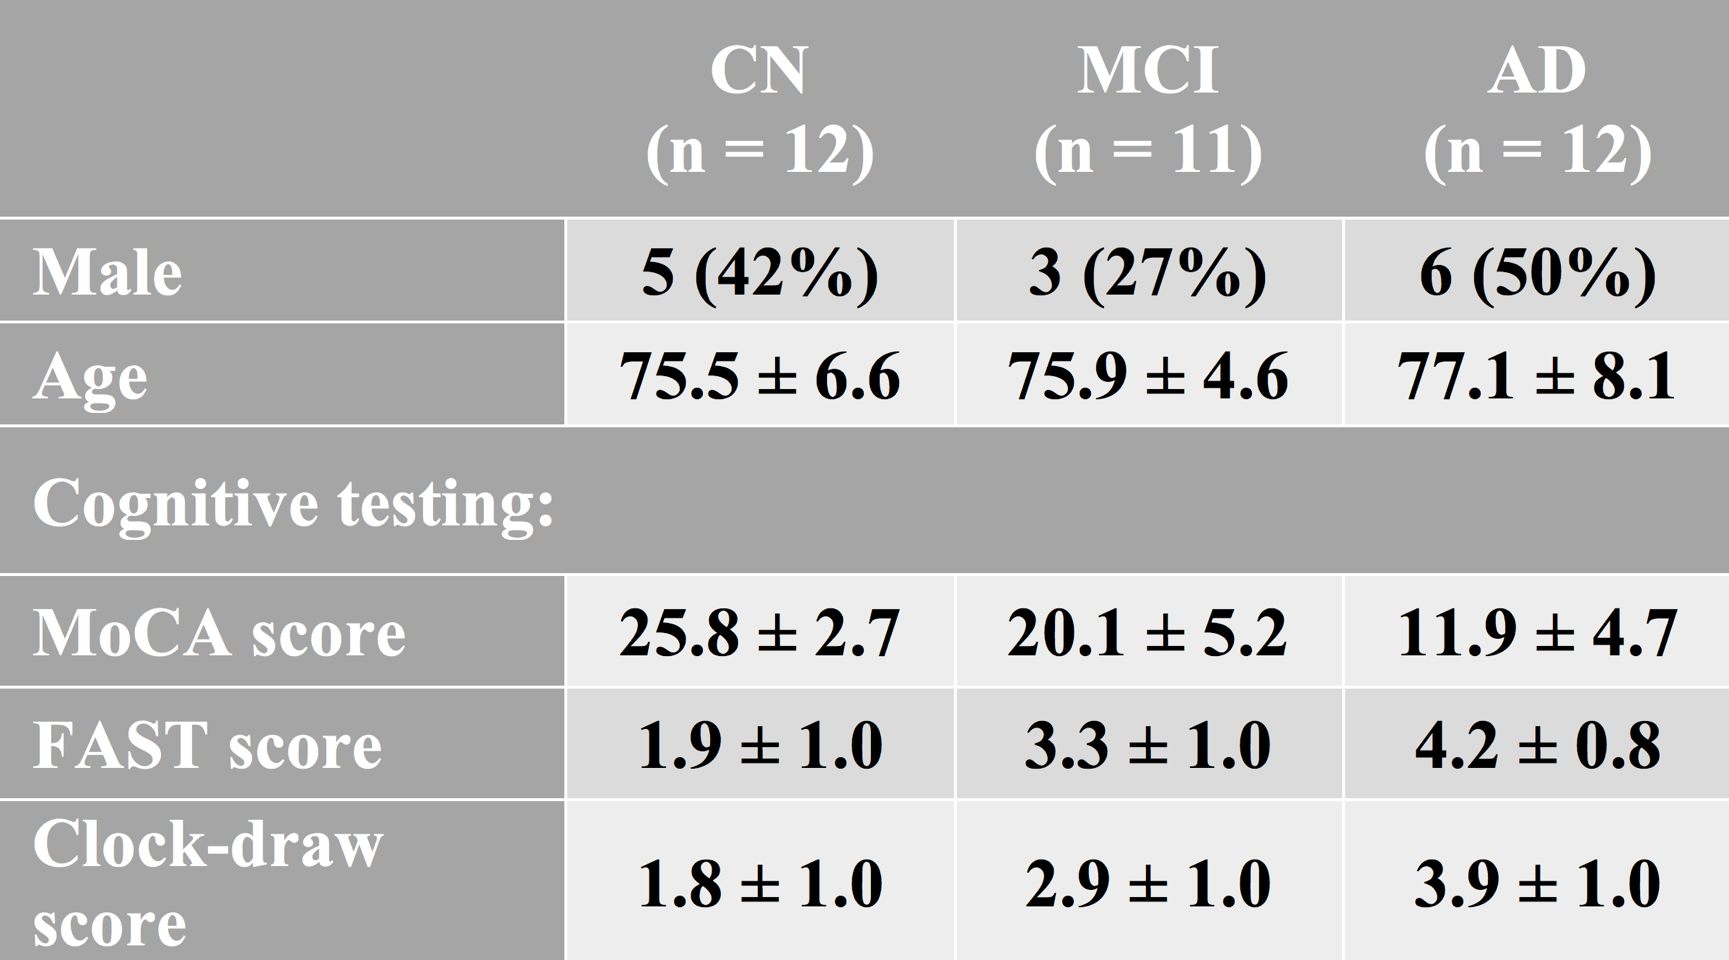
Table 1: Subject demographics and cognitive testing results.
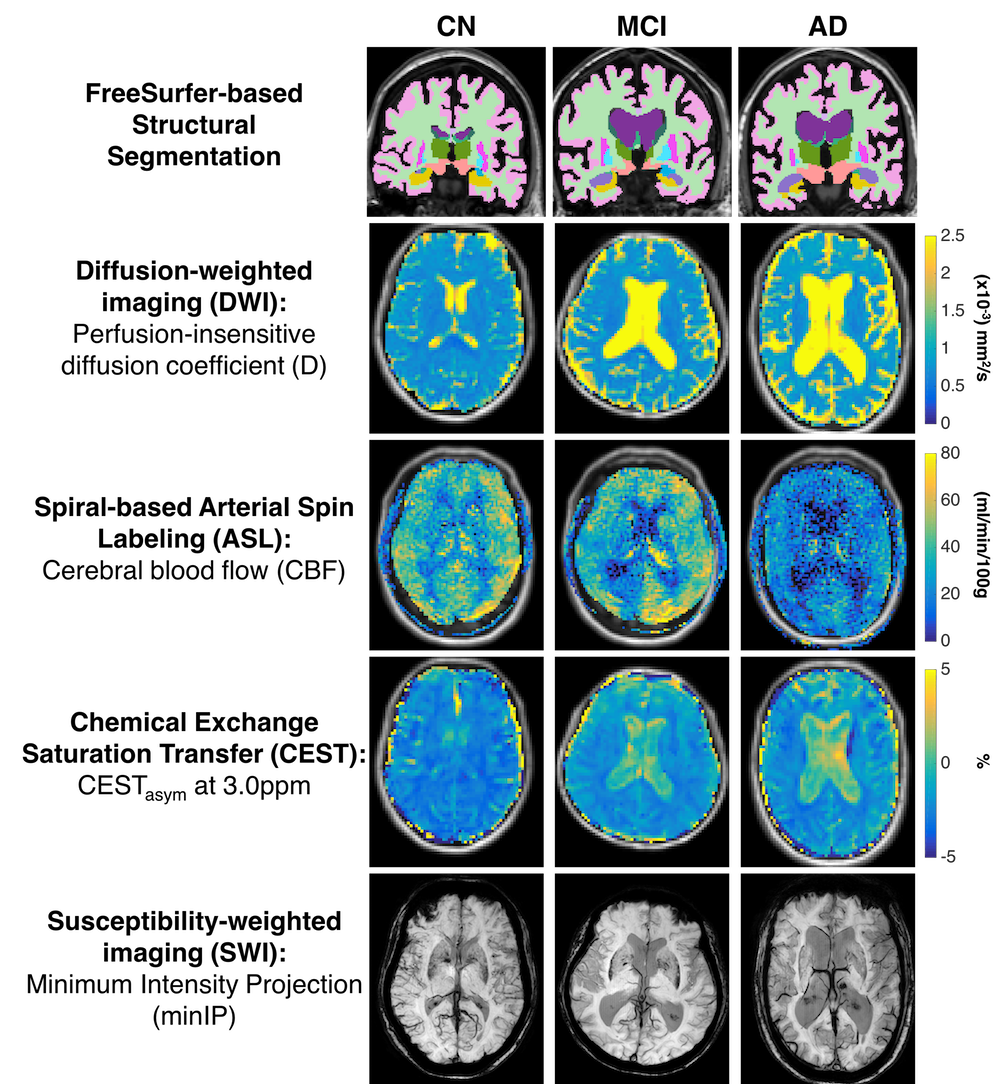
Figure 1: Representative imaging examples from each
group (left to right: cognitively normal, MCI, and AD) and imaging method (top
to bottom: structural MRI, pCASL, IVIM-DWI, CEST, and SWI).
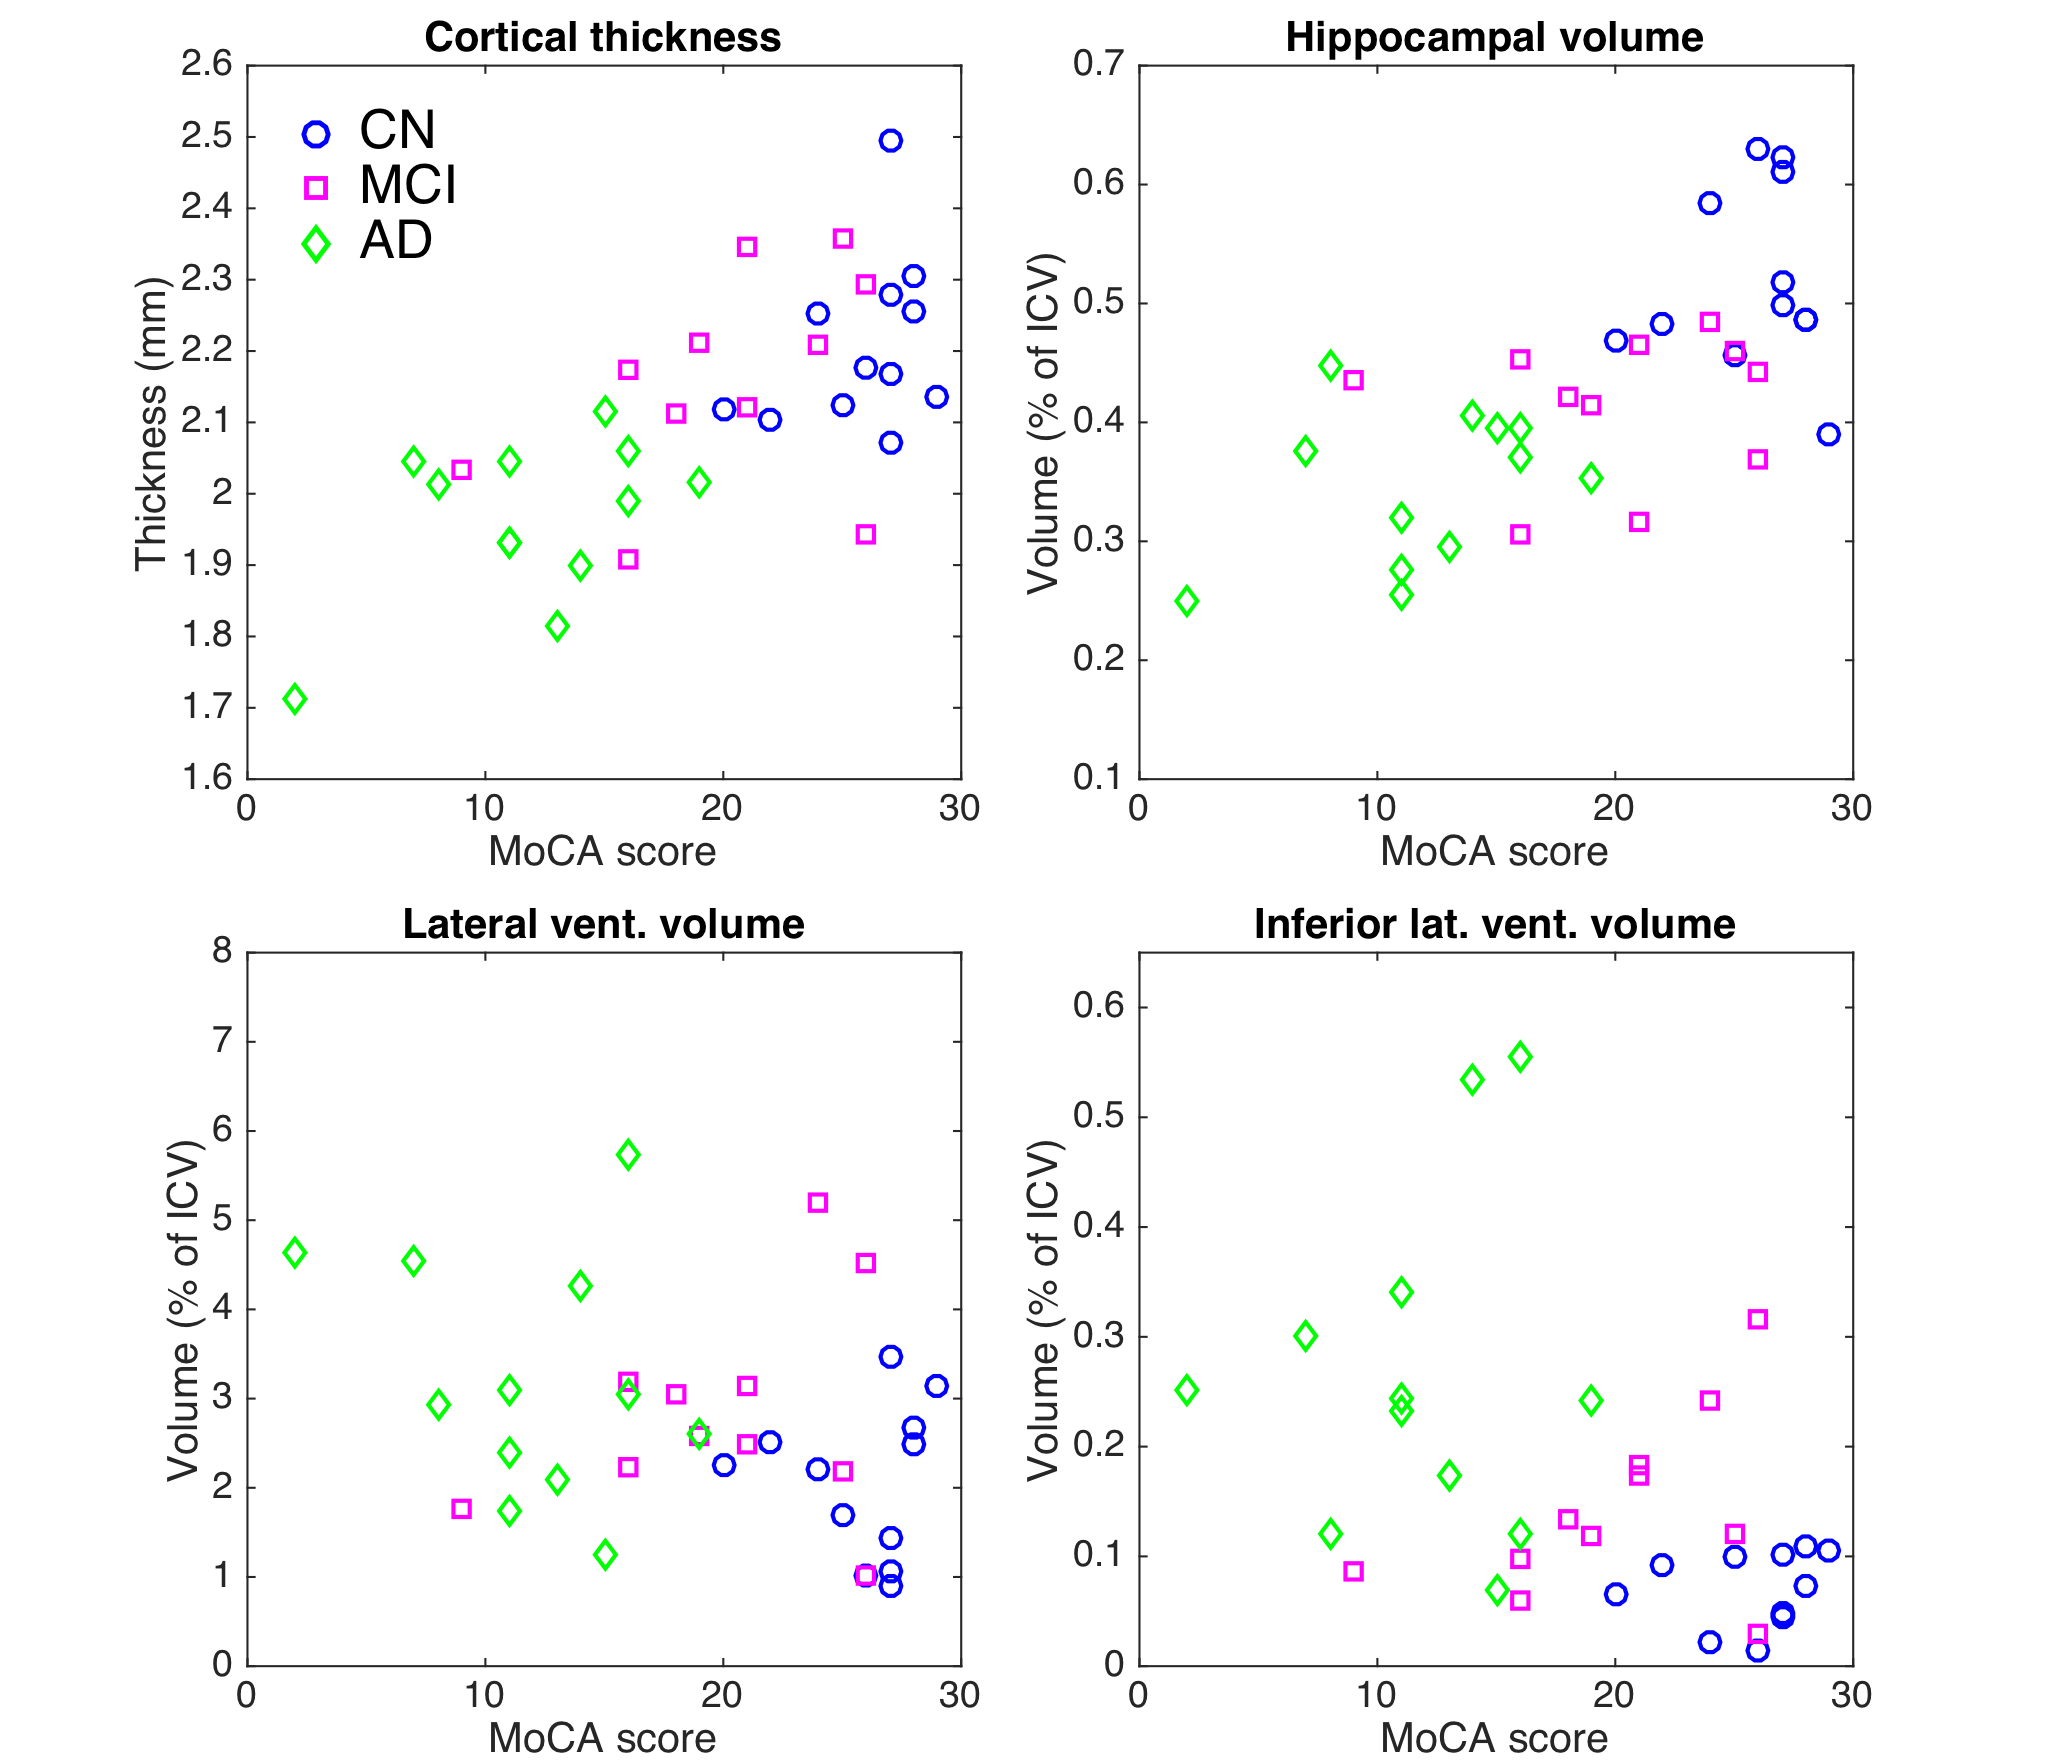
Figure 2: Results from structural MRI analysis.
Cortical thickness, hippocampal volume, lateral ventricular volume, and
inferior lateral ventricular volume are shown versus MoCA score for each
subject (blue circles: CN, magenta squares: MCI, green diamonds: AD). Cortical
thickness and hippocampal volume are both significantly decreased with MCI and
AD (cortical thickness: p<0.05 AD vs. MCI and p<0.001 CN vs. AD; hippocampal
volume: p<0.01 for CN vs. MCI, AD vs. MCI, and CN vs. AD). Lateral and
inferior lateral ventricular volumes are increased. These results are consistent
with known regional brain atrophy trends.
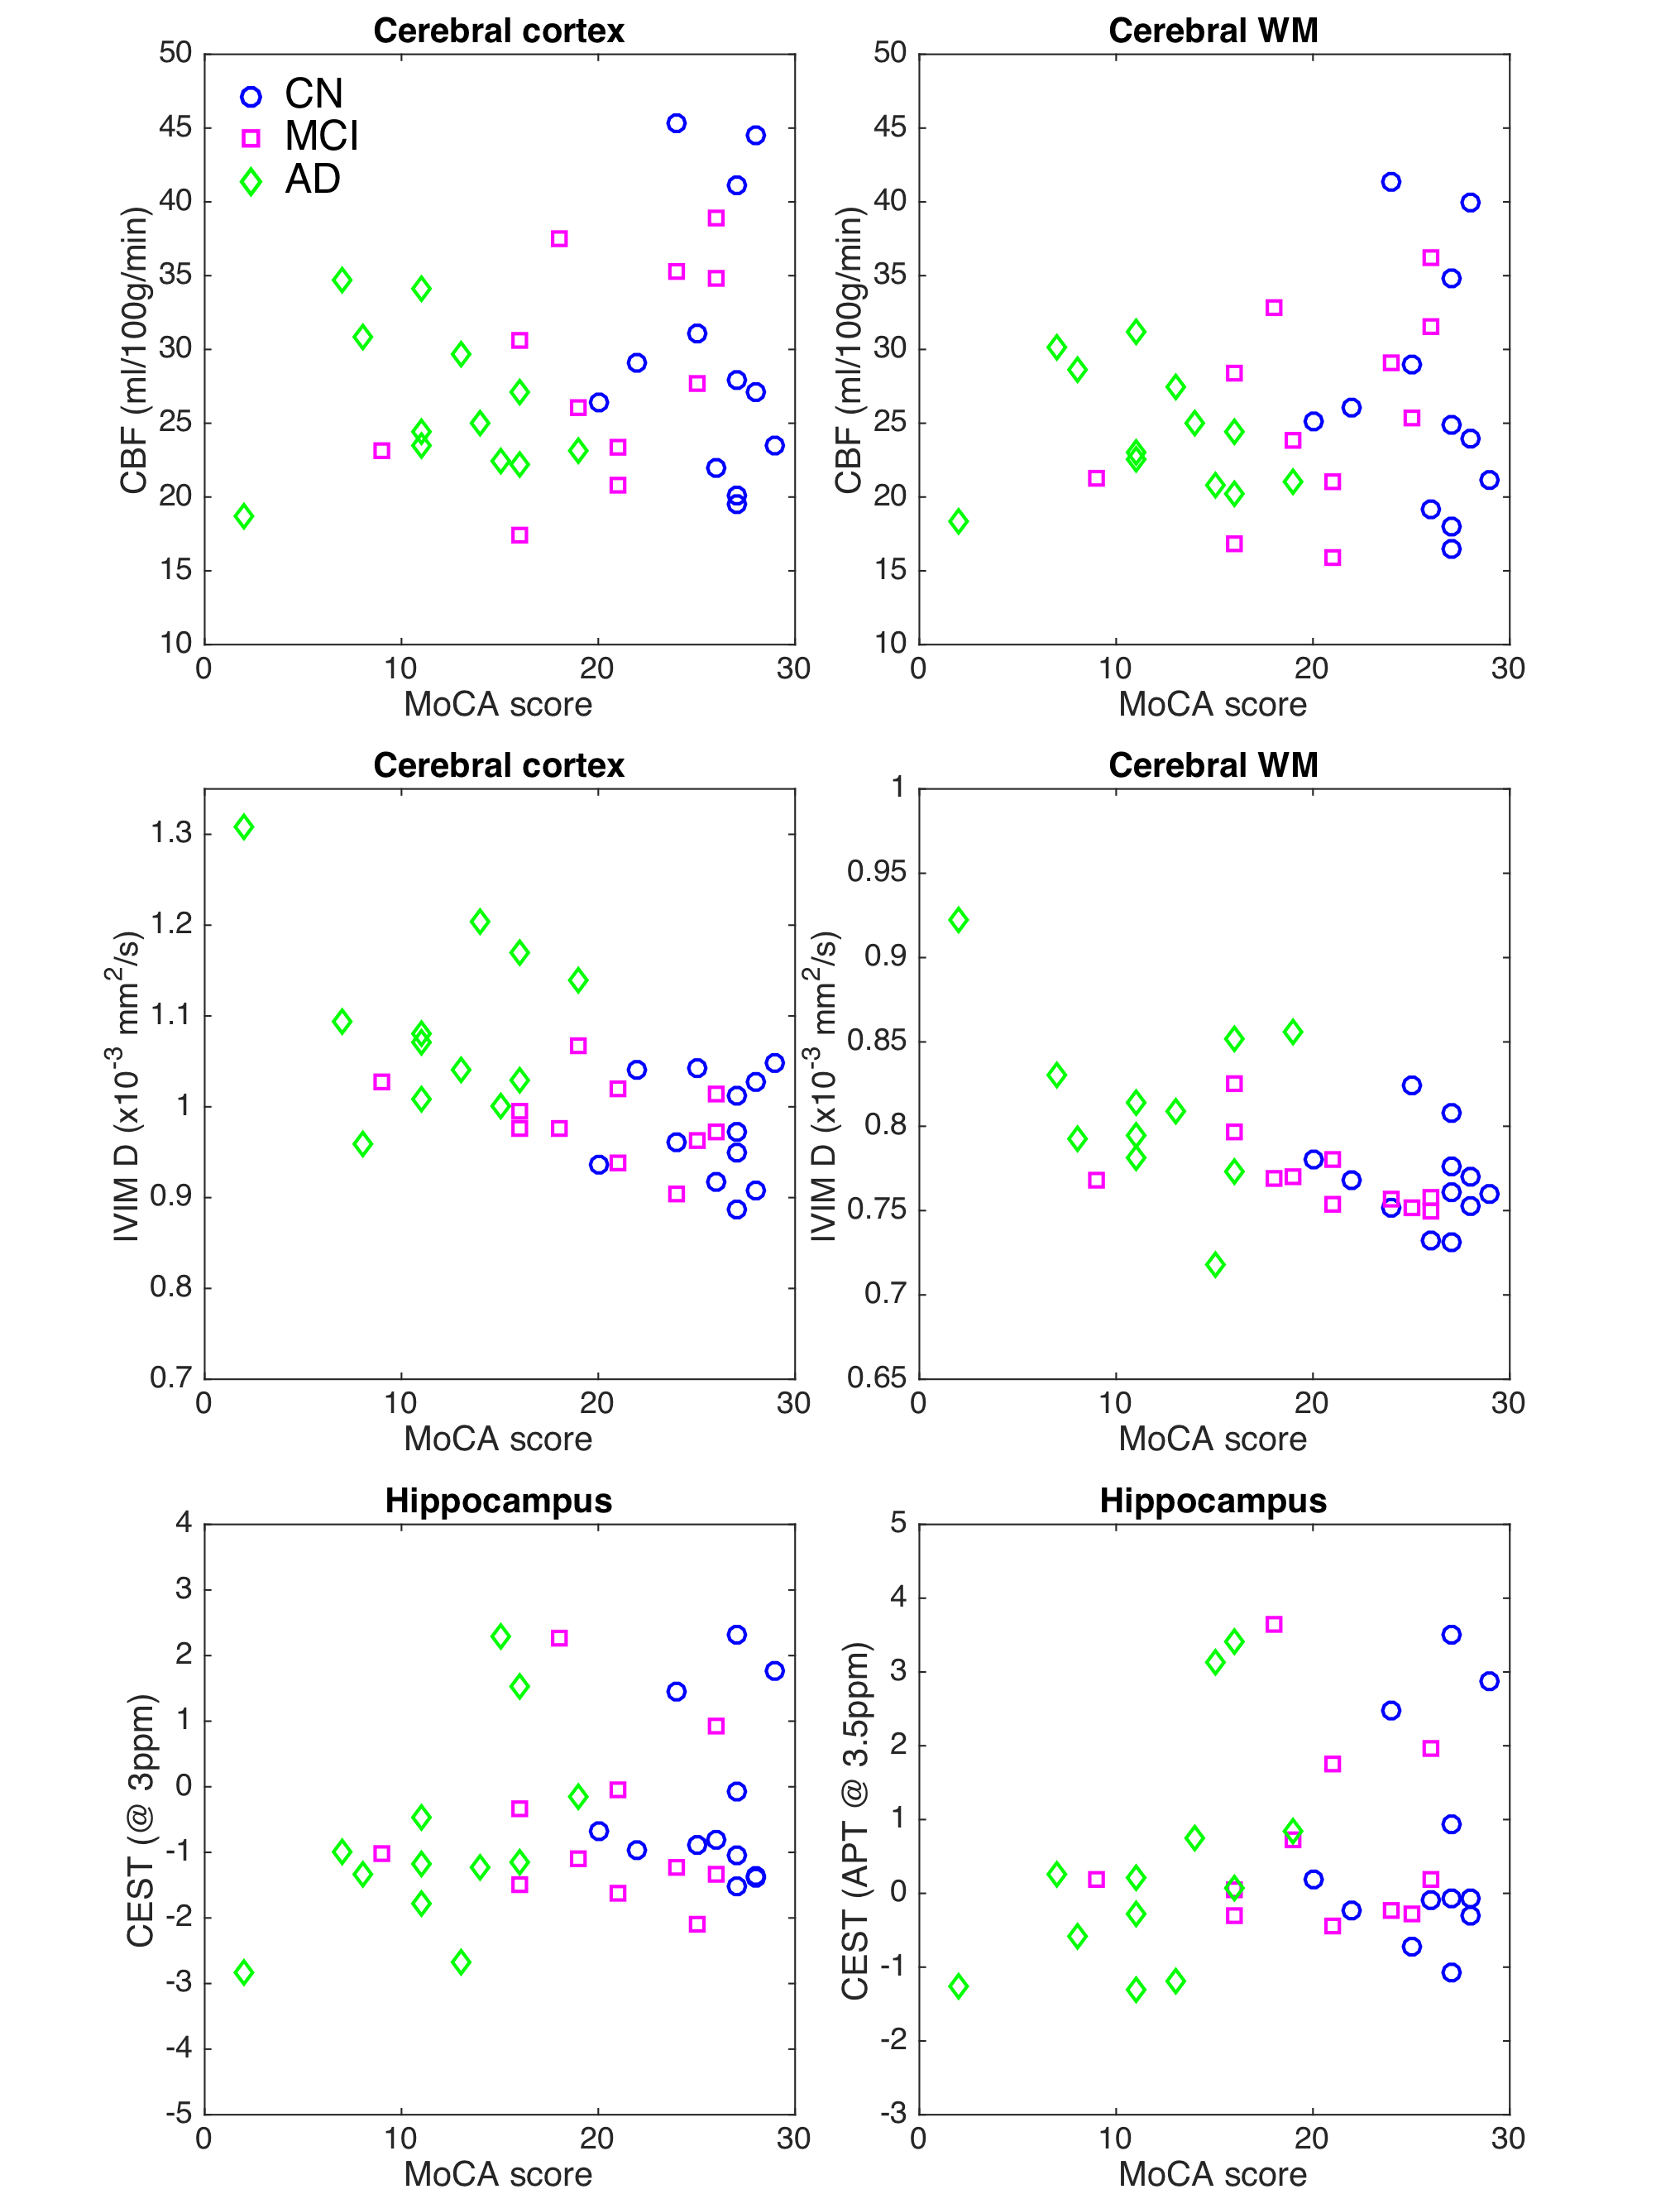
Figure 3: Results from advanced MRI analysis. Regional
CBF, IVIM-Diffusion, GluCEST, and APT-CEST are shown versus MoCA score for each
subject (blue circles: CN, magenta squares: MCI, green diamonds: AD). CBF was
reduced in the cerebral cortex and WM, while IVIM-D was increased in MCI and AD
subjects. GluCEST (3ppm) and APT (3.5ppm) were both reduced in the hippocampus
in MCI and AD subjects.