0729
Elevated cerebral blood flow in amyloid-positive elderly cognitively normal controls1Department of Radiology, University of Pennsylvania, Philadelphia, PA, United States, 2Department of Neurology, University of Pennsylvania, Philadelphia, PA, United States, 3Department of Radiology and Biomedical Imaging, University of California – San Francisco, San Francisco, CA, United States
Synopsis
We evaluated the effects of [18F]-Florbetapir PET-derived amyloid (A$$$\beta$$$) status on regional cerebral blood flow (CBF) measured using pulsed arterial spin labeling (PASL) in control subjects from the Alzheimer’s Disease Neuroimaging Initiative (ADNI) database. Mean CBF in whole grey matter, posterior cingulate and precuneus showed significantly higher CBF in amyloid positive (A$$$\beta$$$+) group compared to the amyloid negative (A$$$\beta$$$-) group after eliminating subjects with poor PASL data quality as assessed by an automated algorithm. Subjects with higher CBF in the A$$$\beta$$$- group also demonstrated better episodic memory whereas a reverse trend was observed in the A$$$\beta$$$+ group.
Introduction
Cerebral amyloid deposition and changes in regional cerebral blood flow (CBF) have both independently been found to be associated with the progression of Alzheimer’s disease (AD), but the relationship of CBF changes with amyloid deposition is unclear in the preclinical stage of AD. Although CBF decreases both globally and regionally in AD, some studies have reported elevated CBF in early clinical stages of AD.1,2 This study evaluated CBF in preclinical AD, leveraging data from the Alzheimer’s Disease Neuroimaging Initiative (ADNI)3, to test the hypothesis that CBF is elevated in A$$$\beta$$$+ controls. Barriers to examining CBF in preclinical AD are that CBF changes may be subtle and that ADNI used pulsed arterial spin labeling (PASL) obtained without background suppression, resulting in variable data quality. We compared regional CBF changes measured using PASL in cognitively normal older adults divided into those with preclinical AD (i.e. “amyloid positive” (A$$$\beta$$$+)) and those without (i.e. “amyloid negative” (A$$$\beta$$$-)) from the ADNI study, leveraging an automated data quality evaluation algorithm to adjust the quality of PASL data used for the comparison.Methods
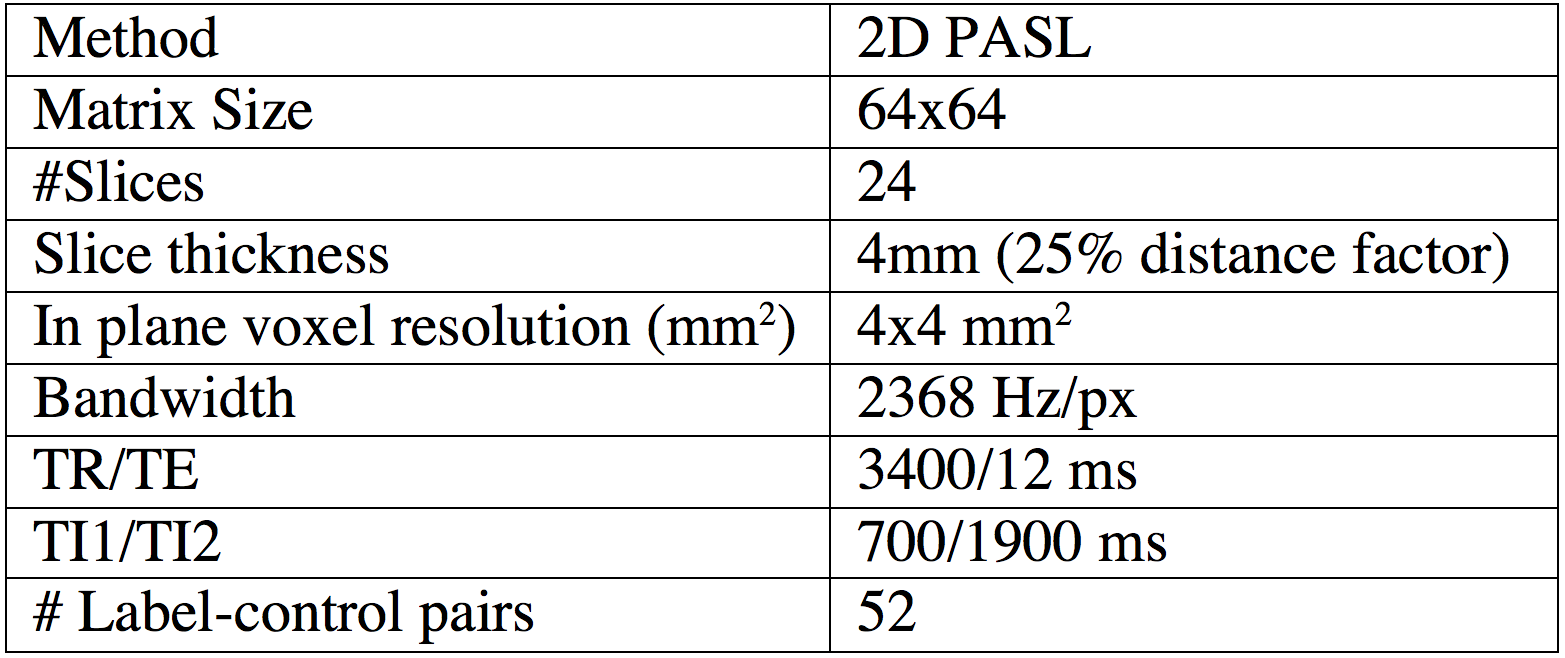
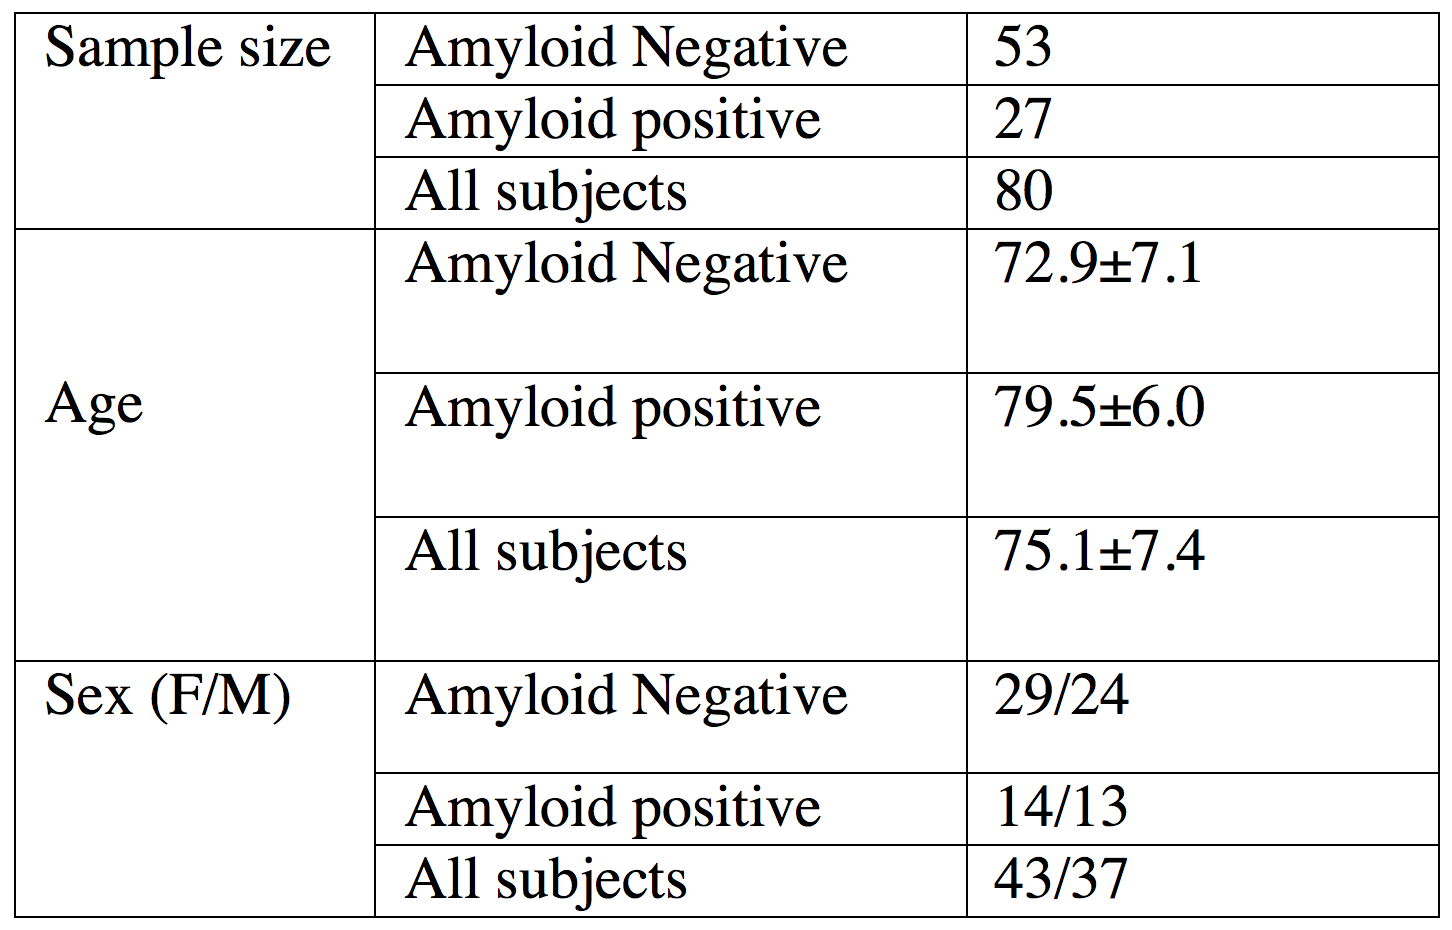
ADNI ASL acquisition protocol and the demographic characteristics of the cohort are shown in Table 1 and 2 respectively. Mean CBF maps were obtained from ASL data using advanced signal processing algorithms.4,5 Amyloid statuses (positive or negative) for each subject was determined using [18F]-Florbetapir Position Emission Tomography (PET) acquisition followed by standard processing and cutoffs for dichotomization.6 We considered mean CBF in posterior cingulate cortex (PCC), precuneus, and hippocampus, which have been reported to be the most consistent regions demonstrating AD related CBF changes.7,8 Grey matter (GM) CBF was also considered to assess global changes. An automated quality evaluation index (QEI)9 was computed for each CBF map to assess data quality. The QEI assigns values between 0 and 1 with 1 being best, 0 being worst, and 0.55-0.6 providing a balance of specificity and sensitivity for identifying good CBF maps. We iteratively discarded CBF maps based on lowest QEI values and recomputed effect sizes for each ROI with positive effect size implying higher CBF in A$$$\beta$$$+ groups. We computed p values based on two sample T tests (p2 sample T test) for group differences as a function of the number of subjects remaining after iterative discard of the poorest scan. We also computed correlation between CBF and episodic memory, where the latter was quantified using the number of words recalled after 30 minutes delay in the Rey auditory verbal learning test. Separate tests were run for the A$$$\beta$$$- and A$$$\beta$$$+ groups.Results
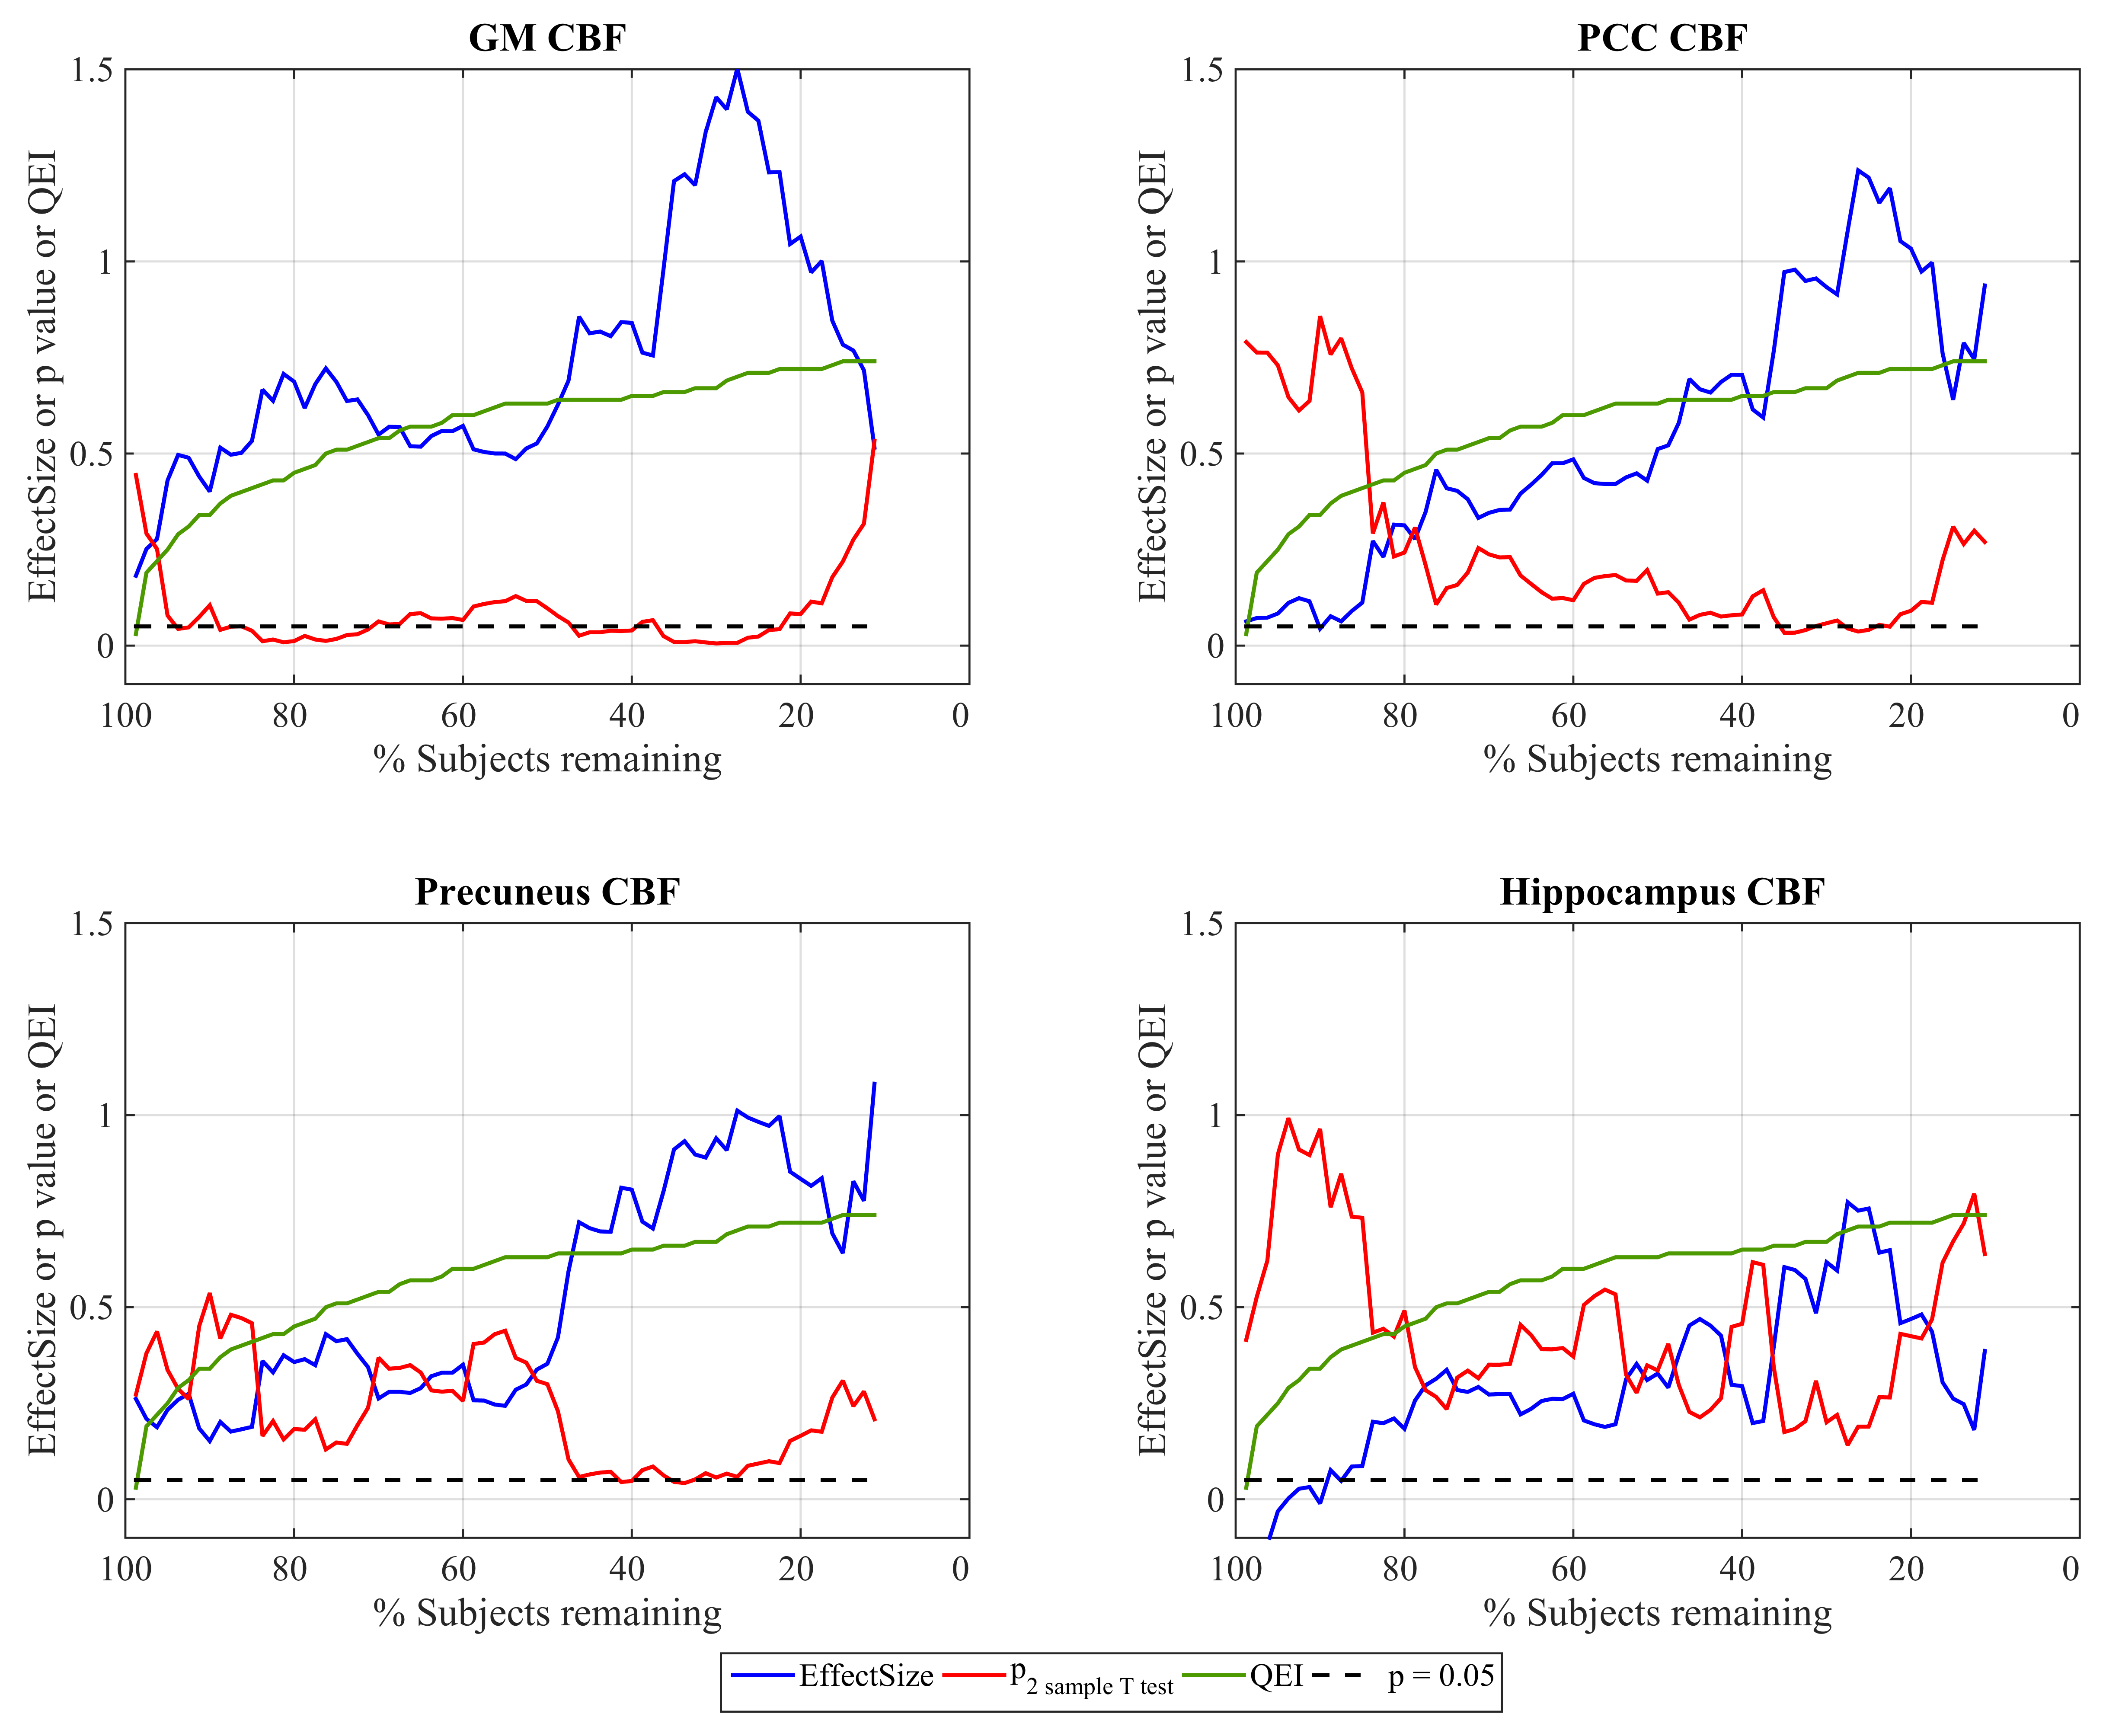
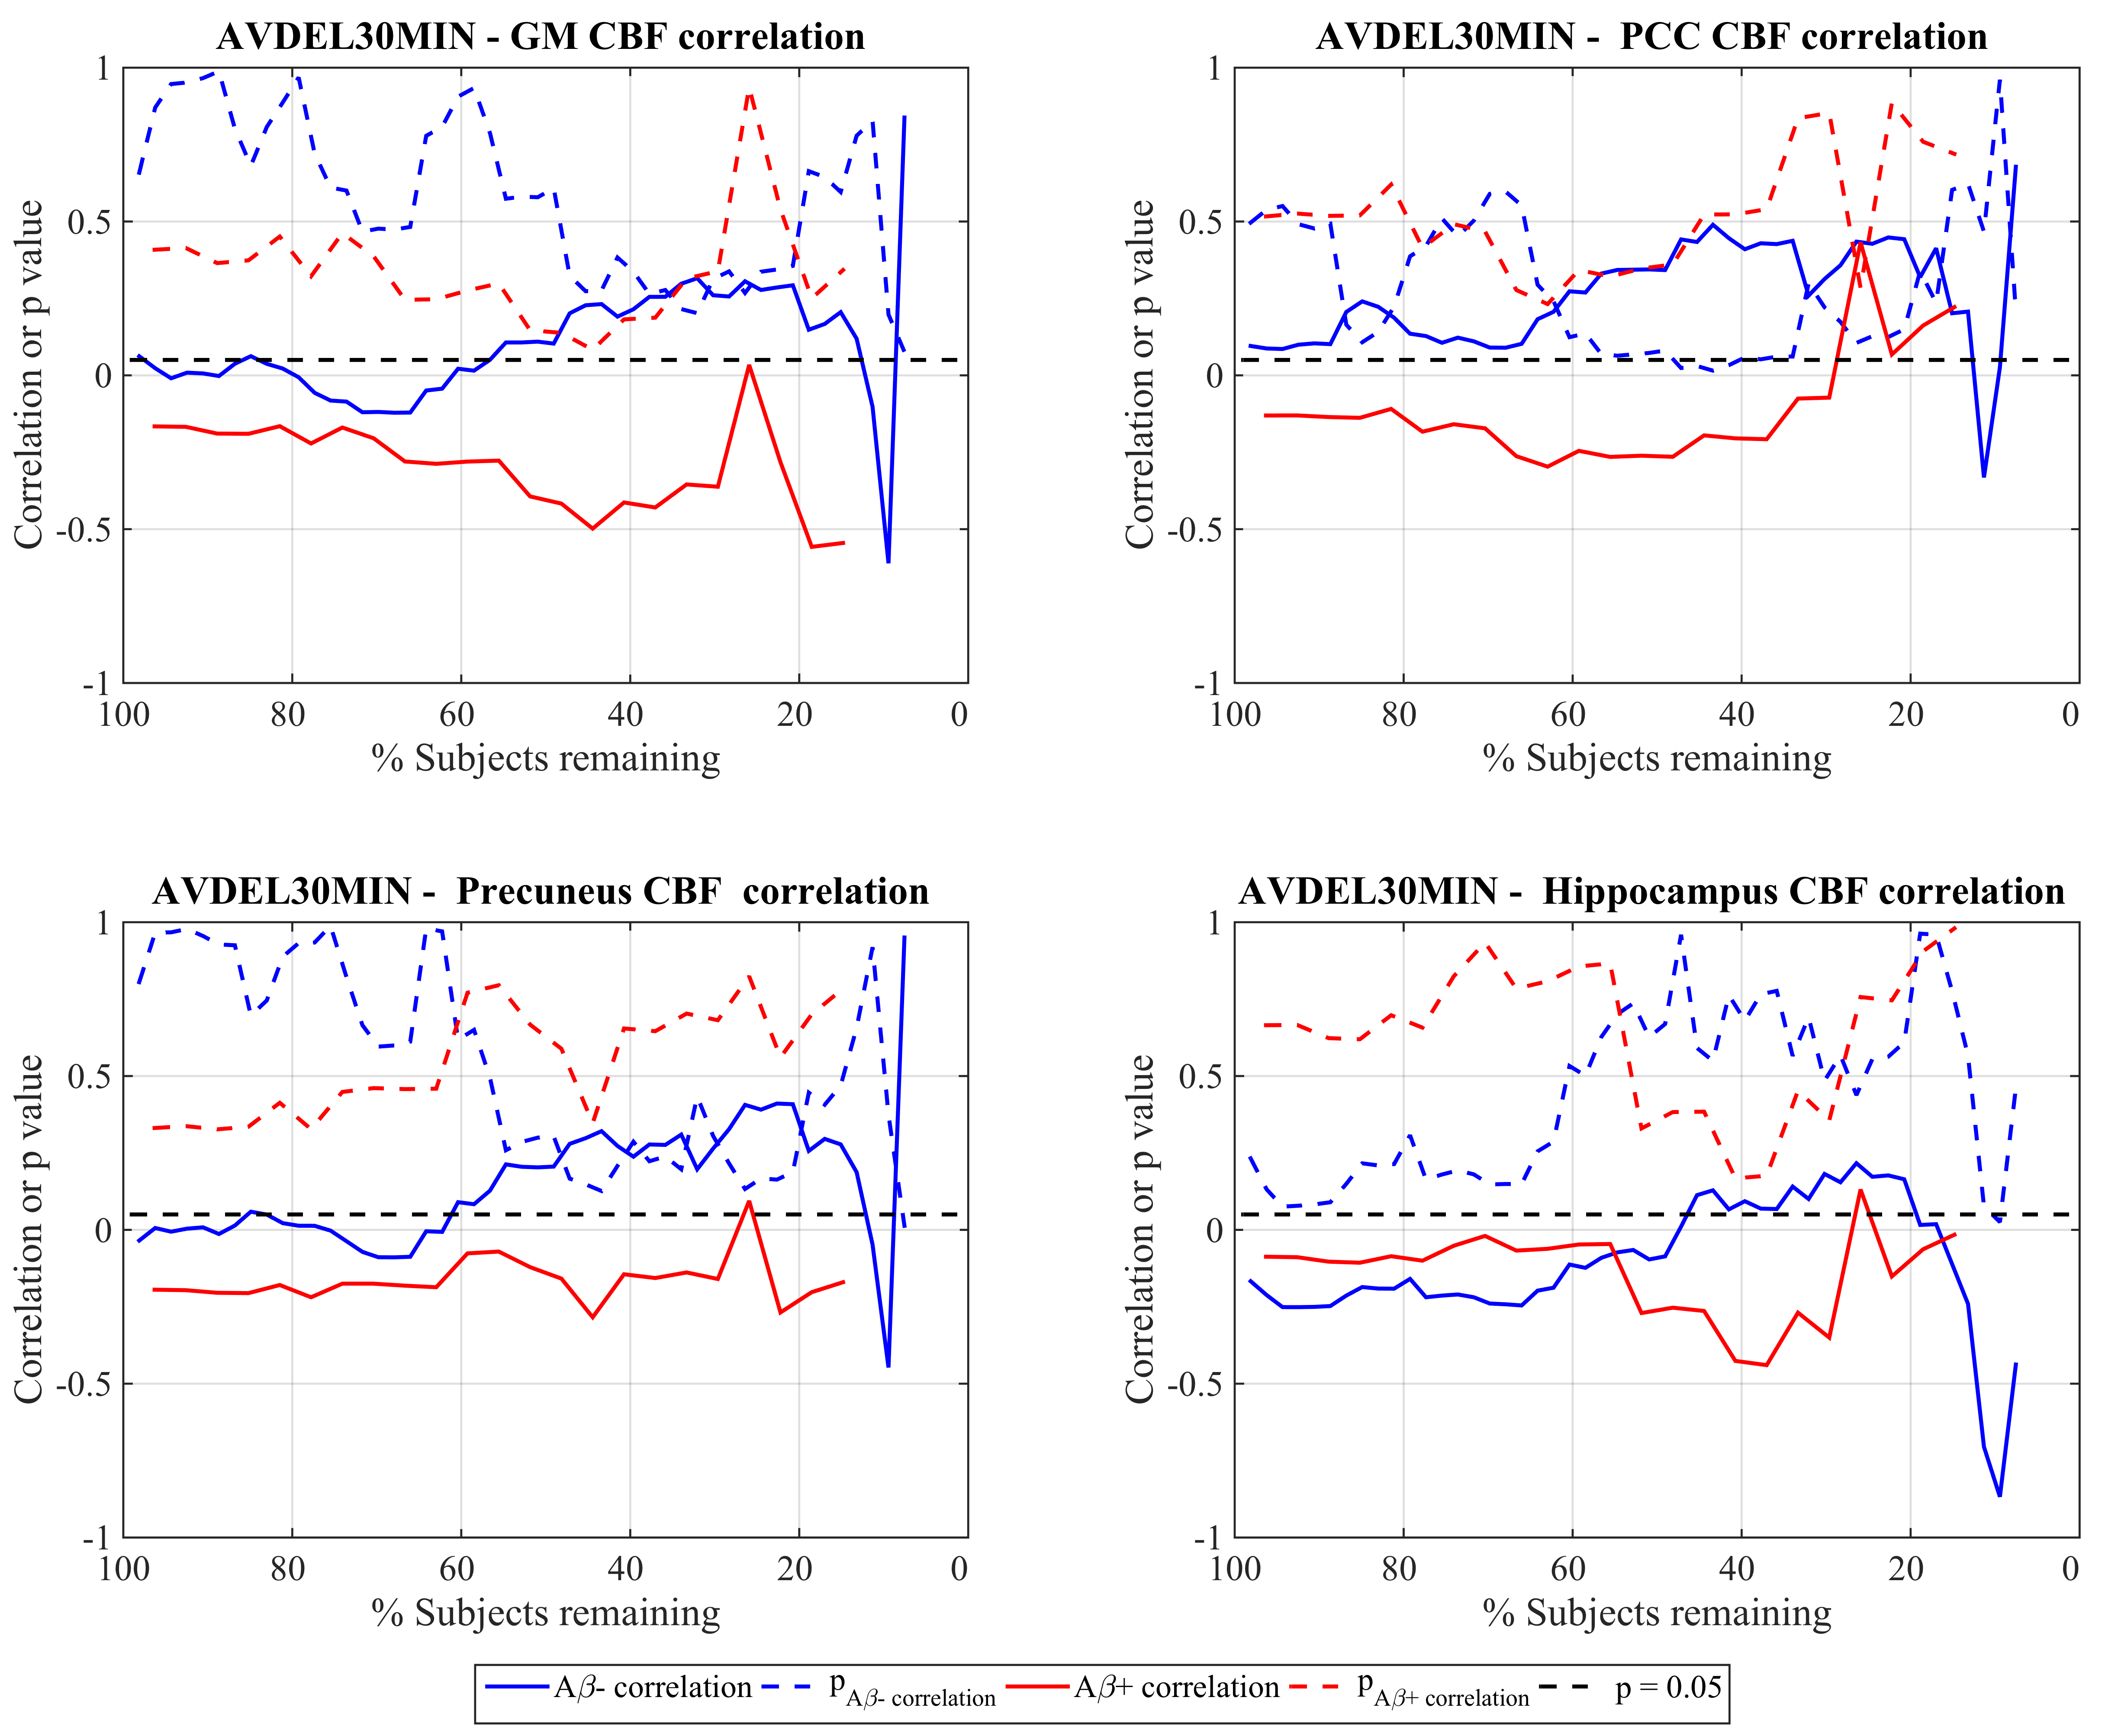
Figure 1 shows the effect sizes (higher CBF in Aβ+) for discriminating the two groups with GM, PCC, precuneus and hippocampus CBF as a function of number of subjects remaining after discarding subjects with successively increasing QEI. It also shows the QEI values of the subject discarded and p values corresponding to two sample T tests. The effect sizes with GM, PCC and precuneus CBFs in ADNI are medium (>0.5) to large (>0.8) especially after discarding sizable number of poorly rated scans. For hippocampus CBF, the effect sizes are small (>0.2) to medium. In the case of GM CBF, p2 sample T test becomes statistically significant (p<0.05) after discarding just a few poor scans and remains significant even when discarding much larger numbers based on higher QEI cutoffs. As expected, p values are no longer significant when the sample size becomes very small despite a large effect size. Group differences using PCC and precuneus CBF values become statistically significant only after discarding more than 50% of the data though the effect size steadily increases with better image quality. Hippocampus CBF also showed a similar trend that did not reach statistical significance. Figure 2 shows the cognitive correlation analysis in the two groups. A$$$\beta$$$- subjects showed higher CBF correlating with better cognitive performance, which reached significance in PCC after discarding almost 50% of the scans, while A$$$\beta$$$+ subjects showed an opposite trend.Discussions and conclusions
CBF tends to be higher in A$$$\beta$$$+ cognitively normal adults (i.e. preclinical AD), supporting the hypothesis of an inverse U-shaped curve of hyperactivation in the early clinical stage of AD.10 Statistically significant results were only apparent after eliminating poor quality data, emphasizing the need for quality control before analysis. Although correlations between CBF and cognitive performance were less significant than comparisons between groups, the trend towards negative correlations between CBF and cognitive performance in the A$$$\beta$$$+ group suggest that increases in CBF reflect an incomplete compensatory response to underlying neural dysfunction in preclinical AD.Acknowledgements
R01 MH080729, P41 EB015893, R01 AG040271 and P30 AG010124 and the Alzheimer's Disease Neuroimaging Initiative (ADNI) study.References
1. Alsop DC, Casement M, de Bazelaire C, et al. Hippocampal hyperperfusion in Alzheimer's disease. NeuroImage 2008;42:1267-1274.
2. Dai W, Lopez OL, Carmichael OT, et al. Mild cognitive impairment and alzheimer disease: patterns of altered cerebral blood flow at MR imaging. Radiology 2009;250:856-866.
3. http://www.loni.ucla.edu/ADNI
4. Dolui S, Wang Z, Shinohara RT, et al. Structural Correlation-based Outlier Rejection (SCORE) algorithm for arterial spin labeling time series. Journal of magnetic resonance imaging : JMRI 2016;45:1786-1797.
5. Dolui S, Wolk DA, Detre JA. SCRUB: A Structural Correlation and Empirical Robust Bayesian Method for ASL Data. Proceedings of the International Society of Magnetic Resonance in Medicine; 2016; Singapore.
6. Mattsson N, Tosun D, Insel PS, et al. Association of brain amyloid-beta with cerebral perfusion and structure in Alzheimer's disease and mild cognitive impairment. Brain : a journal of neurology 2014;137:1550-1561.
7. Dolui S, Vidorreta M, Wang Z, et al. Comparison of PASL, PCASL, and background-suppressed 3D PCASL in mild cognitive impairment. Hum Brain Mapp 2017.
8. Xekardaki A, Rodriguez C, Montandon ML, et al. Arterial spin labeling may contribute to the prediction of cognitive deterioration in healthy elderly individuals. Radiology 2015;274:490-499.
9. Dolui S, Wolf R, Nabavizadeh SA, et al. Automated Quality Evaluation Index for 2D ASL CBF Maps. Proceedings of the International Society of Magnetic Resonance in Medicine; 2017; Hawaii, USA.
10. Sperling RA, Dickerson BC, Pihlajamaki M, et al. Functional alterations in memory networks in early Alzheimer's disease. Neuromolecular Med 2010;12:27-43.
Figures