0728
Brain 1H-MRS and volumetric changes predict conversion from Mild Cognitive Impairment to Alzheimer’s disease: a follow-up study1Functional MR Unit, Policlinico S.Orsola - Malpighi, Bologna, Italy, 2Department of Biomedical and NeuroMotor Sciences, University of Bologna, Bologna, Italy, 3IRCCS Institute of Neurological Sciences, Bologna, Italy
Synopsis
Predicting the possible evolution from the prodromal MCI stage to dementia is a great challenge for both clinic practice and research. We investigated the predictive role of magnetic resonance spectroscopy and brain volumetry in the progression from Mild Cognitive Impairment (MCI) to Alzheimer’s Disease (AD). The (NAA+NAAG)/ml ratio in the Posterior Cingulate Cortex (PCC) discriminates at baseline MCI converters from non-converters with an accuracy of 79% after a mean follow-up of 28 months. Volumetric reduction of the parahippocampal gyrus and fusiform gyrus was also found to be an accurate marker of progression to AD (Accuracy 84.2% and 73.6% respectively).
Introduction
Mild Cognitive Impairment (MCI) is an intermediate clinical stage between the expected cognitive decline of normal aging and the very earliest features of dementia1. Longitudinal studies provide evidence for different possible progression of MCI patients, ranging from the development of Alzheimer’s Disease (AD) or non-AD dementias to the stabilization or even reversion of cognitive impairments2. While a large body of literature is focused on the early diagnosis of MCI, fewer studies have investigated the early detection of those MCI patients who will later convert to dementia. The aim of this study is to investigate the predictive role of magnetic resonance spectroscopy (1H-MRS) and brain volumetry in the progression from MCI to AD and to explore the correlations with clinical variables.Methods
Thirty-eight MCI patients (20 males; age, mean + standard deviation = 73.87 + 7.44), eighteen healthy older adults (10 males; age 65.44 + 9.49) and twenty-three AD patients (13 males; age 71.13 + 9.48) were included in this study. All participants underwent a brain-MR protocol (1.5T GE scanner) including high-resolution T1-weighted volumetric sequence (isotropic 1mm3). Voxel-wise differences in brain volumetry were evaluated using FreeSurfer software and all volumes were normalized by the total intracranial volume (TIV) of each participant. Proton MR spectra were acquired using the point-resolved spectroscopy (PRESS) single voxel (TR=4000ms; TE=35ms; NEX=128; Volume =8ml). Careful localization of 1H-MRS volume of Posterior Cingulate Cortex (PCC) was performed; data were processed with the LCModel program (Figure 1). MCI patients underwent a complete neuropsychological assessment at baseline and were clinically re-evaluated after a mean of 28 months. We tested the normal distribution of all parameters using Shapiro Wilk test, and the non-parametric Kruskal–Wallis test followed by a Bonferroni post-hoc test for multiple comparisons was used for all analyses. For each parameter that was able to discriminate converter from non-converter MCI receiver operating characteristics (ROC) curve analysis was also performed in order to determine specificity, sensitivity and the level of accuracy. Furthermore, to assess the association between metabolite ratios, brain volumetry and cognitive functions we performed Spearman’s correlations between all variables. Statistical significance was set at p < 0.05 and all analysis were performed by IBM SPSS v.22.Results
After a mean follow-up of 28 months, 26 MCI patients (68.4%) converted to AD. At baseline the two MCI subgroups (converter and non-converter) did not differ in the global cognitive level (MMSE) or in any of the other cognitive domains (Figure 2). The (NAA+NAAG)/Ml ratio in the PCC differentiates healthy older adults from MCI (p = 0.011), MCI patients from AD (p = 0.038) and was also able to discriminate at baseline MCI converters from those MCI that did not develope AD (p = 0.022). ROC curve analysis showed an overall accuracy of 79% with 75% sensitivity and 76.9% specificity. The positive predictive value (PPV) was 80.7% and negative predictive value (NPV) was 75% (Figure 3). We also found volume differences between the three groups in several temporo-parietal areas, however, only the parahippocampal gyrus (p=0.010) with an accuracy of 84.2%, sensitivity of 83.3%, specificity of 84.6% (Figure 4) and the fusiform gyrus (p=0.026) with an accuracy of 73.6%, sensitivity of 75%, and specificity of 73.1% were able to discriminate converter from non-converter MCI (Figure 5). The Spearman’s rank test showed a significant correlation between the parahippocampal gyrus and two measures of memory, specifically verbal short-term memory (r = 0.35, P = 0.035) and verbal long-term memory (r = 0.34, P = 0.039). The scores obtained in the short-term memory task also correlated with the fusiform gyrus (r = 0.34, P= 0.039). No significant correlations were found between metabolite ratios and cognitive functioning.Discussion
Alterations of metabolite levels of PCC and brain volumetric reduction in temporal areas showed high accuracy in predicting the progression from MCI to AD two years before the development of clinical symptoms. These results provide further support for those emerging post-mortem studies that explore this temporal dissociation between the neuropathological and clinical changes3. Additional longitudinal studies with longer follow-ups and larger samples are needed to confirm these results and to elucidate the role of each parameter in predicting the possible progression to AD, but also to all the other non-AD dementia subtypes.Conclusion
Conversion to dementia is a primary outcome measure in interventional clinical trials and predictors of time to conversion may serve as ‘surrogate endpoints’. Furthermore, predictors of AD are also of pivotal importance in clinical practice by assisting clinicians during patient work-up.Acknowledgements
No acknowledgement found.References
1. Albert MS, DeKosky ST, Dickson D, et al. The diagnosis of mild cognitive impairment due to Alzheimer's disease: recommendations from the National Institute on Aging-Alzheimer's Association workgroups on diagnostic guidelines for Alzheimer's disease. Alzheimers Dement. 2011;7(3):270–279. 2.
2. Mitchell AJ, Shiri-Feshki M. Rate of progression of mild cognitive impairment to dementia- meta-analysis of 41 robust inception cohort studies. Acta Psychiatr Scand. 2009;119(4):252–265 3.
3. Suemoto CK, Ferretti-Rebusti REL, Rodriguez RD, et al. Neuropathological diagnoses and clinical correlates in older adults in Brazil: A cross-sectional study. PLoS Med. 2017;14(3):e1002267.
Figures
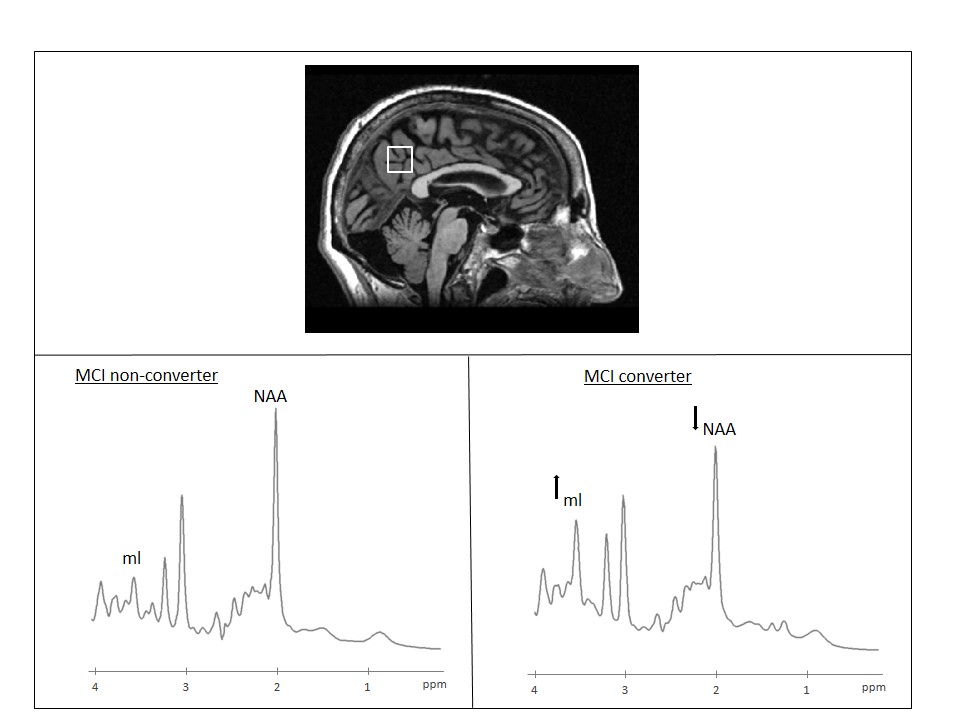
Figure 1
Above. Example voxel localization projected onto sagittal plane of subject’s own T1-W image. Below Example 1H-MRS spectra indicating resonance of interest (NAA: N-acetyl aspartate; ml: myo-inositol). Left: MCI non-converter, right: MCI-to-AD converter.
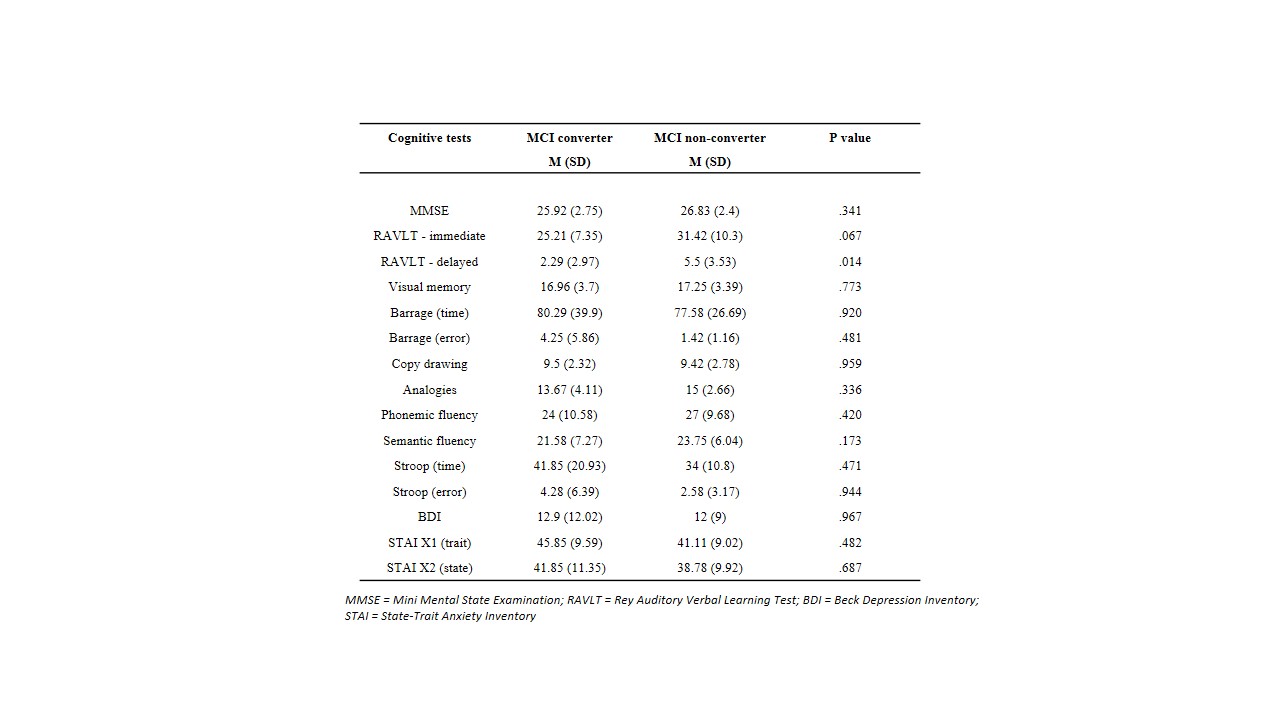
Figure 2
Neuropsychological data of MCI converter vs non-converter subgroups at baseline (group comparison: Mann Whitney U test). Due to multiple comparison correction, P < 0.003 is considered significant.

Figure 3
ROC curve for baseline (NAA+NAAG)/ml as a predictor of conversion from MCI to AD.
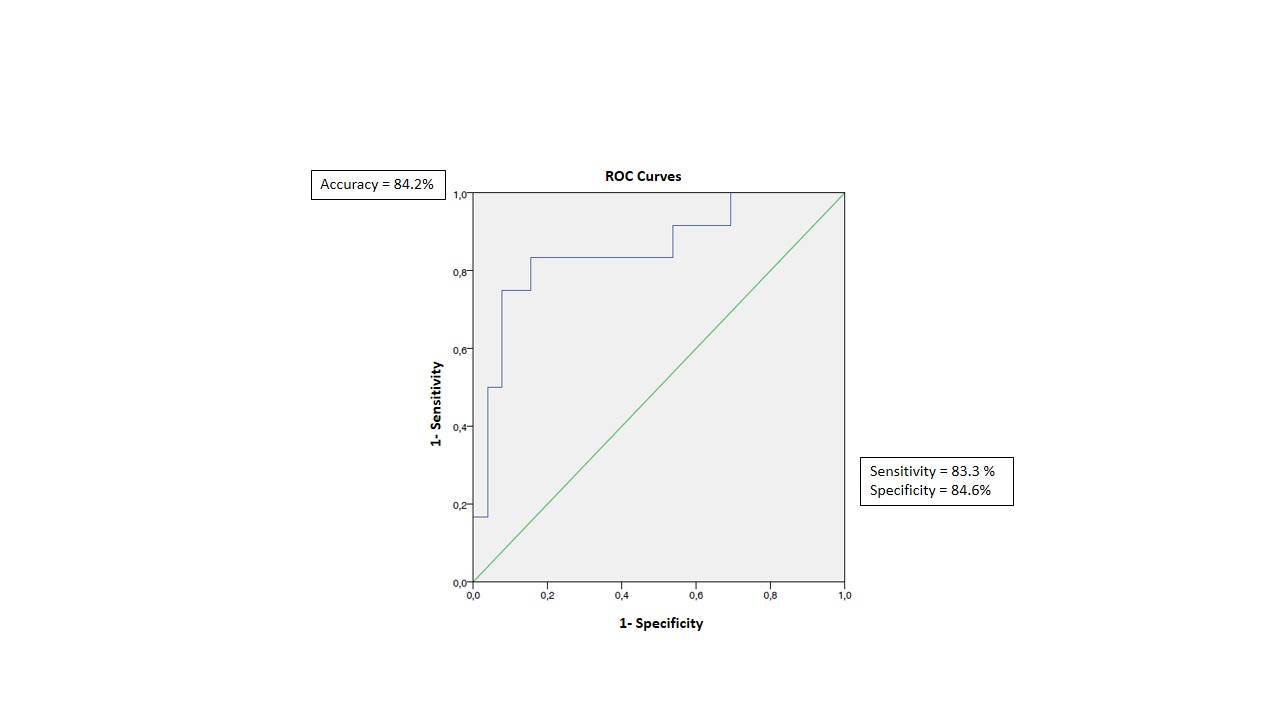
Figure 4
ROC curve for baseline brain
volumetry (parahippocampal gyrus) as a predictor of conversion from MCI to
AD.

Figure 5
ROC curve for baseline brain volumetry (fusiform gyrus) as a predictor of conversion from MCI to AD.