0722
Diffusion MRI Detects and Differentiates Inflammation from Cancer Cells in Prostate Cancer Patients1Radiology, Washington University School of Medicine, St. Louis, MO, United States, 2Radiology, Changhai Hospital, Shanghai, China
Synopsis
Recent consensus suggested PCa detection based on mpMRI lacks necessary sensitivity or specificity to differentiate prostatitis from PCa, which results in over-diagnosis and over-treatment. Our novel method, diffusion MRI histology (D-Histo), demonstrated its ability to accurately localize, quantify and distinguish between PCa and prostatitis. D-Histo’s improved diagnosis accuracy could more effectively guide treatment planning and assess treatment efficacy.
Introduction
Prostate cancer (PCa) is the leading malignancy and second most common cause of death for American man.1 The standard ultrasound-guided needle biopsy misses 20-30% of clinically significant tumors. Multiparametric MRI (mpMRI) has been subsequently employed in clinical settings to aid PCa diagnosis, to guide biopsy and follow-up with patient. Yet mpMRI-aided PCa diagnoses resulted a significant false positive rate. The misdiagnoses are likely caused by confounding prostatitis or stromal BPH, both exhibiting similar signatures as those in malignancies in DWI. We demonstrate herein inflammatory (~ 5 µm) and cancer cells (≥ 20 µm) in prostate can be detected, distinguished, and quantified via their distinct restricted-isotropic diffusion signatures using the novel Diffusion MRI Histology (D-Histo, a significantly improved version of previously known diffusion basis spectrum imaging2) technique.
Methods and Materials
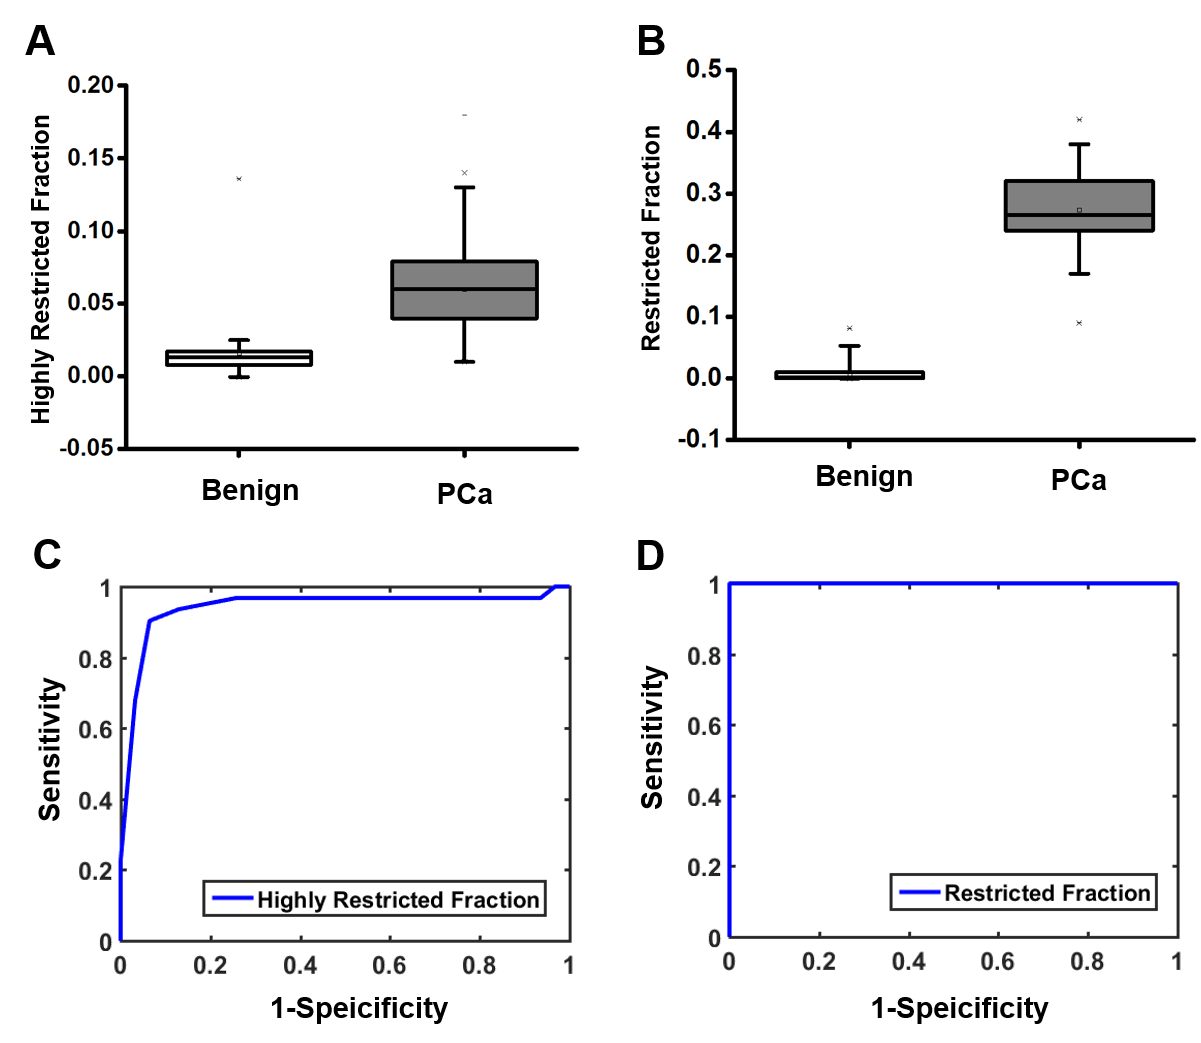
Patient recruitment: 179 patients with clinical suspicion of prostate cancer and without any preoperative treatment were recruited and scheduled for mpMRI and D-Histo scan in Changhai Hospital, Shanghai, China. Additionally, 6 patients scheduled for prostatectomy were recruited for ex vivo specimen imaging study at Washington University School of Medicine, St. Louis, USA. In vivo MRI: diffusion-weighted MRI data were obtained on a 3T Siemens Skyra scanner with an 18-channel phased-array body receive coil. Single-shot echo-planar diffusion-weighted imaging was performed in transverse view (2×2×4 mm3) using a 25-direction encoding scheme (maximum b-value of 1500 s/mm2) in 8 minutes. Ex vivo MRI: Prostate specimens were examined using a 4.7T Varian MR scanner and a home-made surface coil. A spin-echo diffusion-weighted sequence with 25 diffusion-encoding directions with maximum b-values of 3000 s/mm2 was employed to acquire DWI (in-plane resolution 0.25x0.25x0.5 mm3) in 80 minutes. Histology: Prostate specimen was embedded in paraffin and sectioned in 4-µm-thick slices for H&E staining after prostatectomy. Image analysis: An in-house software analyzed both D-Histo and DTI data. H&E slices were reviewed and graded by an experienced pathologist. Statistical analysis: Student t-test and receiver operating characteristic analysis on the ability of DTI and D-Histo to differentiate benign tissue from PCa was performed.Results
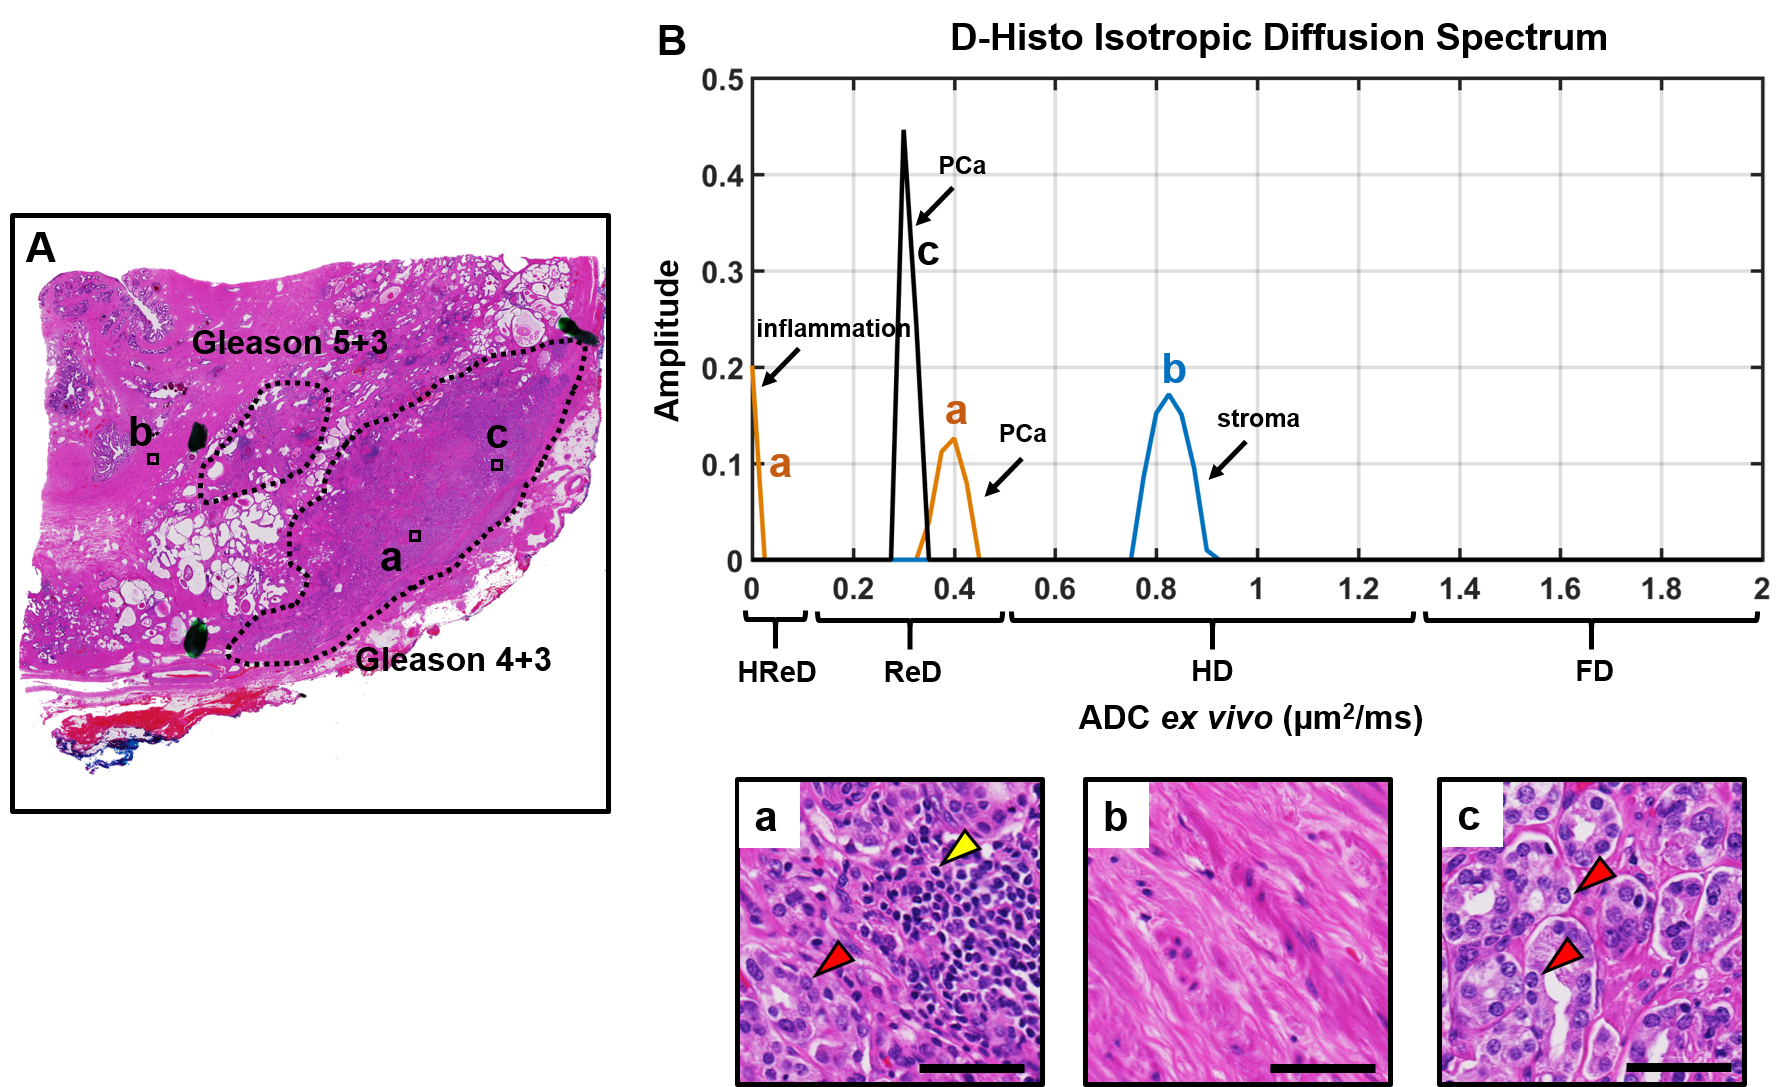
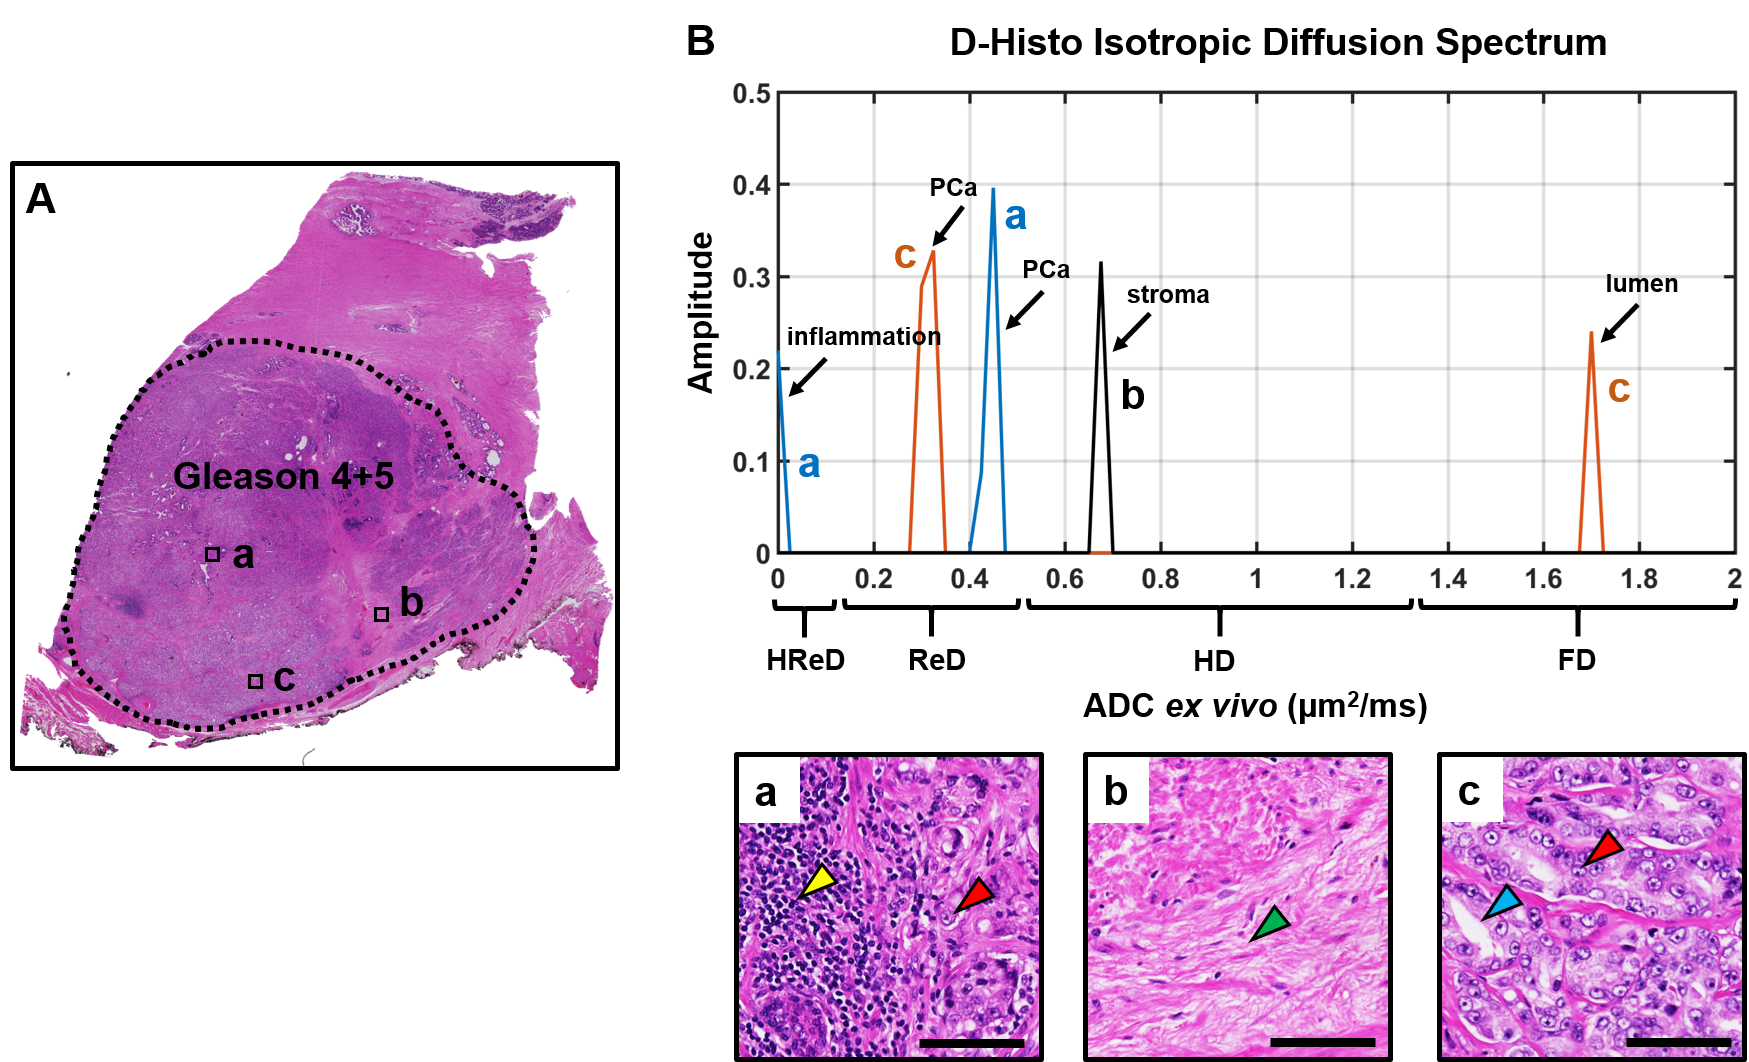
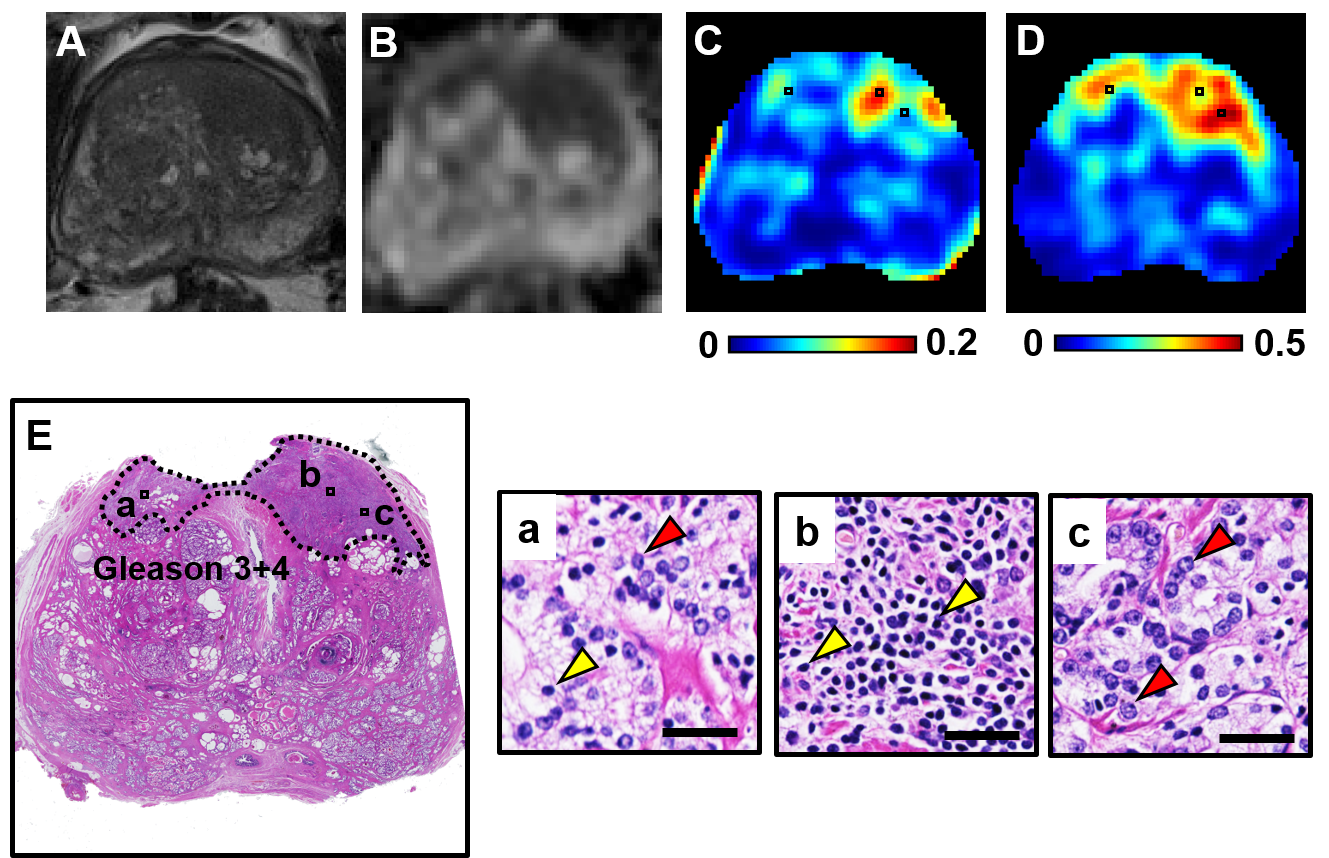
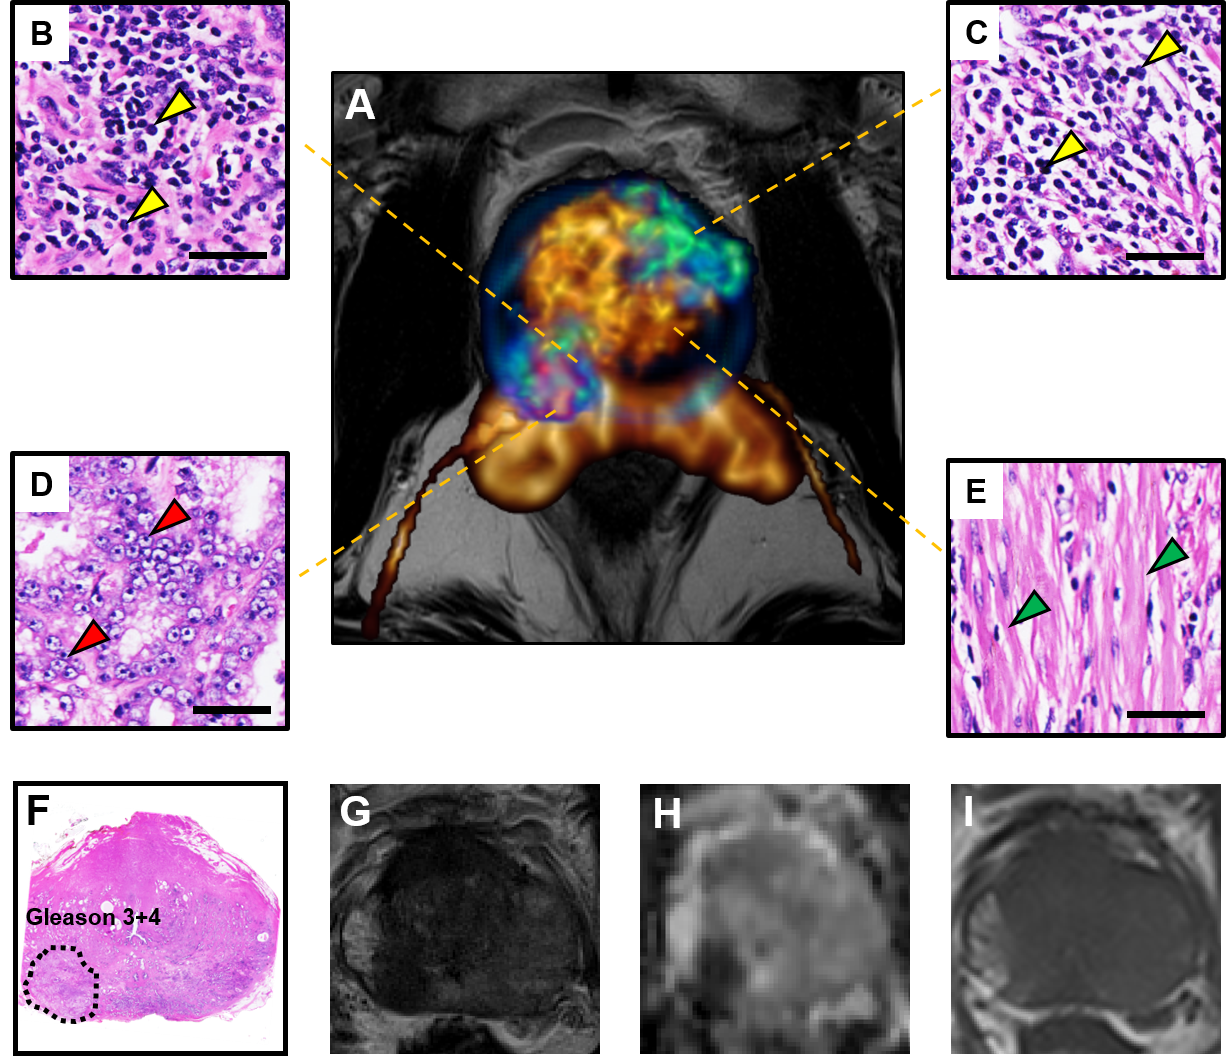
D-Histo isotropic-diffusion spectrum (ex vivo) successfully detected and distinguished between various pathologies in a specimen (Fig. 1A) from a 66-year-old patient. The hallmarks of inflammation, PCa and stromal tissues corresponded to highly-restricted diffusion (Fig. 1B, 0 – 0.1 mm2/ms), restricted diffusion (Fig. 1B, 0.1 – 0.5 mm2/ms) and hindered diffusion (Fig. 1B, 0.5 – 1 mm2/ms), respectively. Magnified H&E of inflammatory cells, PCa cells and stroma (Fig. 1a, b, c) confirmed the findings. D-Histo also identified inflammatory cells, PCa cells and stroma (Fig. 2B) in PCa region from another 70-year-old patient (Fig. 2A). Magnified H&E of corresponding regions (Fig. 2a, b, c) supported the findings in isotropic-diffusion spectrum. The hypo-intensity regions in T2WI (Fig. 3A) and ADC maps (Fig. 3B) from a 65-year-old patient indicated a prostate with transition zone PCa. D-Histo highly-restricted-fraction map and restricted-fraction map (Fig. 3C, D) revealed the distribution of inflammatory and PCa cells in the corresponding areas; this distinction is absent in ADC map. H&E staining of the prostatectomy specimen revealed areas of inflammatory and PCa cells consistent with those indicated by D-Histo (Fig. 3a, b, c). A 3D-rendered prostate from D-Histo was overlaid on an anatomical T2WI obtained from a 58-year old PCa patient in stage T3A (Fig 4A). PCa suspicion was located in the peripheral zone (pink). Transition zone BPH (gold) and peripheral zone inflammation (blue-green) were also delineated. H&E staining of corresponding whole-mount-section slide showed chronic prostatitis (Fig. 4B, CH), PCa (Fig. 4D), and stromal BPH (Fig. 4E), which were consistent with D-Histo results. Representative mpMRI including T2WI and ADC map (Fig. 4G, H) detected PCa without seeing inflammation. Gd-enhanced T1WI failed to detect PCa (Fig. 4I). We identified 222 PCa regions from 56 biopsy-confirmed PCa patients and 59 benign peripheral zone tissues from 59 biopsy-negative patients through mpMRI. Highly-restricted fraction and restricted-fraction values of PCa regions (highly-restricted: 0.06±0.02, and restricted: 0.27±0.07) were significantly higher (p < 0.001) than those of benign regions (highly-restricted: 0.02±0.02, and restricted: 0.01±0.02). ROC analysis (Fig. 5C, D) revealed high sensitivity and specificity for highly-restricted (AUC: 0.942) and restricted fractions (AUC: 1), differentiating inflammatory cells or PCa cells from benign tissue.Discussion and Conclusion
Coexisting PCa and prostatitis were noninvasively quantified and differentiated with D-Histo technique and verified by histology in both ex vivo and in vivo conditions for the first time. Accurate localization and quantification of prostate pathologies and structures by D-Histo resolves the unmet needs in PCa imaging. D-Histo shows potential to a more accurate monitoring and evaluation of immunotherapy for PCa.Acknowledgements
No acknowledgement found.References
1. Society AC. Cancer Facts & Figures 2016. 2016; http://www.cancer.org/research/cancerfactsstatistics/cancerfactsfigures2016/index.
2. Wang Y, Wang Q, Haldar JP, et al. Quantification of increased cellularity during inflammatory demyelination. Brain : a journal of neurology. Dec 2011;134(Pt 12):3590-3601.
Figures