0721
Quantitative mDixon Fat Fraction can differentiate metastatic nodes from benign nodes in prostate cancer patients.1Centre of Medical Imaging, UCL, London, United Kingdom, 2Nuclear Medicine, UCLH, London, United Kingdom, 3Physics, UCL, London, United Kingdom, 4Centre for Medical Imaging, UCL, London, United Kingdom
Synopsis
Metastatic nodes in prostate cancer are associated with poor prognosis. Conventional MRI, relying on short-axis diameter (SAD) suffers from poor accuracy in identifying metastatic nodes. In this study, we compare fat fraction signal from MRI mDixon acquisitions (FF) with apparent diffusion coefficients of nodes and quantitative contrast-enhanced two-point mDixon T1 images (CE-mDixon), in discriminating between benign and metastatic nodes using 18F-Choline PET-CT as reference standard. We showed that FF and CE-mDixon discriminate benign from involved lymph nodes that are small in size unlike SAD or ADC of nodes; FF, not necessitating contrast agents, holds promise as a clinical tool.
Introduction
Identifying metastatic nodes in prostate cancer patients is essential as lymph node involvement is associated with poor prognosis (1). Conventional MRI, relying on morphological aspects of nodes, particularly short-axis diameter (SAD) as a measure of size, or the ratio of short-to-long axis diameter (SAD/LAD) as a measure of shape, to discriminate between normal and metastatic nodes, suffers from poor accuracy (2, 3). Apparent diffusion coefficient (ADC) of nodes in MRI has been previously assessed with conflicting accuracy results (4-7). Qualitative assessment of the absence of a fatty hilum in involved nodes may be useful (8) but quantitative MRI fat measurements data are lacking as well as quantitative contrast-enhanced MRI characteristics which may improve staging performance.
In a previous pilot study, we demonstrated that quantitative MRI mDixon signal fat fraction (FF) measurements calculated from ROI signal intensity (SI) as SIfat / (SIwater + SIfat), in pelvic lymph nodes may discriminate involved and benign nodes using 18F-Choline PET-CT as a reference standard (9). To consolidate this finding, we also showed that FF in pelvic lymph nodes are highly repeatable in healthy volunteers with very similar mean FF values between scan and rescan MRI studies (10). In this study, we aimed to compare mDixon FF with apparent diffusion coefficient (ADC), mean signal intensity (mSI) of contrast-enhanced T1W two-point mDixon imaging and with morphological parameters of nodes such as SAD and SAD/LAD to discriminate between benign and involved nodes in prostate cancer patients.
Methods
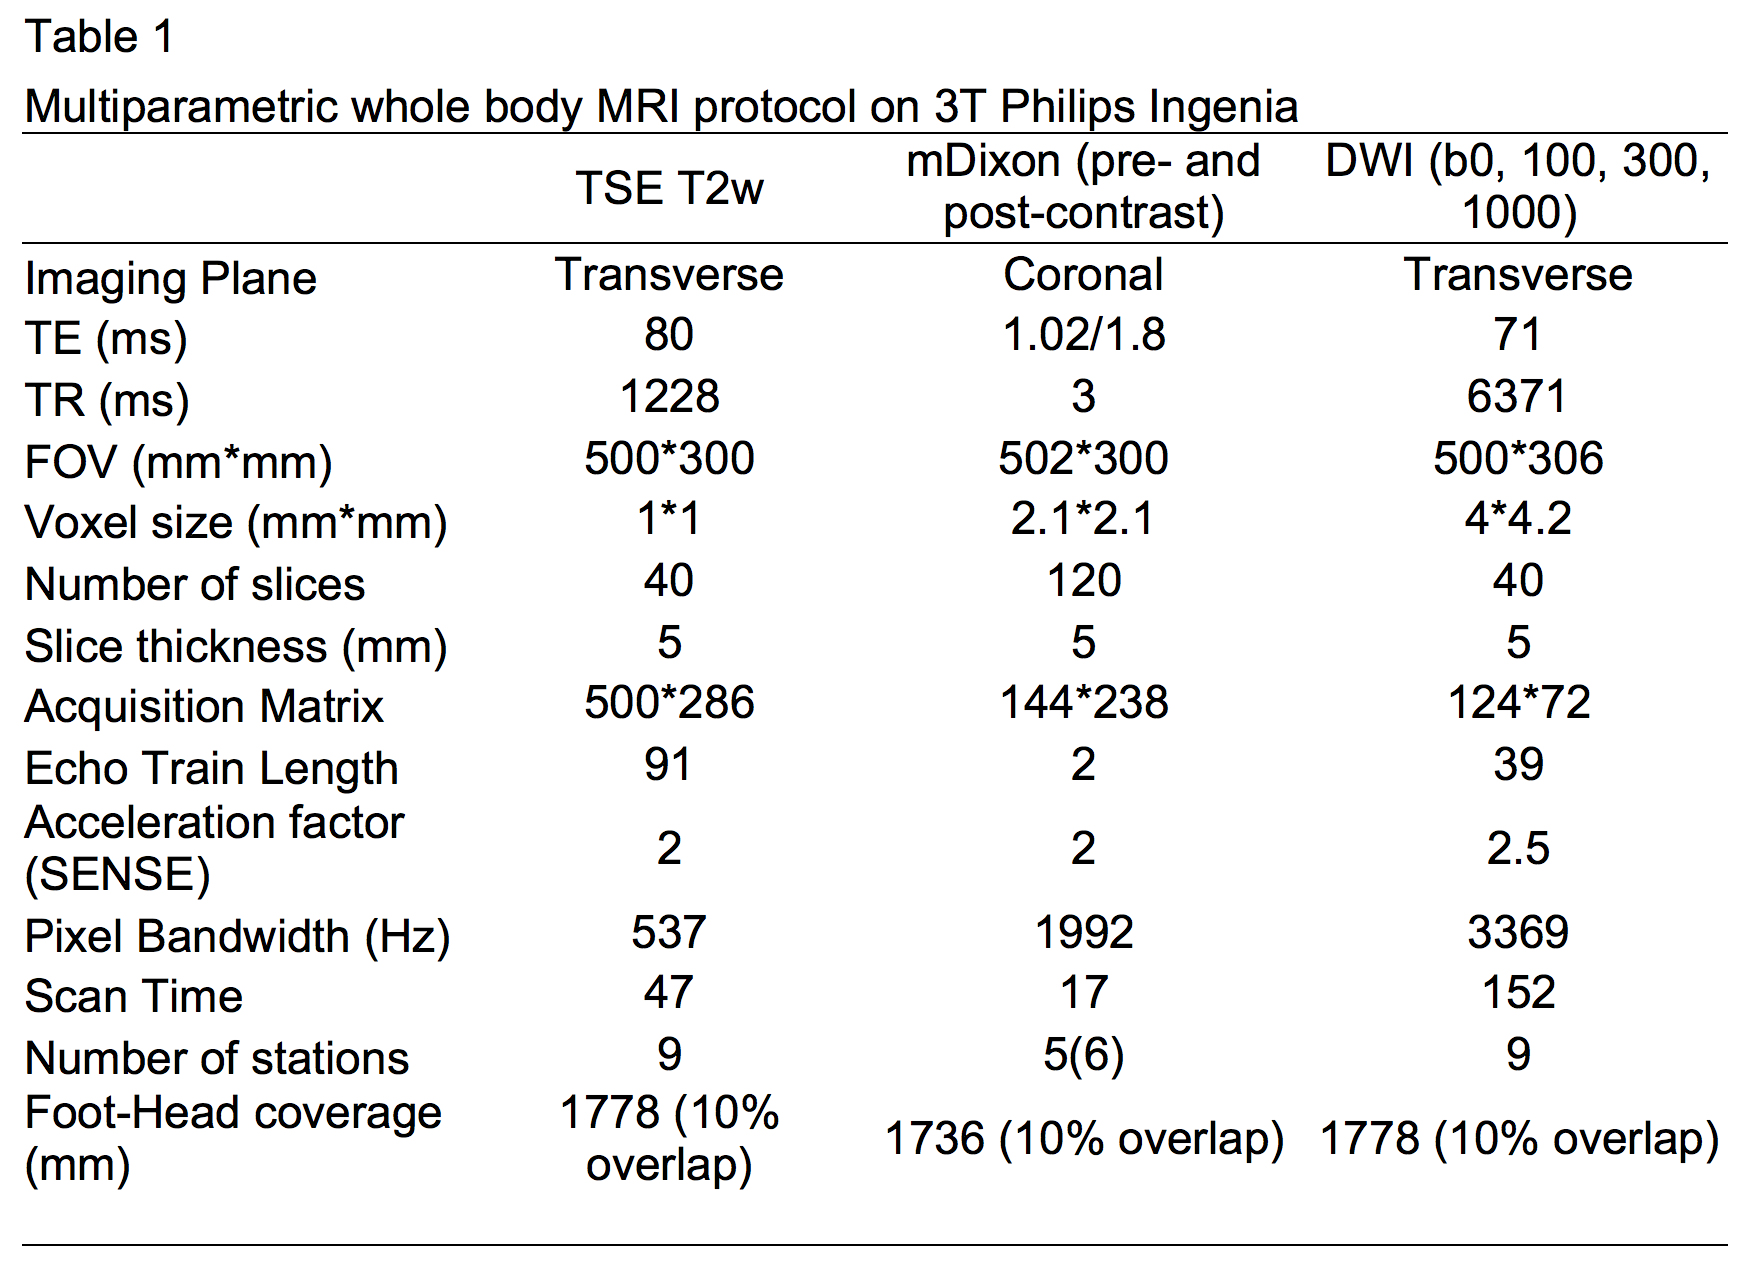
FF was analysed from a dataset of intermediate and high-risk biopsy-proven prostate cancer patients who underwent both whole-body MRI (as per MRI protocol in Table 1) and 18F-fluorocholine PET-CT from vertex to mid-thigh as per institutional protocol (11). Eleven patients [median age of 64 years (range 61-72) and median PSA of 60.0 (range 37-170)] were identified.
A board-certified radiologist blinded to clinical and 18F-fluorocholine PET-CT data, manually contoured normal and abnormal nodes on MRI considering each of the following pelvic node stations: para-aortic, common iliac, proximal internal iliac, external iliac, obturator, pre-sacral and inguinal. Nodes were drawn on T2-weighted images and correspondingly on pre-and post-contrast two-point mDixon sequences and ADC maps (derived from diffusion-weighted b-values of 0,100, 300 and 1000 mm/s2).
Forty-three nodes were contoured and the following metrics were obtained for each node: SAD, SAD/LAD, mean T2 signal intensity (SI) normalised to the bladder (nT2SI)(12), mean ADC, mean FF, mean SI on contrast-enhanced mDixon in-phase (CE-IP) and out-of-phase (CE-OP). The nodes were divided into PET positive and PET negative groups according to reference standard 18F-fluorocholine PET-CT.
Each parameter was compared between the two groups using unpaired t-test with Welch’s correction. Only nodes with SAD<15mm were analysed for quantitative MRI parameters (13).
Results
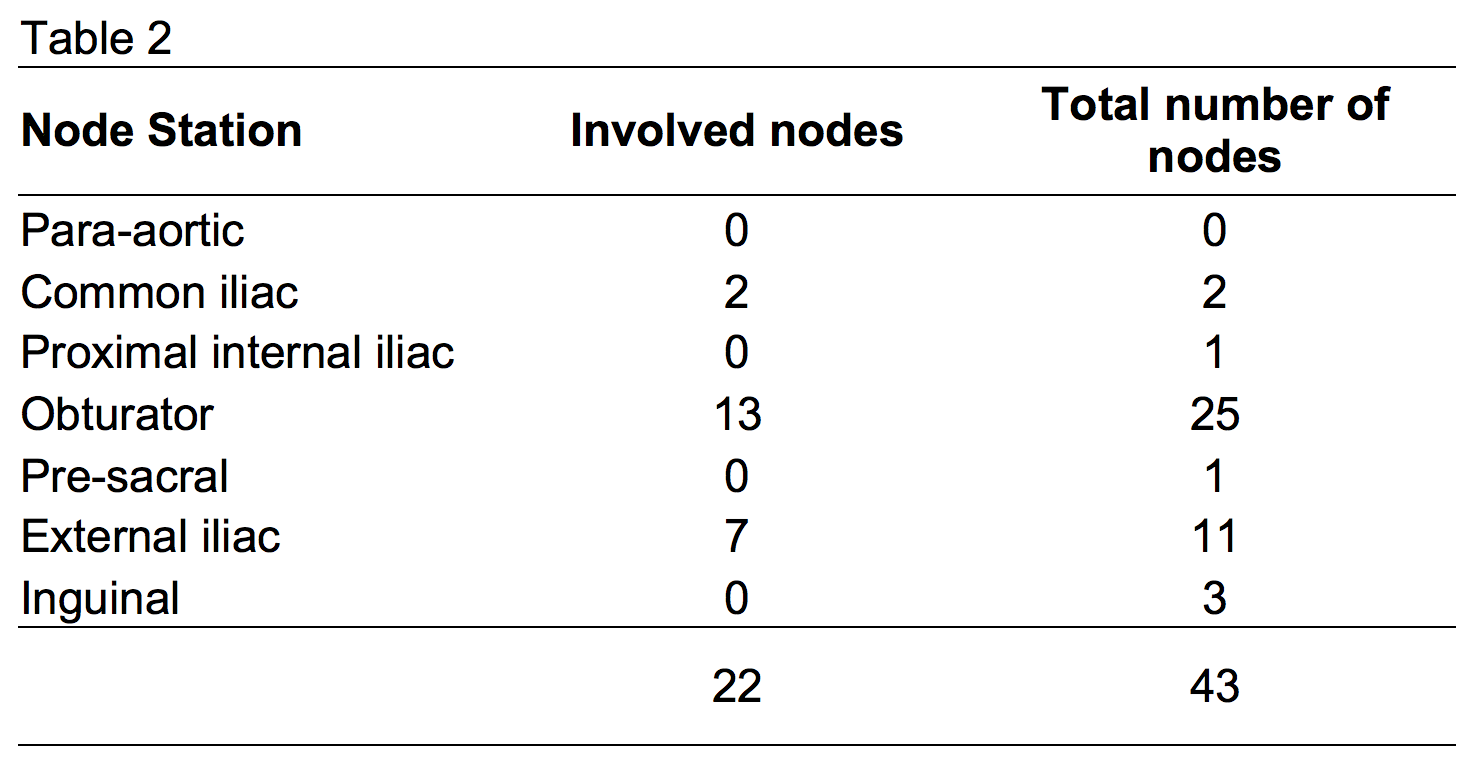
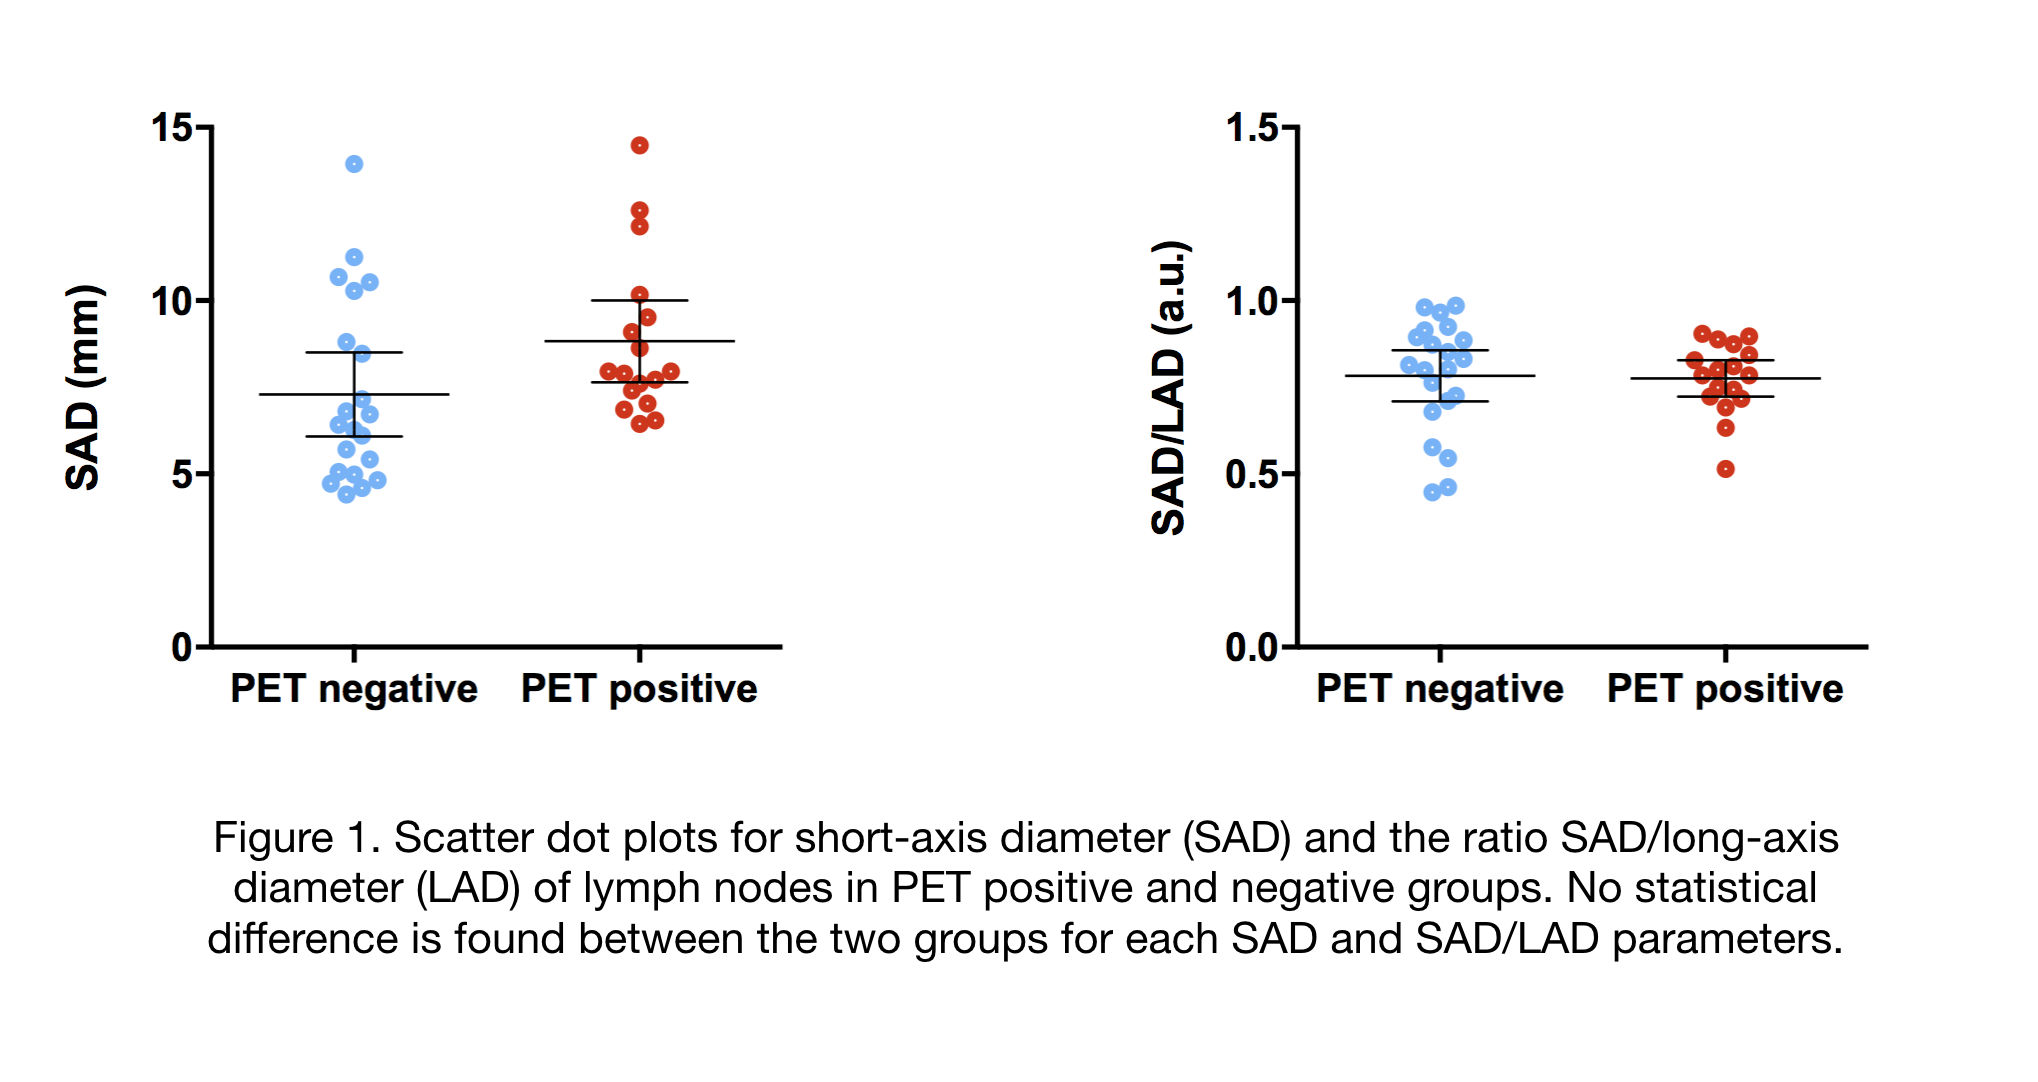
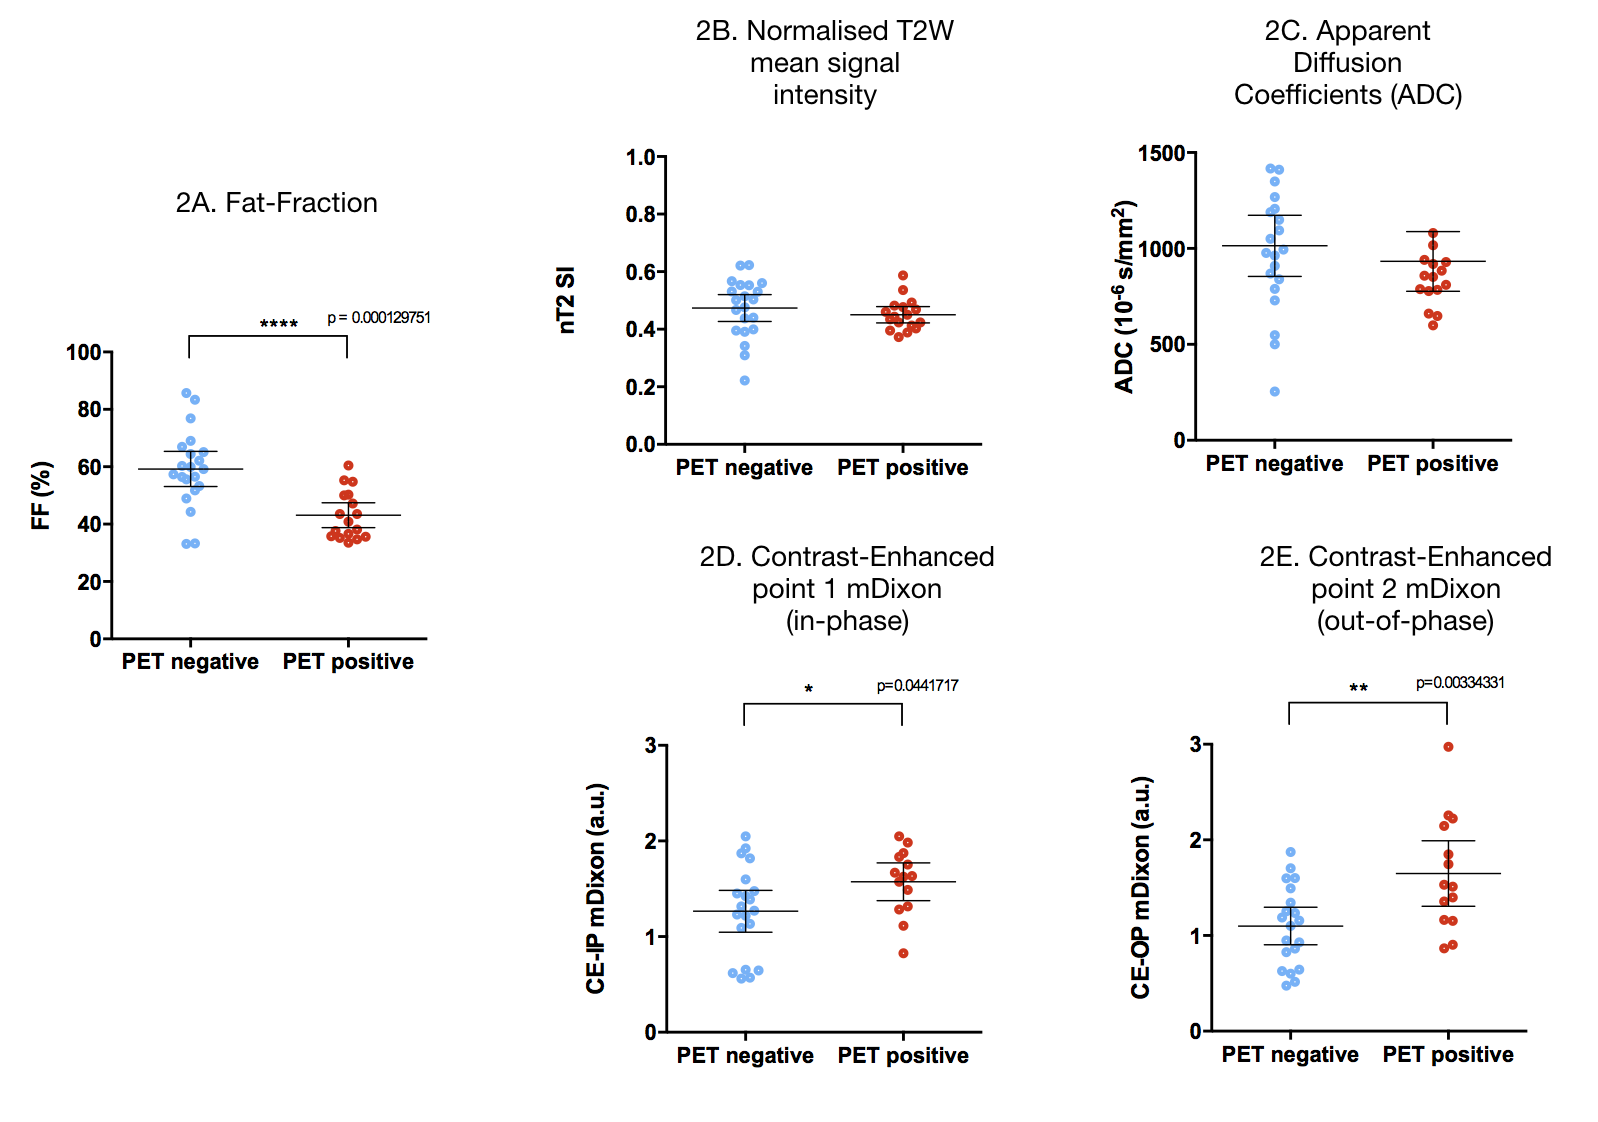
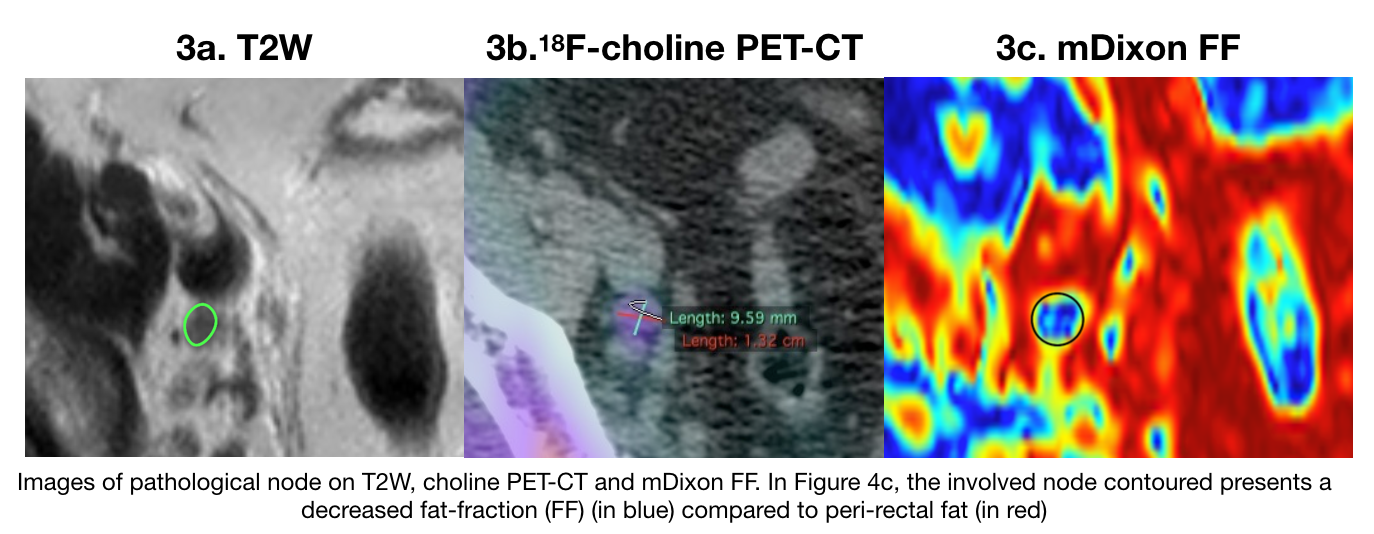
Of 43 nodes, 22 nodes were identified as PET-positive. The distribution of involved nodes in different stations is summarized in Table 2. Five nodes were >15mm and five >10mm. The mean FF was lower in PET-positive (mean FF= 43.1%) than in PET-negative (mean FF= 59.2%) nodes (p<0.001). Mean SI from CE-OP mDixon images was higher in PET-positive nodes (mSIOP = 1.64) versus (mSIOP = 1.09) in PET-negative nodes (p= 0.003). No statistical difference was found in either nT2SI, ADC values, SAD or SAD/LAD measurements between groups. These results are shown in Figures 1 and 2. Figure 3 illustrates an example of a pathological node on T2W, 18F-fluorocholine PET-CT and mDixon FF map.Discussion
Our study shows that FF of nodes can distinguish pathological nodes from normal ones unlike short-axis diameter, ratio of short-to-long axis measurements or ADC values. Involved nodes show enhancement on CE-OP mDixon images with statistically higher mean signal intensities than benign nodes.
Our findings are in accordance with previous studies demonstrating the poor discriminating performance of nodal size (2) or shape and ADC of in metastatic pelvic nodes (6). Overlap of ADC values in benign and malignant nodes could be due to the small-sized nodes. However, the decreasing quantitative FF in involved nodes is in keeping with the qualitative description of the loss of a fatty hilum in pathological nodes described in other cancers (14, 15). We have also shown that involved nodes show enhancement on CE-OP mDixon. Whilst this necessitates the use contrast agent, FF measurement confers the advantage of not using any.
Conclusion
FF in pelvic nodes can reliably discriminate metastatic nodes in prostate cancer. Prospective trials in larger cohorts are required to validate nodal FF measurements.Acknowledgements
This research was supported by grants the Comprehensive Cancer Imaging Centre, the UCLH Biomedical Research Centre, Prostate Cancer UK and London Cancer Alliance.
References
1. Eggener SE, Scardino PT, Walsh PC, Han M, Partin AW, Trock BJ, et al. Predicting 15-year prostate cancer specific mortality after radical prostatectomy. J Urol. 2011;185(3):869-75.
2. McMahon CJ, Rofsky NM, Pedrosa I. Lymphatic metastases from pelvic tumors: anatomic classification, characterization, and staging. Radiology. 2010;254(1):31-46.
3. Kiss B, Thoeny HC, Studer UE. Current Status of Lymph Node Imaging in Bladder and Prostate Cancer. Urology. 2016;96:1-7.
4. Eiber M, Beer AJ, Holzapfel K, Tauber R, Ganter C, Weirich G, et al. Preliminary results for characterization of pelvic lymph nodes in patients with prostate cancer by diffusion-weighted MR-imaging. Invest Radiol. 2010;45(1):15-23.
5. Roy C, Bierry G, Matau A, Bazille G, Pasquali R. Value of diffusion-weighted imaging to detect small malignant pelvic lymph nodes at 3 T. Eur Radiol. 2010;20(8):1803-11.
6. Thoeny HC, Froehlich JM, Triantafyllou M, Huesler J, Bains LJ, Vermathen P, et al. Metastases in normal-sized pelvic lymph nodes: detection with diffusion-weighted MR imaging. Radiology. 2014;273(1):125-35.
7. Vallini V, Ortori S, Boraschi P, Manassero F, Gabelloni M, Faggioni L, et al. Staging of pelvic lymph nodes in patients with prostate cancer: Usefulness of multiple b value SE-EPI diffusion-weighted imaging on a 3.0 T MR system. Eur J Radiol Open. 2016;3:16-21.
8. Ganeshalingam S, Koh DM. Nodal staging. Cancer Imaging. 2009;9:104-11.
9. Lamanna G, Tabouret-Viaud C, Rager O, Jorcano S, Vees HJ, Seimbille Y, et al. Long-term Results of a Comparative PET/CT and PET/MRI Study of 11C-Acetate and 18F-Fluorocholine for Restaging of Early Recurrent Prostate Cancer. Clin Nucl Med. 2017;42(5):e242-e6.
10. O’Callaghan J, Johnston EW, Latifoltojar A, Sidhu H, Ramachandran N, Sokolska M, et al., editors. Improved lymph node staging using MRI mDixon fat fraction measurements in patients with intermediate and high-risk prostate cancer. The International Society for Magnetic Resonance in Medicine; 2017; Honolulu, Hawai’i.
11. Haroon A, Zanoni L, Celli M, Zakavi R, Beheshti M, Langsteger W, et al. Multicenter study evaluating extraprostatic uptake of 11C-choline, 18F-methylcholine, and 18F-ethylcholine in male patients: physiological distribution, statistical differences, imaging pearls, and normal variants. Nucl Med Commun. 2015;36(11):1065-75.
12. Johnston E, Punwani S. Can We Improve the Reproducibility of Quantitative Multiparametric Prostate MR Imaging Metrics? Radiology. 2016;281(2):652-3.
13. Grey AC, Carrington BM, Hulse PA, Swindell R, Yates W. Magnetic resonance appearance of normal inguinal nodes. Clin Radiol. 2000;55(2):124-30.
14. Lee HW, Kim SH. Breast Magnetic Resonance Imaging for Assessment of Internal Mammary Lymph Node Status in Breast Cancer. J Breast Cancer. 2016;19(2):191-8.
15. Kataoka MY, Sala E, Baldwin P, Reinhold C, Farhadi A, Hudolin T, et al. The accuracy of magnetic resonance imaging in staging of vulvar cancer: a retrospective multi-centre study. Gynecol Oncol. 2010;117(1):82-7.
Figures