0717
Delineation accuracy of prostate cancer for focal therapy: comparison of MR imaging and histopathology characteristics1Radiation Oncology, the Netherlands Cancer Institute, Amsterdam, Netherlands, 2Radiology, the Netherlands Cancer Institute, Amsterdam, Netherlands, 3Pathology, the Netherlands Cancer Institute, Amsterdam, Netherlands, 4Urology, the Netherlands Cancer Institute, Amsterdam, Netherlands, 5Medical Physics, Aarhus University Hospital, Aarhus, Denmark, 6Oncology, Aarhus University Hospital, Aarhus, Denmark, 7Radiation Oncology, University Hospitals Leuven, Leuven, Belgium
Synopsis
The success of any focal therapy for prostate cancer relies on accurate tumor detection and delineation. Currently there are no guidelines for delineation of prostate tumors. In this study we showed that radiologists are better in delineating parts of tumors with Gleason pattern 4 and 5 than Gleason pattern 3, but still the sensitivity (0.56) needs to be improved for focal therapy and volume estimation.
Introduction
Accurate tumor delineation is a requirement for focal therapy of prostate cancer. However, currently there are no guidelines for this specific task. For example, the PI-RADs v2 guidelines1 aim for tumor detection instead of delineation. In this study, we explored why some parts of a tumor are detected and some are missed when using PI-RADS v2 guidelines for delineation. For this purpose, we used the correspondence between imaging and histopathology with high-resolution Gleason pattern (GP) segmentations.Methods
Thirty patients with biopsy-proven prostate cancer underwent an MRI exam prior to radical prostatectomy in three institutes (3T: n=13 and n=6, 1.5T: n=11). Each protocol consisted of a transversal T2-weighted sequence (voxel size 0.4x0.4x3/0.6x0.6x3 mm3), a T1-weighted sequence, a diffusion weighted scan (b-values 200 and 1000 s/mm2) with an apparent diffusion coefficient (ADC) map, a multi-echo spin echo sequence to estimate a T2 map2, and a dynamic-contrast enhanced scan. Pharmacokinetic maps (Ktrans, kep, and ve ) were created with the one-compartment Tofts model3.
Two radiologists with 14 and 6 years of experience in interpreting prostate MRI, delineated tumors according to PI-RADS v2. Interobserver agreement was assessed by Cohen’s kappa. We used the overlap between the delineations for further analysis. If there was no overlap in tumor location, consensus delineation was made.
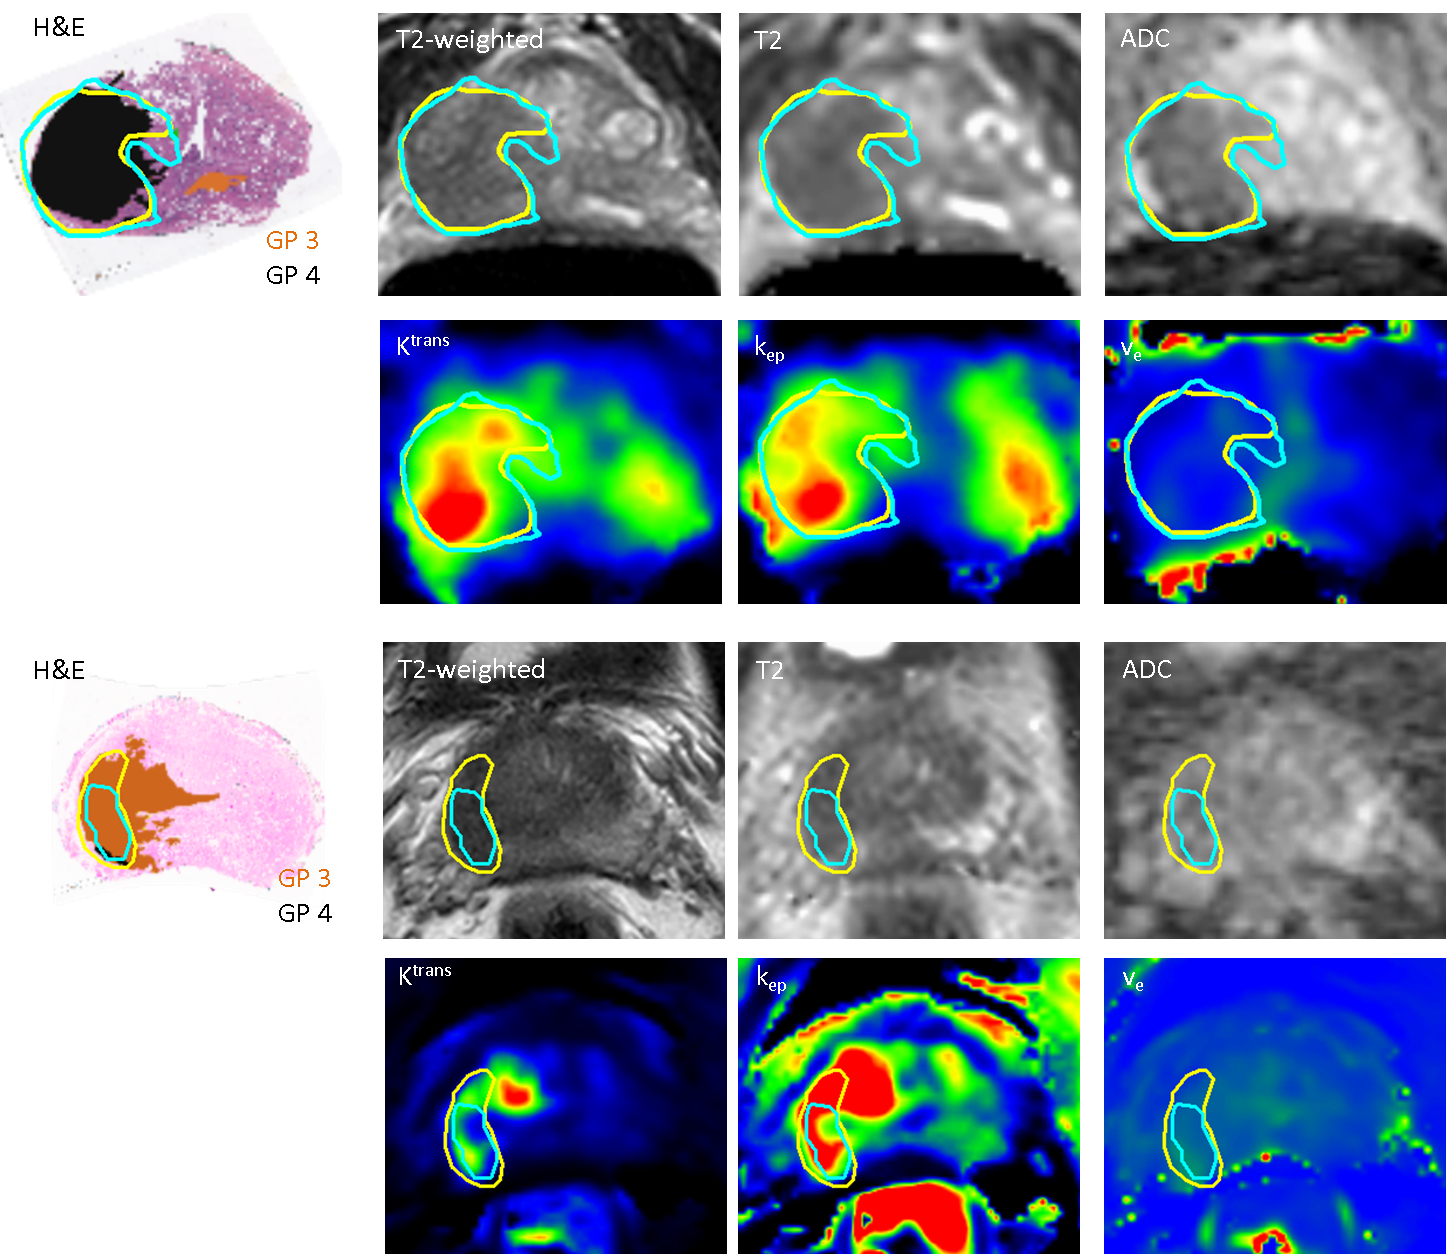
A patient-customized mold was created from the T2-weighed MRI such that the prostate samples were cut in planes parallel to the MRI slices. High-resolution segmentations of GP 3, 4, and 5 were created on the whole-mount hematoxylin and eosin (H&E) slides. The H&E slides were registered to the T2-weighed image using deformable registration based on landmark points4.
First, we estimated the sensitivity for tumor detection at tumor-level (volume > 0.5 cm3). Next, a voxel-level analysis was performed for all slices with histopathology available. Each prostate voxel on the T2-weighted MRI was classified as true positive (TP), true negative (TN), false positive (FP), or false negative (FN). We applied univariate and multivariate generalized linear mixed-effect modelling to determine which of the following fixed effects were associated with TP compared to FN voxels: GP (3 vs 4 and 5), T2, ADC, Ktrans, kep, ve, and location. For the latter, three location categories were considered relevant: (1) peripheral zone or transition zone; (2) anterior or posterior part of prostate; (3) apex, mid, or base. To account for within patient clustering, the voxel coordinates and patient numbers were included as random effects. We used the -2 log likelihood and the residuals to assess the performance of the model.
Results
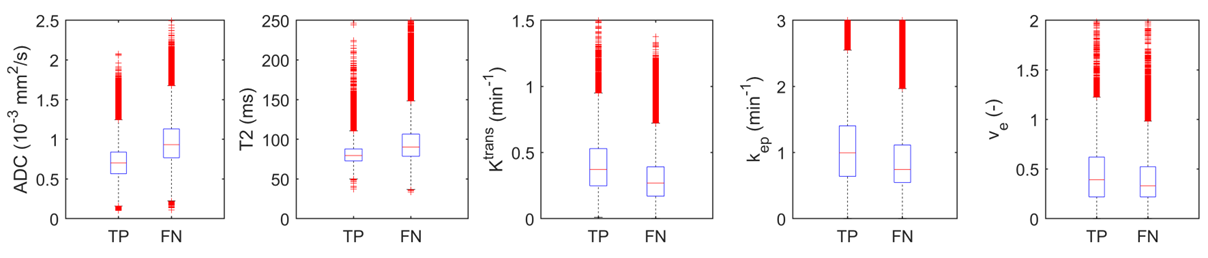
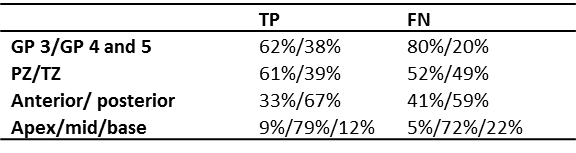
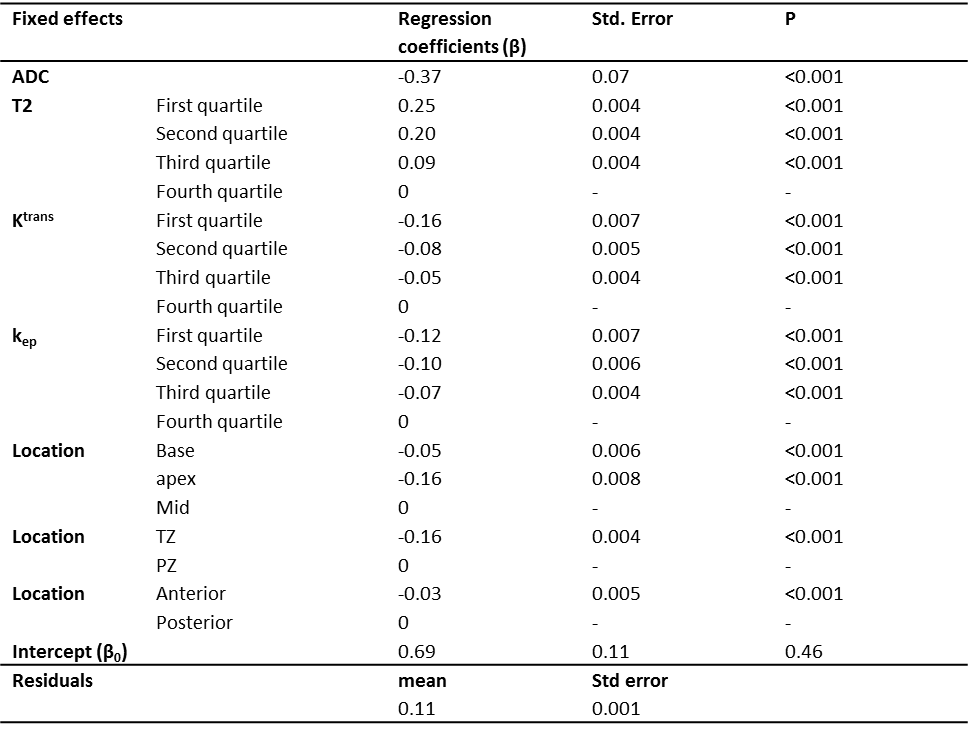
Thirty-five tumors were delineated by the radiologists with a median kappa of 0.60 (range 0.20-0.86). The sensitivity for lesion detection was 0.79. Fig. 1 shows examples of the GP segmentations and radiologists’ delineations. Of all prostate voxels 2% were classified as TP, 92% as TN, 3% as FP, and 3% as FN, resulting in a sensitivity of 0.40 and specificity of 0.96. More specifically, the sensitivity was 0.34 for detection of GP 3 and 0.56 for detection of GP 4 and 5. Fig. 2 shows the differences in imaging values for TP and FN, whereas Table 1 shows the GP and location distribution. In multivariate analyses, ADC, T2, Ktrans, kep, and location of the tumor were found to be significantly associated with an increased likelihood of detecting TP voxels (Table 2).Discussion
The success of any focal therapy relies on accurate identification and delineation of relevant tumors, not missing (large parts of) relevant tumors. Parts of tumors with GP 4 and 5 were more often correctly identified and delineated than tumor parts with GP 3, but the sensitivity is low on a voxel-level. Whether a tumor voxel is detected is mainly influenced by the imaging characteristics and by the location of the voxel. The sensitivity may be negatively influenced by inaccuracies in the imaging-histopathological registration. The visibility of tumors on multi-parameteric MRI may also be influenced by tumor size and Gleason sub-patterns.Conclusion
Good sensitivity for tumor detection was obtained by PI-RADS v2 radiological interpretation of multi-parametric MRI. Furthermore, we showed that radiologists are better in delineation of GP 4 and 5 areas than GP 3 areas, but for focal therapy and volume estimation the delineation accuracy should be improved as represented by a sensitivity of 0.56. The estimates of the multivariate analysis suggest that voxels with a low ADC, a low T2, a high Ktrans, a high kep, which are located in the peripheral zone, mid of prostate, and in posterior part of prostate have a higher chance to be detected.Acknowledgements
No acknowledgement found.References
1. Weinreb JC, Barentsz JO, Choyke PL, et al. PI-RADS Prostate Imaging Reporting and Data System: 2015, Versiol 2. Eur Urol 2016; 69:16-40
2. Van Houdt PJ, Agarwal HK, van Buuren LD, et al. Performance of a fast and high-resolution multi-echo spin-echo sequence for prostate T2 mapping across multiple systems. Magn reson Med. 2017; in press
3. Murase K. Efficient method for calculating kinetic parameters using T1-weighted dynamic contrast-enhanced magnetic resonance imaging. Magn Reson Med. 2004; 51:858-862
4. Myronenko A, Song X. Point set registration: coherent point drift. IEEE Trans Pattern Anal Mach Intell. 2010; 32: 2262-75
Figures