0715
Gleason Probability Maps: A Radiomics Tool for Mapping Tumor Likelihood in MRI Space1Biophysics, Medical College of Wisconsin, Wawautosa, WI, United States, 2Radiology, Medical College of Wisconsin, Wawautosa, WI, United States, 3Pathology, Medical College of Wisconsin, Wawautosa, WI, United States, 4Urologic Surgery, Medical College of Wisconsin, Wawautosa, WI, United States
Synopsis
Intra and intertumoral heterogeneities are well recognized in prostate cancer. These differences affect the macroscopic imaging contrast characteristics of tumor and surrounding tissue. This study aims to generate three new, interpretable image contrasts by combining radiomic profiling with annotated, whole mount pathology. We show that these new image contrasts, Gleason probability maps, are indicative of prostate cancer in naïve data.
Purpose
This study aims to combine whole mount pathology with radiomic profiling to map tumor likelihood on naïve prostate MR images.Methods
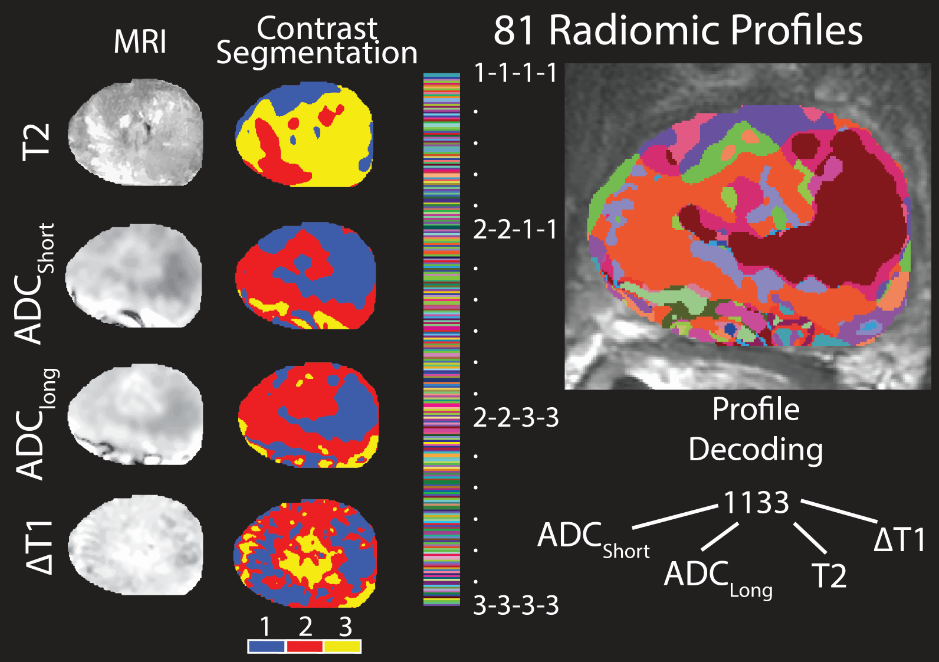
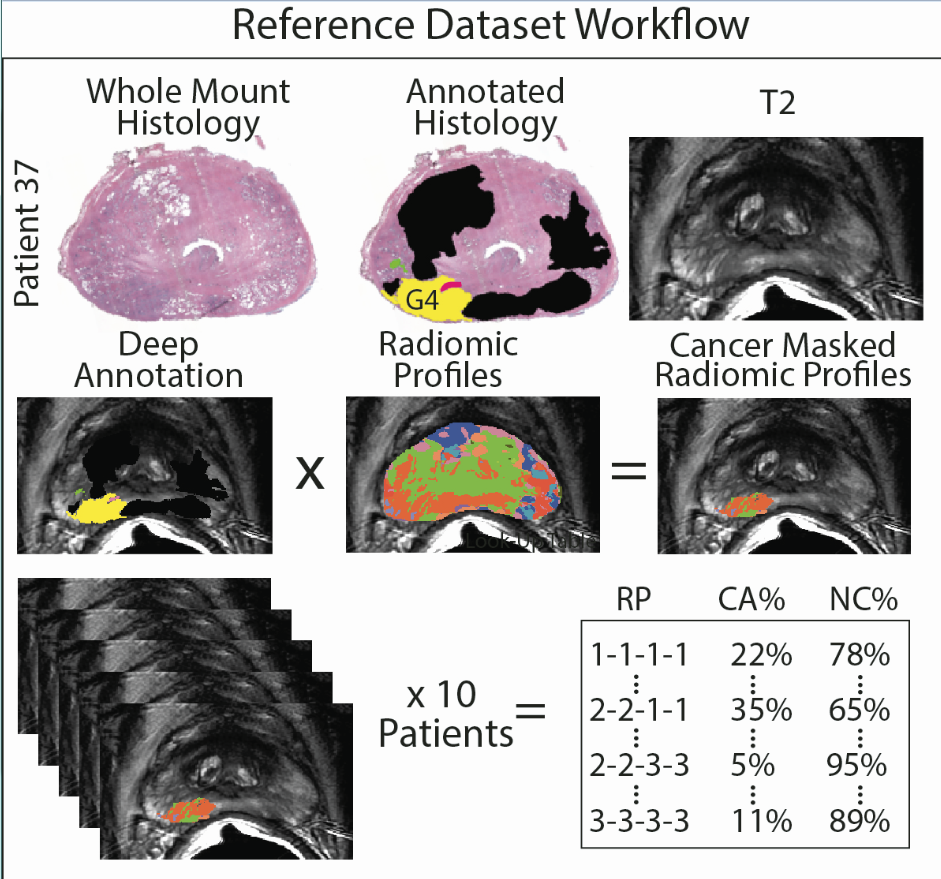
29 Patients underwent MP-MRI prior to prostatectomy on a 3T field strength MRI scanner (General Electric, Waukesha, WI) using an endorectal coil. T2 acquisition parameters were: 3370 ms TR, 120 mm FOV, with voxel dimensions 0.23x0.23x3 mm, 512 acquisition matrix, and 26 slices. Field-of-view optimized and constrained undistorted single shot (FOCUS) diffusion weighted imaging (DWI) with ten b-values (b=0, 10, 25, 50, 80, 100, 200, 500, 1000, 2000) were collected and apparent diffusion coefficient images were calculated using the b=0 and b=1000 images (ADCshort) and b=1000 and b=2000 images (ADClong). Dynamic contrast enhanced imaging was collected and a percent difference (Delta T1) image was calculated from time points before and after contrast injection. T2 weighted images were intensity normalized within a manually drawn prostate mask.[1] Images were aligned with the T2 weighted image using FLIRT and manually checked for errors.[2] Two weeks after imaging patients underwent a radical prostatectomy. A custom 3D printed slicing jig was created from the T2 weighted image in order to slice the tissue in the same orientation as the MRI. [3-6] Whole mount tissue samples were hematoxylin and eosin stained, digitized, and sent to a urological pathologist for annotation using the Gleason scale, including cribriform glands. Digitized slides were then aligned to the T2 weighted MRI using a non-linear control point warping technique. The pathologist annotations were transformed into MRI space using the same transform. Radiomic profiles are generated within the prostate mask. Images are segmented via k-means such that dark values are assigned 1 and bright values are assigned 3. The four contrasts (T2, ADCshort, ADClong, Delta T1) are then linearly combined such that a voxel with dark ADCshort, dark ADClong, bright T2, and bright Delta T1 will be assigned a value of 1-1-3-3. In total 81 radiomic profiles are generated. [7] Patients were stratified into two cohorts (10 training, 19 testing) balanced by tumor burden. For each condition (healthy tissue, low grade cancer, high grade cancer), a Gleason grade probability map is generated from a look up table from a training cohort of 10 patients. Within each lesion, the number of voxels of each profile is calculated and divided by the total number of voxels of that profile contained in the training cohort. Radiomic profiles are then generated in the test cohort and converted to probabilities of healthy tissue, low grade cancer, and high grade cancer based on the data in the training cohort, generating probability maps of all three conditions. High and low grade cancer probabilities were combined into a cancer likelihood map and compared across ROI’s from the deep annotation (DA), the pathologists annotation of tumor grade in MRI space using an ANOVA.Results and Discussion
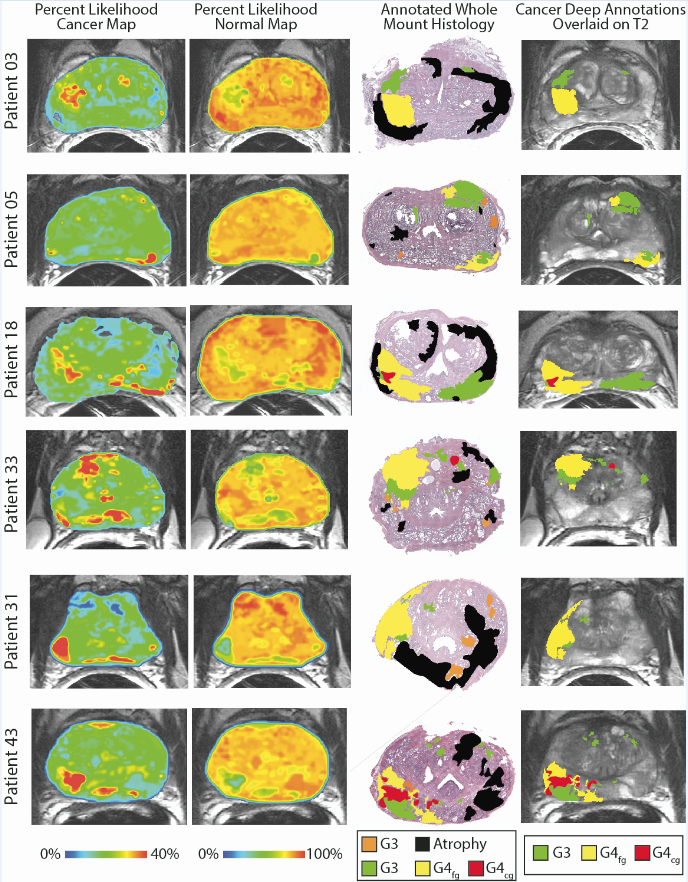
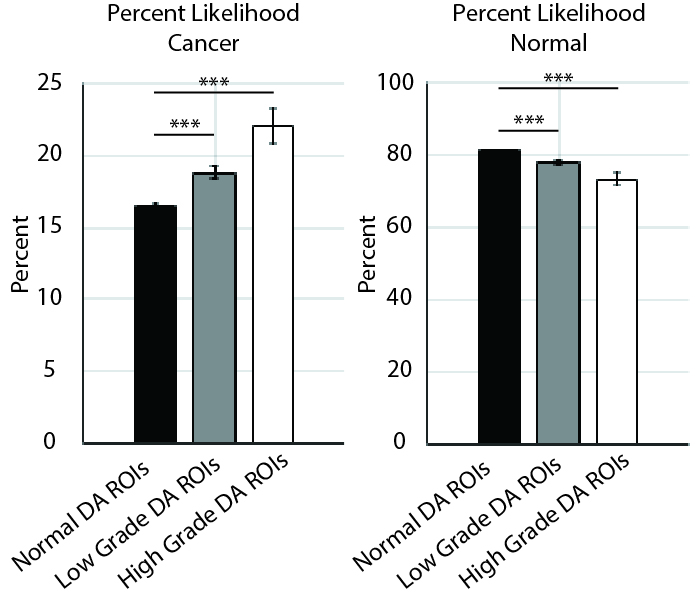
Both maps successfully localized cancer in the test set, where radiomic signatures of high-grade cancer were identified (Figure 3), and co-localized with decreased probabilities of normal tissue (Figure 3). The comparison of cancer to normal tissue was statistically significant (p<0.001) on both the cancer maps and the healthy tissue maps (Figure 4). This technique can potentially aid in the guidance of biopsy and radiation treatment.Conclusion
This study identified unique radiomic profiles indicative of low and high-grade prostate cancer. The technique generates three new, interpretable image contrasts which may be useful for biopsy guidance and radiation treatment.Acknowledgements
Advancing a Healthier Wisconsin and the State of Wisconsin Tax Check off Program for Prostate Cancer Research. National Center for Advancing Translational Sciences, NIH UL1TR001436 and TL1TR001437, and RO1CA218144References
1. Ellingson BM, Zaw T, Cloughesy TF, Naeini KM, Lalezari S, Mong S, Lai A, Nghiemphu PL, Pope WB. Comparison between intensity normalization techniques for dynamic susceptibility contrast (DSC)-MRI estimates of cerebral blood volume (CBV) in human gliomas. J Magn Reson Imaging. 2012;35(6):1472–1477.
2. Jenkinson M, Bannister P, Brady M, Smith S. Improved optimization for the robust and accurate linear registration and motion correction of brain images. Neuroimage. 2002;17(2):825–841.
3. Shah V, Pohida T, Turkbey B, et al. A method for correlating in vivo prostate magnetic resonance imaging and histopathology using individualized magnetic resonance-based molds. Rev Sci Instrum. 2009;80(10):104301
4. Nguyen HS, Milbach N, Hurrell SL, et al. Progressing Bevacizumab-Induced Diffusion Restriction Is Associated with Coagulative Necrosis Surrounded by Viable Tumor and Decreased Overall Survival in Patients with Recurrent Glioblastoma. AJNR Am J Neuroradiol. 2016;37(12):2201-2208.
5. Nguyen HS, Milbach N, Hurrell SL, et al. Progressing Bevacizumab-Induced Diffusion Restriction Is Associated with Coagulative Necrosis Surrounded by Viable Tumor and Decreased Overall Survival in Patients with Recurrent Glioblastoma. AJNR Am J Neuroradiol. 2016.
6. Hurrell SL, McGarry SD, Kaczmarowski AL, et al. Optimized b-value selection for the discrimination of prostate cancer grades, including the cribriform pattern, using diffusion weighted imaging. 2017.
7. McGarry SD, Hurrell SL, Kaczmarowski AL, Cochran EJ, Connelly J, Rand SD, et al. Magnetic resonance imaging-based radiomic profiles predict patient prognosis in newly diagnosed glioblastoma before therapy. Tomography 2016;2:223–8.
Figures