0710
Turbo VSASL: slice- and velocity-selective ASL for high temporal resolution functional CBF mapping1MGH/HST Martinos Center for Biomedical Imaging, Charlestown, MA, United States, 2Radiology, Massachusetts General Hospital, Boston, MA, United States, 3Electrical Engineering and Computer Science, MIT, Cambridge, MA, United States
Synopsis
Velocity selective (VS) ASL theoretically allows high temporal resolution functional CBF mapping, since the arterial tag is immediately delivered to target microvascultature. This is in contrast to conventional ASL, which suffers from transit delays that limit minimum TR to about one second. VSASL, however, employs a nonselective VS tagging scheme, resulting in incomplete T1 recovery of tagged blood away from the imaging slice, and subsequent signal loss at low TRs. In this study, we introduce a slice-selective VS tag to mitigate T1 recovery effects, and for the first time demonstrate subsecond functional CBF mapping of the visual cortex. The approach is dubbed “Turbo VSASL”.
INTRODUCTION
High temporal resolution functional CBF mapping is required to characterize sensory and high-level cognitive processes1. Conventional ASL-CBF imaging is limited for this task, since a minimum inversion time (TI) of about one second is required for the ASL tag to transit from proximal arteries and accumulate within distal microvasculature2.
Velocity-selective ASL (VSASL) is a newer approach that creates the ASL tag within the imaging slab itself, thus allowing immediate delivery to target microvasculature3. This is done by implementing an RF train that labels blood as it decelerates from small arterioles into the capillary network. VSASL theoretically allows much shorter TIs for imaging parenchymal perfusion, making the technique amenable to low TR, ultrafast fMRI.
Standard VSASL, however, uses nonselective RF pulses to create the velocity-based tag and thus saturates blood signal throughout the body. Since ASL depends on repeated tag-control acquisitions, a proportion of this saturated blood must undergo sufficient T1 recovery to provide optimal perfusion signal for the next tag. As TR becomes short, recovery is suboptimal and perfusion SNR is sacrificed, limiting high temporal resolution acquisition.
To address this issue, we introduce a slice-selective VSASL approach dubbed “Turbo VSASL” that creates a finite-width tag centered around the imaging slab (Figure 1). This approach avoids unnecessary saturation of blood distant to the imaging slab, allowing improved perfusion SNR at short TRs. We first optimize the thickness of the VSASL tag for various TI/TR combinations, and then, for the first time, demonstrate subsecond TR functional CBF mapping.
METHODS & RESULTS
Pulse sequence
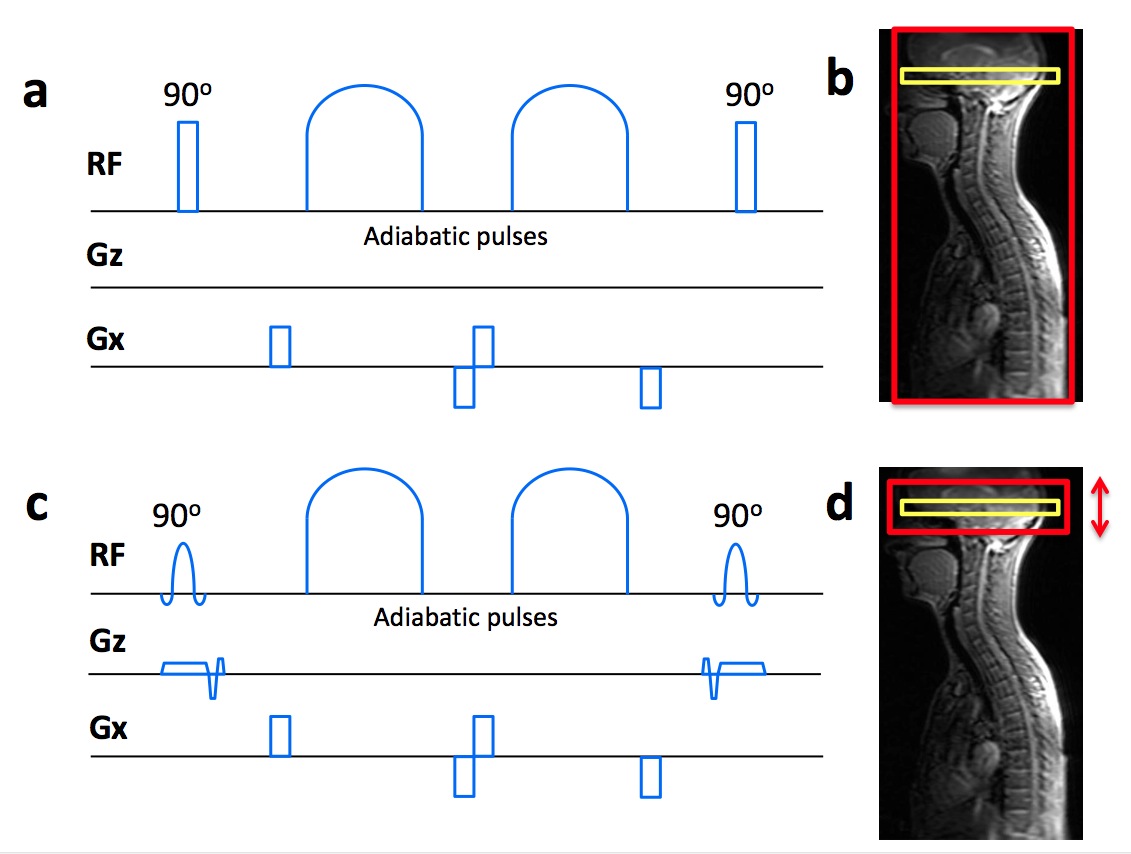
Figure
1a illustrates the standard VSASL velocity selective (VS) module, which uses non-selective,
hard 90o flip-down and flip-up pulses as part of the RF train,
resulting in the VS tag profile seen in Figure 1b. Figure 1c shows the revised
slice-selective VS module, with hard 90o pulses replaced with sinc
pulses and slice-selective gradients, giving user-control of the VS tag thickness
(Figure 1d).
VS tag thickness
optimization
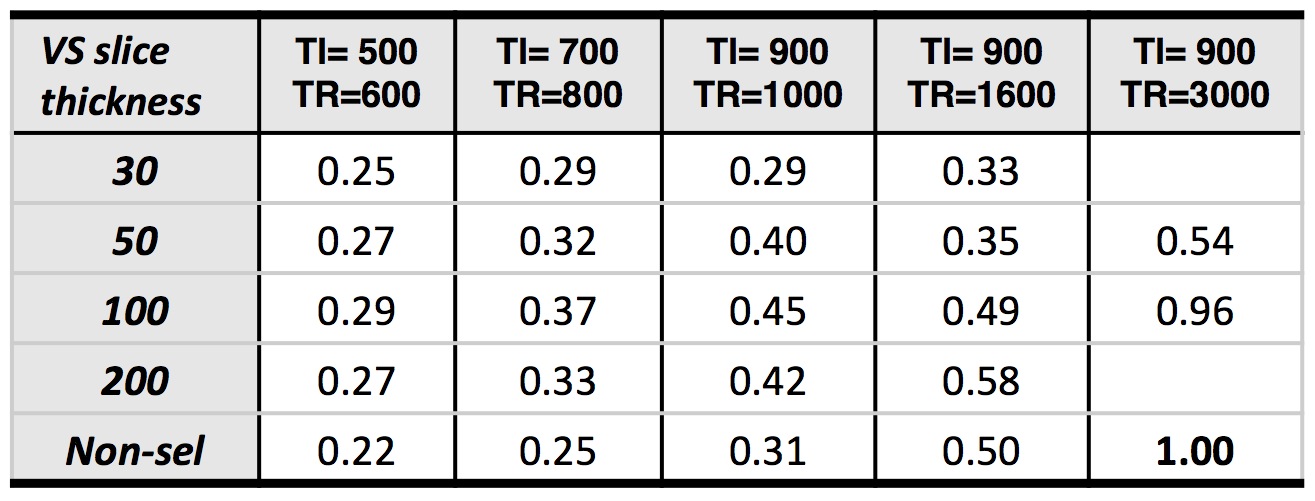
Parameter optimization to find the ideal VS tag thickness for
several TI/TR combinations was performed at 3T in a single subject, including
comparison to the nonselective case (Table 1). A single slice through the
visual cortex was acquired for each parameter combination. A VSASL-nonQUIPSS2
approach was employed with a Vcutoff of 2 cm/s to target parenchymal perfusion4, coupled with an EPI readout of
matrix=64x64, bandwidth=2368 Hz/pixel, and TE=22 ms. Experiments using standard
VSASL parameters of TI/TR=900/3000ms (allowing ample T1 recovery) were also performed
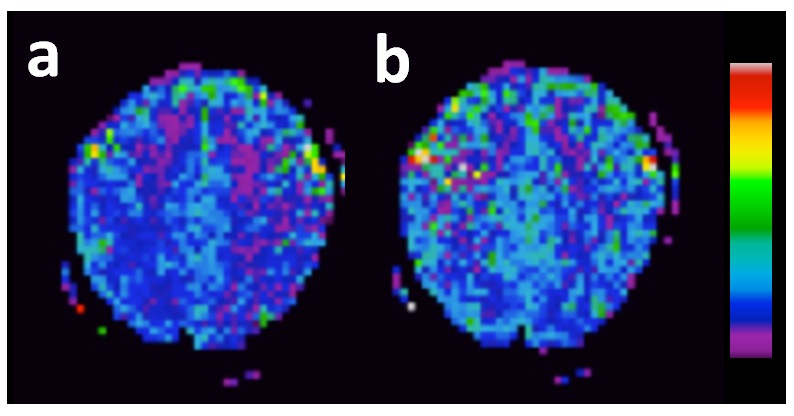
for comparison. Scan time per acquisition was fixed at 2 min. Perfusion SNR maps (Figure
2) were generated using standard ASL processing streams5. Visual cortex SNR was measured
and reported in Table 1. At the shortest TI/TR of 500/600ms, SNR was maximized
with a VS tag thickness of 100 mm, ~30% higher compared to the nonselective
case.
Functional CBF mapping
of visual cortex activation
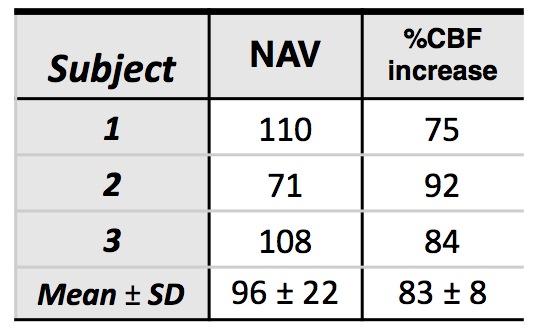
Using the above optimization as a guide, functional
experiments were performed next on three subjects with TI/TR=500/600ms. An optimization at this TI/TR was done to
determine optimal VS tag thickness (50, 100 or 200 mm) for each individual
subject; a value of 50mm was found to provide the highest visual cortex SNR for
all three. The parameters were subsequently used for a functional experiment
with an 8Hz flashing-checkerboard, 1mOFF–1mON–1mOFF–1mON–1mOFF design, done three
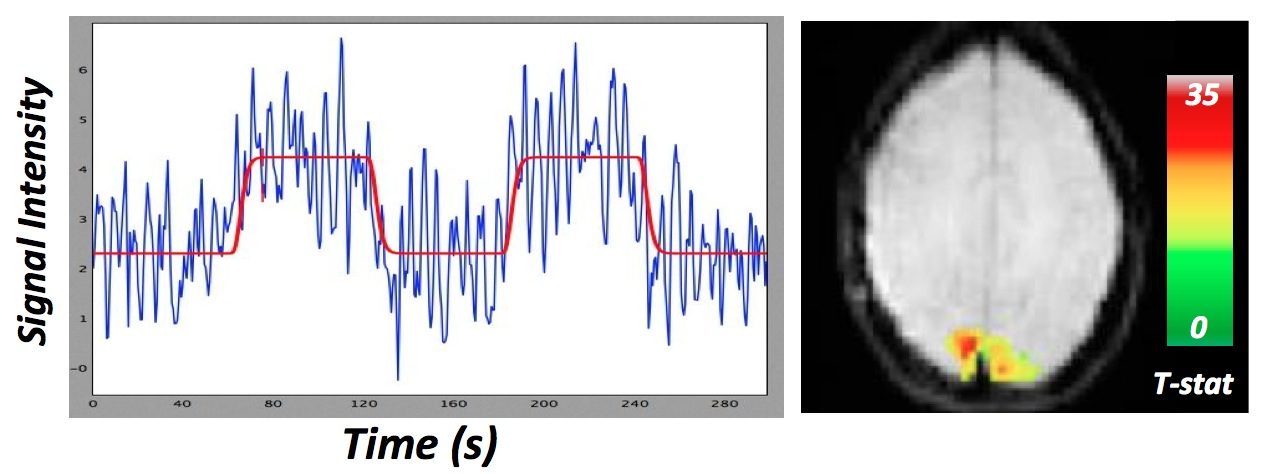
times. The data were averaged, smoothed (6mm Gaussian), and surround-subtracted
to create the perfusion time series. This series was fit with the general linear
model (Figure 3a). Activation maps were thresholded at p < 0.001,corrected to
identify activated voxels, then overlaid onto an anatomic image (Figure 3b). Table
2 reports the number of activated voxels and average percent CBF increase within
activated regions.
All human studies were approved by the IRB.
DISCUSSION
Turbo VSASL images perfusion and maps cortical activation using a TR of 600ms, with visual cortex %CBF increase in range of prior PET/ASL studies6,7. Perfusion SNR is shown to be up to 30% higher relative to the standard, non-selective approach at short TI/TR combinations. At the nominal TI/TR combination of 900ms/3000ms, SNR is similar for the non-selective and VS tag thickness=100 mm cases, but drops when VS tag thickness decreases to 50 mm. This suggests that the optimal VS tag thickness will strike a balance between 1) providing enough labeled blood to sufficiently perfuse the target slice (for a given TI/TR), and 2) leaving enough relaxed blood outside the tagging region for use in the subsequent tag. Future investigations will focus on even shorter TI/TR combinations.CONCLUSION
Turbo VSASL successfully maps CBF activation with subsecond TR, opening the door to high temporal resolution functional CBF imaging.Acknowledgements
Supported in part by the NIH NIBIB (P41-EB015896, R01-EB023281, and R01-EB019437), by the BRAIN Initiative/NIH NIMH (R01-MH111419), and by the MGH/HST Athinoula A. Martinos Center for Biomedical Imaging. Div Bolar is supported by an RSNA Resident/Fellow Research Grant.References
1. Lewis LD, Setsompop K, Rosen BR, et al. Fast fmri can detect oscillatory neural activity in humans. Proceedings of the National Academy of Sciences. 2016;113:E6679-E6685
2. Wong EC, Luh WM, Liu TT. Turbo asl: Arterial spin labeling with higher snr and temporal resolution. Magn Reson Med. 2000;44:511-515
3. Wong EC, Cronin M, Wu W-C, et al. Velocity-selective arterial spin labeling. Magn Reson Med. 2006;55:1334-1341
4. Wu W-C, Wong EC. Intravascular effect in velocity-selective arterial spin labeling: The choice of inflow time and cutoff velocity. Neuroimage. 2006;32:122-128
5. Wong EC, Buxton RB, Frank LR. Implementation of quantitative perfusion imaging techniques for functional brain mapping using pulsed arterial spin labeling. NMR in biomedicine. 1997;10:237-249
6. Quarles RP, Mintun MA, Larson KB, et al. Measurement of regional cerebral blood flow with positron emission tomography: A comparison of [15o]water to [11c]butanol with distributed-parameter and compartmental models. J Cereb Blood Flow Metab. 1993;13:733-747
7. Donahue MJ, Blicher JU, Ostergaard L, et al. Cerebral blood flow, blood volume, and oxygen metabolism dynamics in human visual and motor cortex as measured by whole-brain multi-modal magnetic resonance imaging. Magn Reson Med. 2007;58:1856-1866
Figures