0708
BOLD fMRI with 0.5 mm isotropic voxel size and minimal in-plane distortion using 3D planes-on-a-paddlewheel (POP) EPI at 7 Tesla1Centre for Advanced Imaging, The University of Queensland, Brisbane, Australia
Synopsis
High spatial resolution is essential for blood oxygenation level dependent fMRI of laminar or columnar structures and a voxel size of 0.5 mm would be desirable. With common 2D EPI acquisitions this leads to prohibitively long readout trains, echo times and high in-plane distortions. We therefore propose a 3D POP EPI with minimal in-plane distortion and an echo time dependent on the number of slices that can achieve 0.5 mm isotropic resolution. We further investigate analysis methods based on classical and Bayesian statistical inference for this high-resolution data and show the gained sensitivity when using the Bayesian inference scheme.
Introduction
High spatial resolution is essential for blood oxygenation level dependent (BOLD) fMRI of laminar or columnar structures [1-4]. Due to the sub-millimeter dimension of these structures, voxel sizes of around 0.5 mm are desirable. This extremely high spatial resolution leads to several challenges for the commonly employed 2D multi-slice EPI acquisition scheme; long readout trains lead to very long echo times (TE), which can only be partially mitigated using parallel imaging and partial Fourier methods. In addition, these long echo trains lead to severe in-plane geometric distortions in the presence of B0-inhomogeneities. To solve this issue, we propose a 3D planes-on-a-paddlewheel (POP) EPI [5,6] with minimal in-plane distortion, and an echo time that is dependent on the number of slices. We further investigate different scenarios to analyse these extremely high spatial resolution time series, using (a) classical statistics with different smoothing kernels and (b) Bayesian inference where no spatial smoothing is necessary.Methods
Measurements were performed on a 7 T whole-body research MRI scanner (Siemens Healthcare, Erlangen, Germany) under institutional review board permission. The system was equipped with a 32 channel Rx head array (Nova Medical, USA) and 3rd order shimming was employed for all measurements. One healthy volunteer was examined, after obtaining written informed consent and approval of the local ethics committee, and 3D POP EPI images were obtained at 0.65 and 0.5 mm isotropic spatial resolution with the following acquisition parameters: FOV = 134x134x15.3 mm3, matrix: 210x210x25, TR = 46 ms, TE = 25 ms, ES = 1.03 ms, flip angle = 13°, ramp sampling = 8.6%, 320 projections, TRvol = 12.3 s, and FOV = 128x128x16 mm3, matrix: 256x256x32, TR = 58 ms, TE = 32 ms, ES = 1.43 ms, flip angle = 14°, ramp sampling = 26.2%, 400 projections, TRvol = 23.3 s, respectively. For both measurements, the azimuthal angle between succeeding projections was incremented by 32.04°, which corresponds to a tiny golden angle. At the beginning of each readout train, 3 additional navigator echoes were acquired for phase correction purposes.
All images were reconstructed offline using
Matlab [7]. Phase
correction was performed as described elsewhere [6] followed by a Fourier
transformation along the phase encoding axis, a non-uniform fast Fourier transform
(NUFFT) [8] gridding step and a sum-of-squares coil combination.
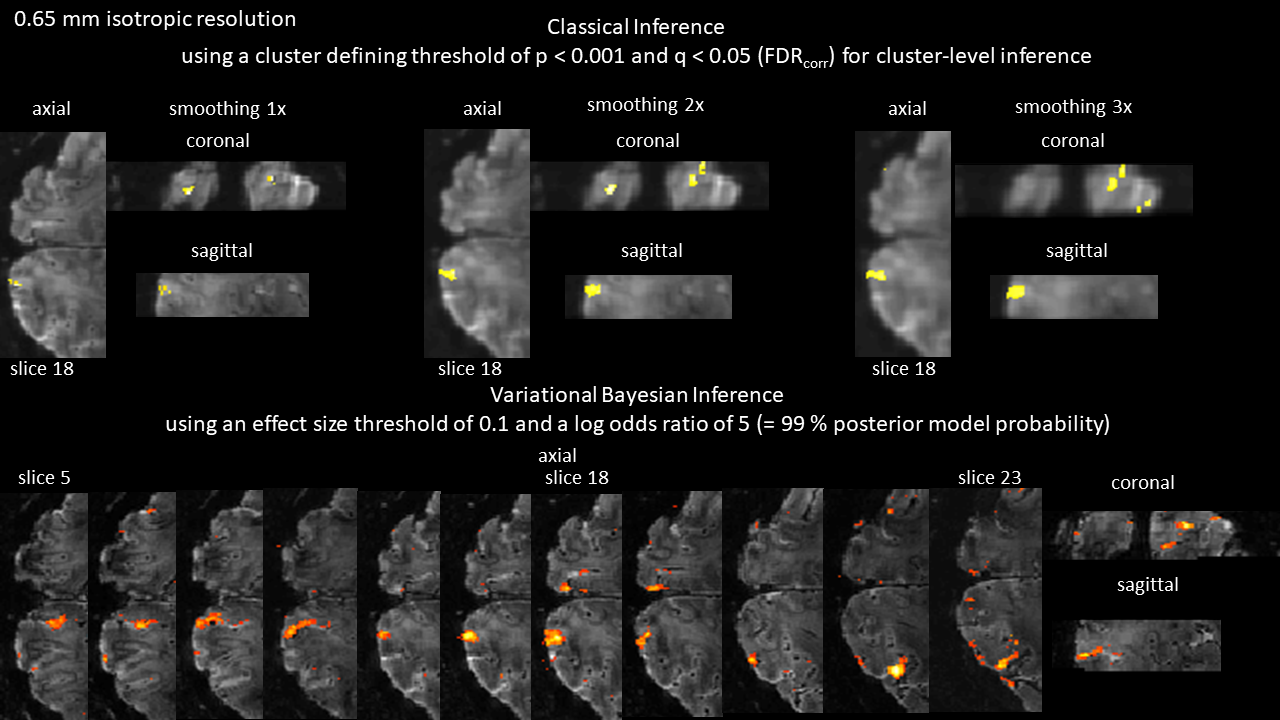
The visual stimulus consisted of 14 blocks with 21s block length interspersed with equally long rest blocks. In each stimulation block, flickering random noise patterns scaled to the visual field were presented with a change in pattern occurring every 250 ms. Pre-processing included realignment and smoothing using SPM 12 [9]. Three different smoothing kernels were investigated with a FWHM of once, twice or three times the voxel size. Statistical inference was performed using classical statistics [10] and variational Bayesian inference [11]. Variational Bayesian inference operates directly on non-smoothed data, and a Laplacian prior is used to encode the spatial contingency of evoked responses. In this way, the required smoothness is estimated from the data itself [12].
Results
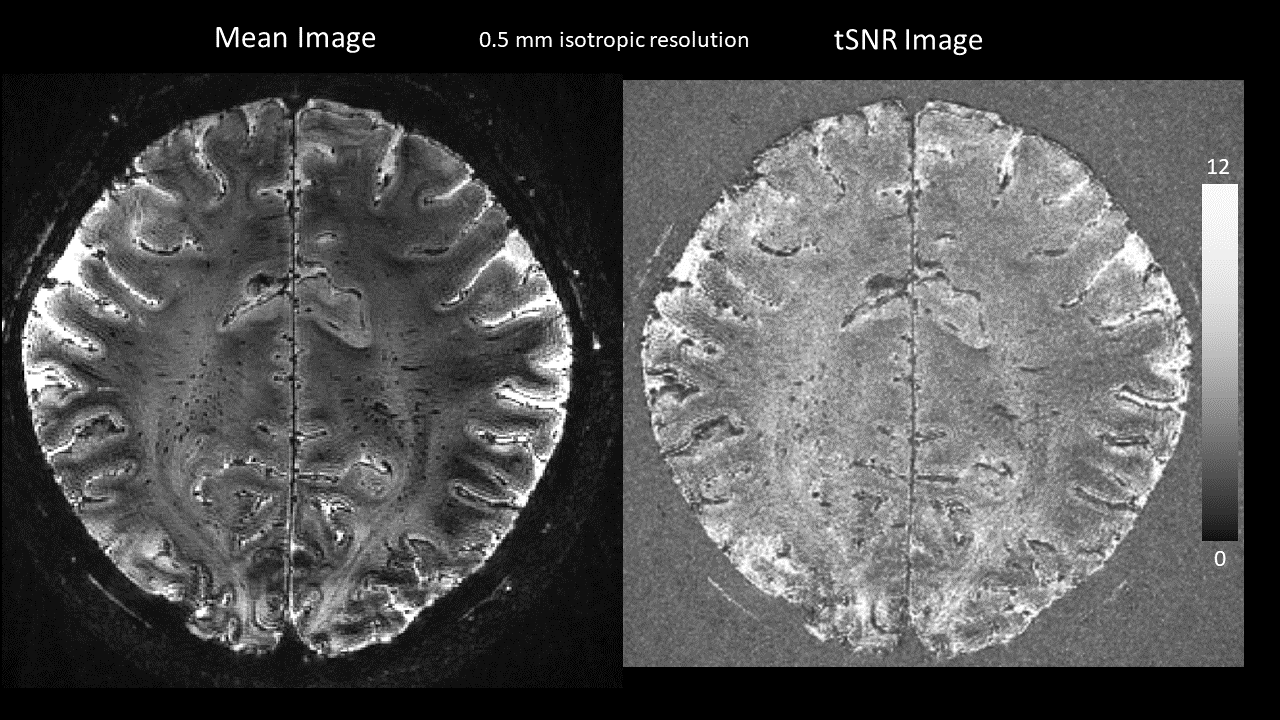
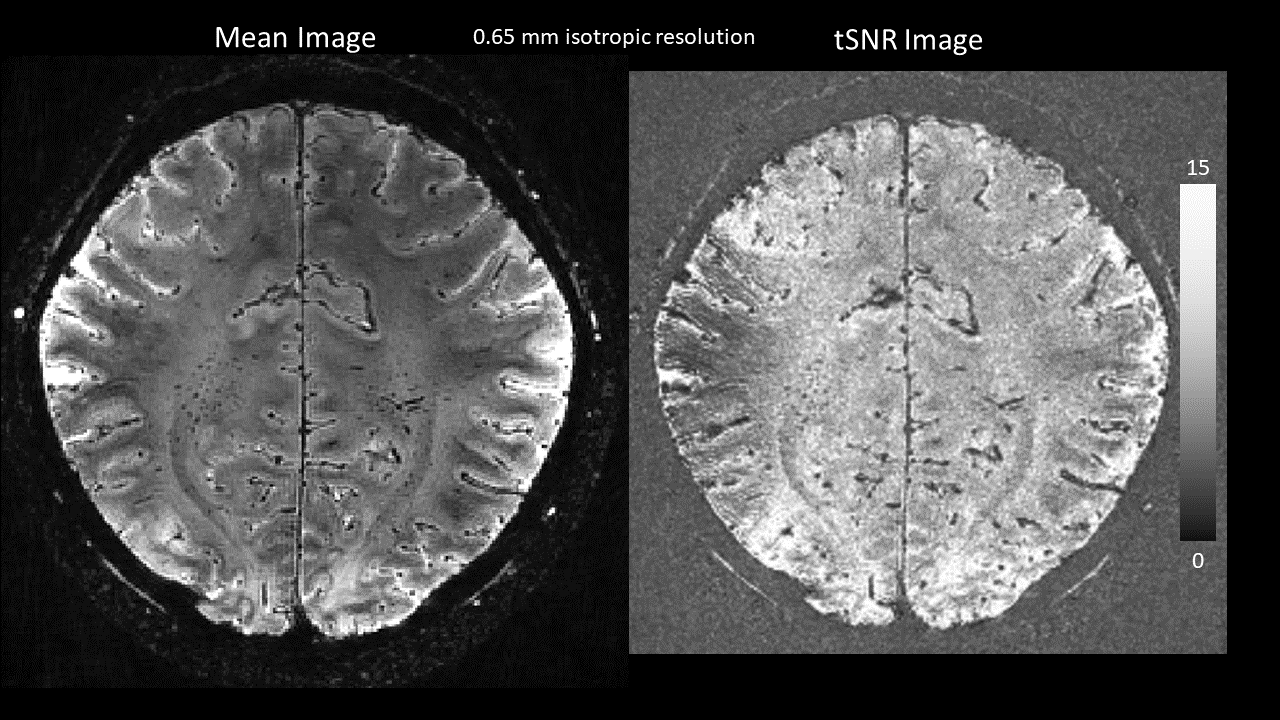
The mean images in Figure 1 and 2 illustrate the essentially distortion and artefact-free images obtained using the 3D POP EPI readout. The temporal SNR is homogenously distributed across the imaging volume ranging between 12 and 15 for the fMRI time series acquired with 0.5 mm isotropic resolution (Fig. 1) and 0.65 mm isotropic resolution (Fig. 2), respectively. Statistical inference using the classical framework shows limited sensitivity, whereas the Bayesian inference scheme provides significant activation close to major vessels, but also along the cortical sheet (Fig. 3). The three different smoothing levels slightly increased the spatial extend of the supra-threshold voxels, at the cost of a reduced spatial specificity.Discussion
One limitation of POP EPI is that TE and echo train length
depend on the number of slices in the slab, i.e. the phase encoding steps. Shorter
TEs can be obtained by using parallel imaging in the phase encoding direction to
reduce phase encoding steps or increase coverage. Also, while in-plane
distortions are minimal owing to the radial readout, distortions can occur in
through-plane direction in the presence of B0 inhomogeneities.
An additional benefit of 3D POP EPI that we have not yet
explored, is the flexibility to reconstruct lower resolutions from
the same data, thereby increasing temporal resolution and potentially
statistical significance.Conclusion
We have presented a new acquisition scheme for functional MRI at ultra-high field that provides images with minimal in-plane distortions and high spatial resolution. Functional sensitivity could be illustrated using a Bayesian inference scheme, which provided increased sensitivity compared to classical statistics.Acknowledgements
SB acknowledges support through the Australian Government Research Training Program Scholarship. MB acknowledges funding from Australian Research Council Future Fellowship grant FT140100865. The authors acknowledge the facilities of the National Imaging Facility (NIF) at the Centre for Advanced Imaging, University of Queensland.References
[1] Koopmans PJ, Barth M, Norris DG. Layer-specific BOLD activation in human V1. Hum Brain Mapp 2010. doi: 10.1002/hbm.20936.
[2] Lawrence SJD, Formisano E, Muckli L, de Lange FP. Laminar fMRI: Applications for cognitive neuroscience. Neuroimage 2017. doi: 10.1016/j.neuroimage.2017.07.004.
[3] Nasr S, Polimeni JR, Tootell RB. Interdigitated Color- and Disparity-Selective Columns within Human Visual Cortical Areas V2 and V3. J Neurosci 2016. doi: 10.1523/JNEUROSCI.3518-15.2016.
[4] Puckett AM, Bollmann S, Barth M, Cunnington R. Measuring the effects of attention to individual fingertips in somatosensory cortex using ultra-high field (7T) fMRI. Neuroimage 2017. doi: 10.1016/j.neuroimage.2017.08.014.
[5] Graedel NN, McNab JA, Chiew M, Miller KL. Motion correction for functional MRI with three-dimensional hybrid radial-Cartesian EPI. Magn Reson Med. 2017 Aug;78(2):527-540. doi: 10.1002/mrm.26390.
[6] Stäb D, Bollmann S, Langkammer C, Bredies K, Barth M. Accelerated mapping of magnetic susceptibility using 3D planes-on-a-paddlewheel (POP) EPI at ultra-high field strength. NMR Biomed. 2017 Apr;30(4). doi: 10.1002/nbm.3620.
[7] Matlab 2016a, The MathWorks, Inc., Natick, Massachusetts, United States
[8]
Fessler JA, Sutton BP.
Nonuniform fast Fourier transforms using min–max interpolation. IEEE Trans.
Signal Process. 2003; 51: 560–574.
[9] SPM 12, Wellcome Trust Centre for Neuroimaging, London, UK
[10] Worsley KJ, Friston KJ. Analysis of fMRI time-series revisited--again. NeuroImage 1995;2:173–181. doi: 10.1006/nimg.1995.1023.
[11] Penny W, Kiebel S, Friston K. Variational Bayesian inference for fMRI
time series. NeuroImage 2003;19:727–741. doi: 10.1016/S1053-8119(03)00071-5.
[12] Penny WD, Trujillo-Barreto NJ, Friston KJ. Bayesian fMRI time series analysis with spatial priors. NeuroImage 2005;24:350–362. doi: 10.1016/j.neuroimage.2004.08.034.
Figures