0705
Hypercapnia-induced vasodilatation increases brain stiffness1Berlin Center for Advanced Neuroimaging, Charité - Universitätsmedizin Berlin, Berlin, Germany, 2Bernstein Center for Computational Neuroscience, Berlin, Germany, 3Institute of Radiology, Charité - Universitätsmedizin Berlin, Berlin, Germany, 4Institute of Medical Informatics, Charité - Universitätsmedizin Berlin, Berlin, Germany
Synopsis
Cerebral MR elastography paired with arterial spin labelling was applied to a group of healthy male subjects during a hypercapnia challenge to analyze the interrelation between cerebral blood flow and mechanical properties of brain tissue in vivo. Hypercapnia-induced vasodilation and the associated increase in blood perfusion was accompanied by a highly significant increase in global cerebral stiffness by 3% (p<0.0001).
Introduction
Viscoelastic properties of the brain reflect tissue architecture at multiple length scales. However, little is known about the relation between vital tissue functions, such as perfusion, and the macroscopic mechanical properties of cerebral tissue. Recent work pairing MR elastography (MRE) [1] with arterial spin labelling (ASL) provided evidence for a contribution of baseline perfusion and the underlying micro-vascular architecture, as given by the micro-vessel diameter, to the stiffness of brain tissue [2]. In this work, we extend this baseline study by manipulating the micro-vessel diameter and cerebral blood perfusion during a hypercapnia challenge for analyzing to which extend and into which direction an increased cerebral blood flow (CBF) changes the viscoelastic shear modulus, |G*|, of brain tissue.Methods
14 healthy male subjects were investigated in a 3T MRI scanner (Siemens, Trio) with a 32-channel head coil by 3D anatomical scans (MPRAGE), pseudo-continuous ASL [3] and continuous-wave multi-frequency MRE [4].
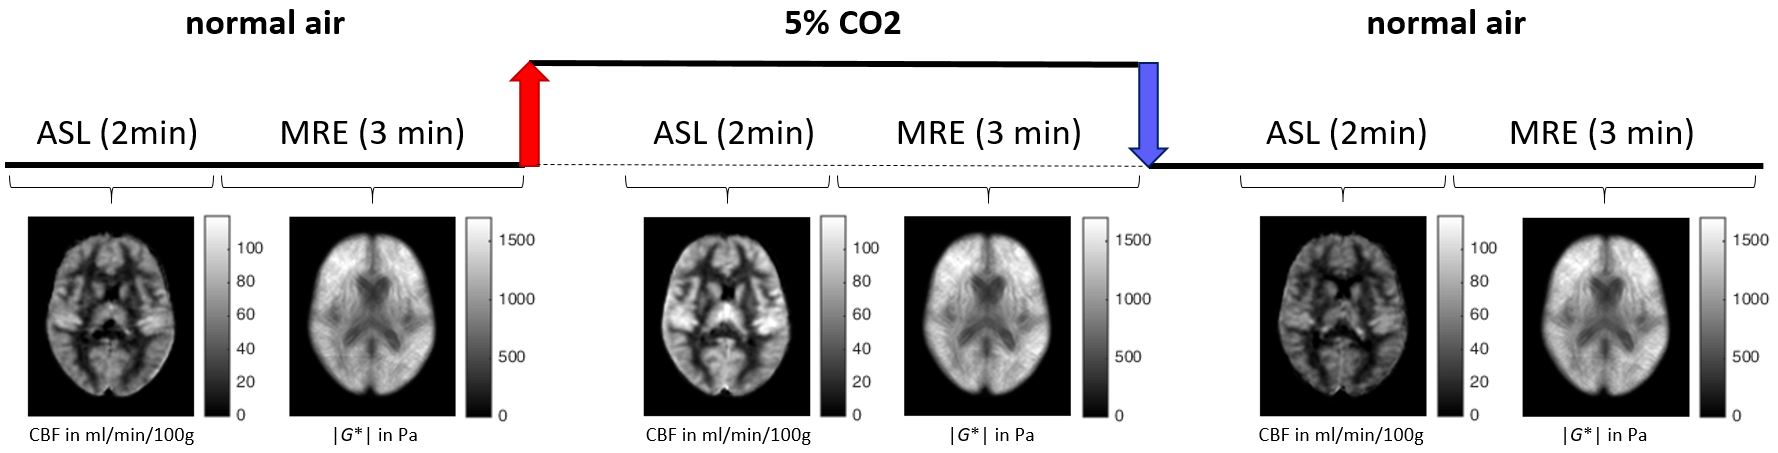
The study paradigm (see figure 1) consisted of three blocks, each one comprised of a 2-min ASL scan followed by a 3-min MRE scan. During the first and third block, the volunteers inhaled normal air. The hypercapnia block started with a 1-min wash-in of mixed gas (5% CO2, 74% N2, 21% O2) through a breathing tube with a mouth piece, followed by the ASL and MRE scan and a 1-minute wash-out period. Heart rate (HR) and blood pressure (BP) were recorded continuously with a Tesla Guard monitor (MIPM, Mammendorfer, Germany).
The following parameters were used for MRE: 22 transversal slices of 2 mm isotropic resolution acquired with spin-echo echo planar imaging (EPI), TE=67ms, TR=2.5s, three vibration frequencies (30, 40, 50 Hz), 8 acquisitions over a wave cycle. ASL sequence parameters: labeling duration 1.5s, post-label delay 1.2s, 30 volumes (15 label, 15 control) with 18 ascending transversal gradient-echo EPI slices of 2.5 mm isotropic resolution (10% gap), TE=18ms, TR=4s.
All images were post-processed and analyzed with Matlab and SPM12. MRE data processing was based on MDEV inversion as described in [5], which provides a lumped parameter of viscoelasticity, |G*|. For quantification of the cerebral blood flow (CBF, in ml/100g/min), control-label pairs in ASLtbx [6] were used. After realignment and parameter quantification, all volumes were normalized to the MNI template space to allow for inter-subject statistics employing a two-tailed paired-sample t-test.
Results
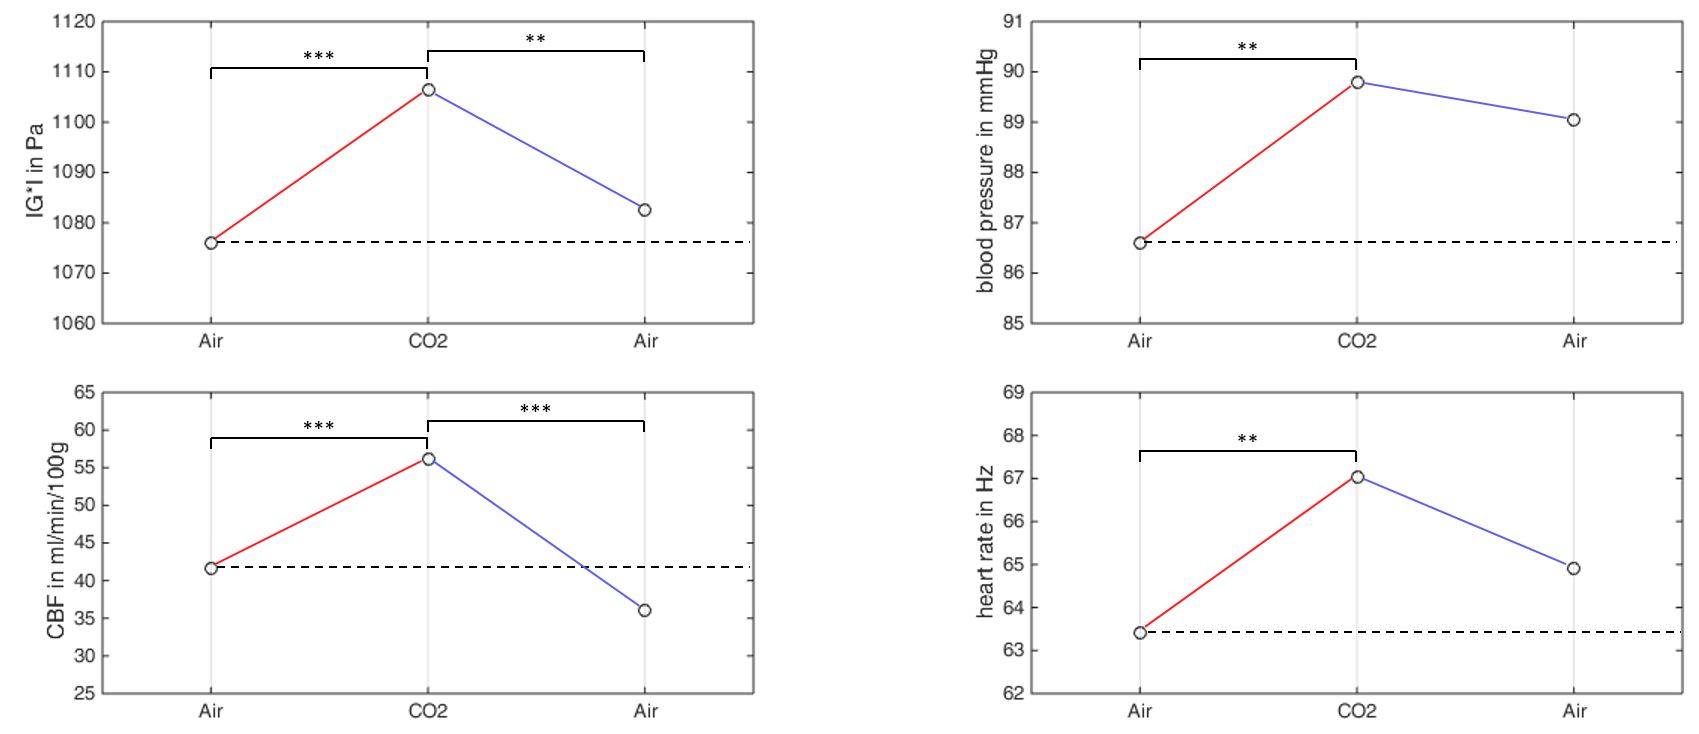
The group-averaged perfusion and stiffness maps of one representative image slice are depicted in figure 1 for all 3 phases of the hypercapnia challenge. Figure 2 shows the corresponding group-averaged whole-brain stiffness and perfusion values next to the average blood pressure and heart rate values – all following a similar pattern:
1) Highly significant increase in all parameters between normocapnia and hypercapnia:
Δ|G*| = +31 Pa (p=3.4×10⁻⁵)
ΔCBF = +14 ml/min/100g (p=1.7×10⁻⁷)
ΔBP = +3.2 mmHg (p=4.3×10⁻³)
ΔHR = +3.6 Hz (p=5.2×10⁻³)
2) Decrease in all measured parameters after hypercapnia with significant differences for stiffness and perfusion only:
Δ|G*| = -24 Pa (p=1.3×10⁻³)
ΔCBF = -20 ml/min/100g (p=1.6×10⁻⁷)
ΔBP = -0.7 mmHg (p=4.5×10⁻¹)
ΔHR = -2.1 Hz (p=9.6×10⁻²)
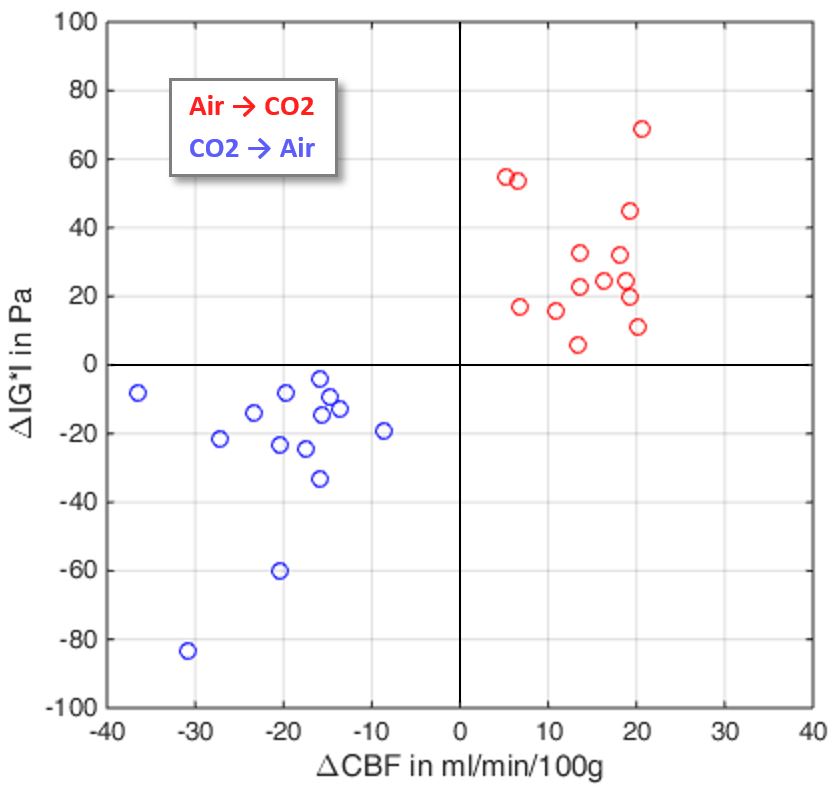
Figure 3 depicts the distinct clusters of individual whole-brain stiffness and perfusion changes after the transition to hypercapnia (with increasing stiffness and perfusion for all subjects; red dots) and between hypercapnia and the following normocapnia period (with decreasing stiffness and perfusion for all subjects; blue dots).
Discussion
Our results suggest a high sensitivity of MRE to changes of the micro-vessel diameter and cerebral perfusion rate. Hypercapnia-induced vasodilation and the associated perfusion increase resulted in a highly significant increase in global cerebral stiffness by 3% (p<0.0001). While the hypercapnia-induced modulation of vital parameters (e.g. heart rate, blood pressure, cerebral blood flow) is well known [7], uncovering the mechanisms causing the observed change of macroscopic mechanical properties of cerebral tissue (i.e. stiffness) needs further research. In future work we will extend our analysis by investigating local effects of the hypercapnia-induced perfusion and stiffness changes in structurally and functionally distinct brain areas. Furthermore, our results might help disentangling the effects of vascular contribution overlapping with recently reported changes of brain mechanical properties due to functional activation [8,9].Acknowledgements
No acknowledgement found.References
[1] Muthupillai et al., Science 1995; 269: 1854–1857
[2] Hetzer et al., JCBFM 2017; doi:10.1177/0271678X17691530
[3] Wu et al., MRM 2007; 58:1020-1027
[4] Dittmann et al., MRM 2016; 76:1116-1126
[5] Hirsch et al., MRM 2014; 71:267-277
[6] Wang et al., MRI 2008; 26:261-269
[7] Kety et al., J Clin Invest 1948; 27:484-492
[8] Fehlner et al., ISMRM 2014; #871
[9] Patz et al., ISMRM 2017; #242
Figures