0704
Mapping Neural Circuitry at High Speed (10Hz) using functional Magnetic Resonance Elastography (fMRE)1Radiology, Brigham & Women's Hospital, Boston, MA, United States, 2Radiology, Harvard Medical School, Boston, MA, United States, 3Imaging Sciences and Biomedical Engineering, Kings College London, London, United Kingdom, 4Neuroradiology, University Medical Center Goettingen, Goettingen, Germany, 5Biomedical Engineering, Boston University, Boston, MA, United States, 6Mechanical Engineering, Boston University, Boston, MA, United States, 7Physics, University of Erlangen, Erlangen, Germany, 8Informatics, University of Oslo, Oslo, Norway, 9Biomedical Engineering, ETH, Zurich, Switzerland
Synopsis
Using MR elastography, the shear modulus of a mouse brain was monitored during noxious stimulation. Localized changes in tissue elasticity of >10% were observed in previously identified regions associated with noxious stimuli. The observed mechanical response persists over two decades of stimulus frequencies from 0.1-10 Hz. This demonstrates the mechanism behind the change in stiffness is not of vascular origin, which has a much slower response than 10Hz. but rather is either directly related to, or tightly coupled to primary neuronal activity. This opens a new window to explore the spatio-temporal processing of signals in the brain.
Introduction
While BOLD fMRI1,2 has transformed neuroscience, the neuro-vascular coupling responsible for BOLD is slow, responding on a timescale of several seconds3. In contrast, electrophysiology and optical methods can measure primary neuronal activity, but the spatial resolution of EEG is poor while optical methods have limited spatial penetration4. Here, using MR elastography (MRE), we measure mouse brain tissue stiffness with both high temporal and spatial resolution5. We report tissue stiffness changes >10% in localized brain regions during noxious electrical stimulation of the hind limb. These stiffness changes persist over stimulus switching frequencies covering two orders of magnitude from 0.1Hz to 10Hz.Methods
Studies were performed on healthy female C57BL/6 mice at 7T under an Institutional Animal Care and Use Committee approved protocol. For functional imaging, two 30-gauge hypodermic needles were inserted into the hind limb foot pad of an isoflurane-anesthetized mouse. Electrical current stimulation, consistent with noxious stimulation6, was delivered with pulses of ~250ms duration and 1.5-2mA amplitude adjusted to cause a visible digit twitch. Current pulses were applied at 3, 10 and 100Hz respectively to ensure a minimum of 10 pulses during each stimulus time. A multi-slice MRE sequence with 300μm isotropic resolution and interleaved acquisition of two stimulus states was utilized5. Two scans were acquired: an “experiment” (Exp) scan that interleaved stimulus ON and OFF states, and a “control” (Ctrl) scan that interleaved two OFF states. Three values of the stimulus state time were studied: 9, 0.9 and 0.1s, corresponding to stimulus switching frequencies of 0.11 (SLOW), 1.1 (FAST) and 10Hz (Ultra-FAST). Typical acquisition time was (9 slices)*(8 wave-phases)*(2 stimulus states)*(3 motion encoding directions)*(64 phase encodes)*(0.1s per nuclear excitation) = 46.08 minutes.
Differences between the two interleaved control scans were used to measure reproducibility; the distribution of voxel-by-voxel differences between the two control elasticity maps over the entire brain was fit to a Gaussian. The mean was close to zero and the standard deviation (Ctrl_std) is a measure of reproducibility. Ctrl_std was used to determine z scores for differences between Exp_ON and Exp_OFF scans as well as between each Exp scan and the average of the two Ctrl scans (Ctrl_avg).
Both elastic G’ and loss G” shear moduli were reconstructed.
Results
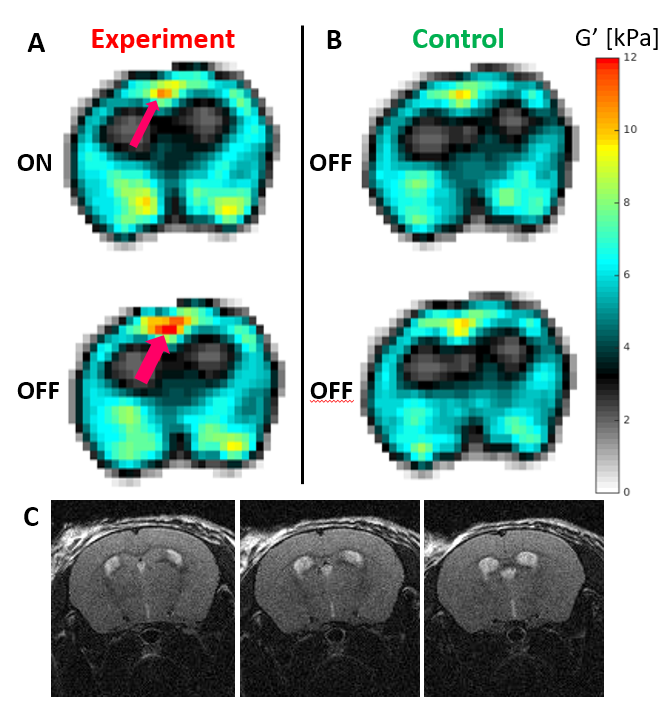
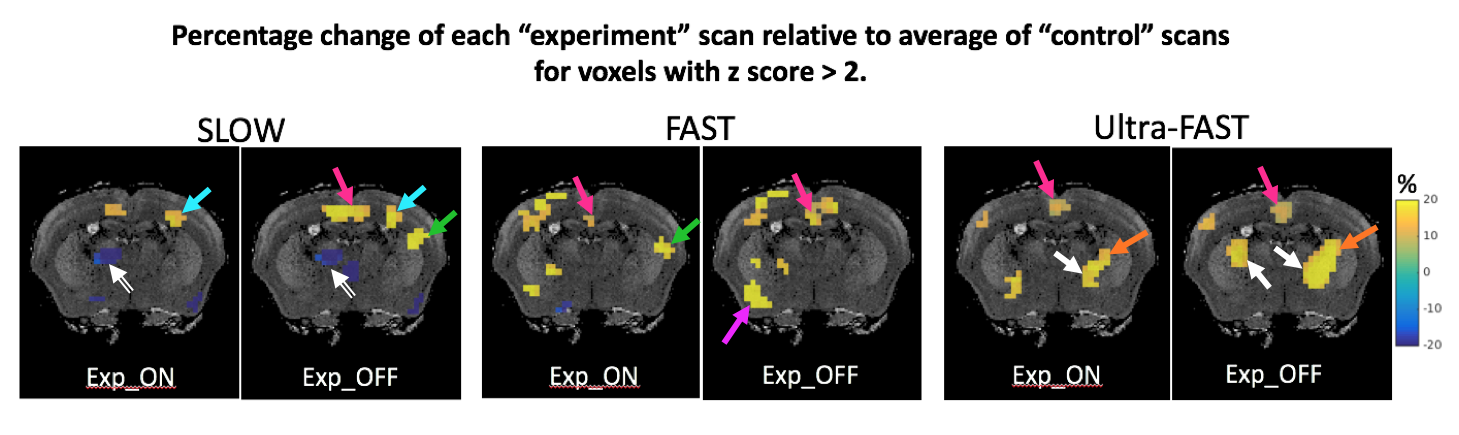
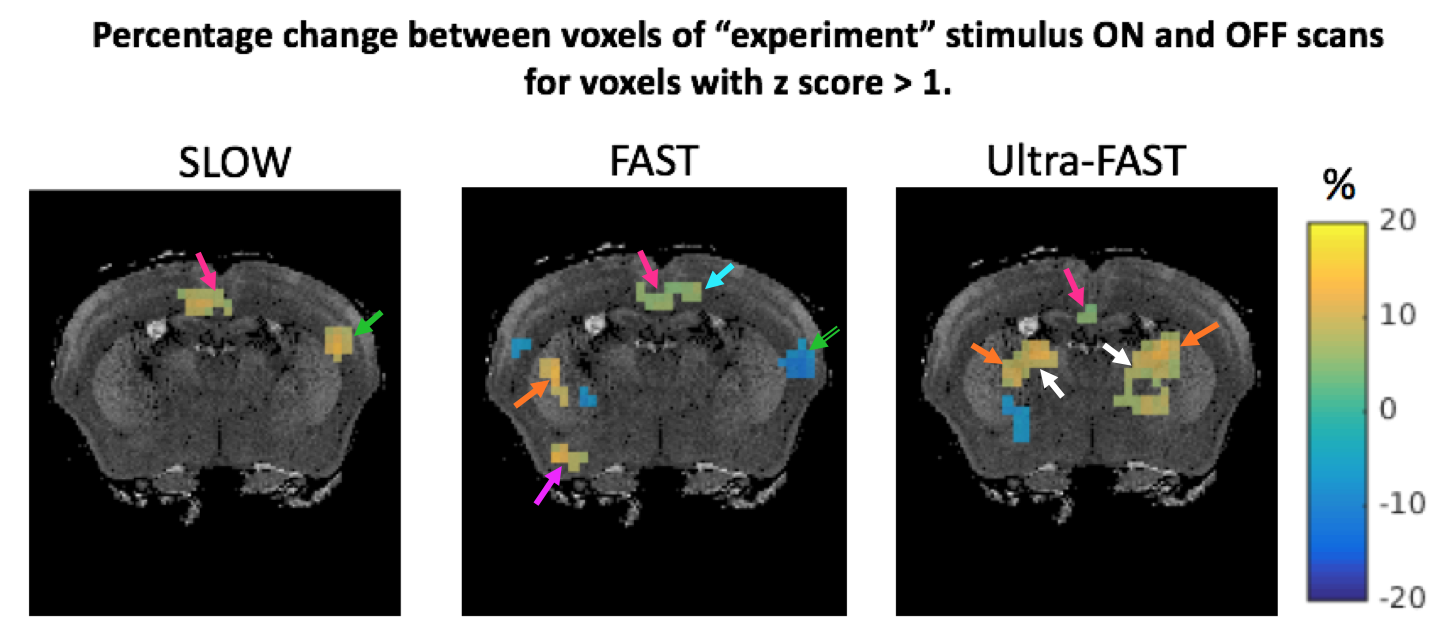
Significant differences were only observed for G’. The Ctrl_std for ΔG’ was 0.55, 0.72 and 0.52 kPa for SLOW, FAST and Ultra-FAST respectively. Figure 1 shows G’ results from a single experiment, and Figure 2 shows averaged G’ maps for all cases. Both Exp_ON and Exp_OFF scans generally show localized regions of increased stiffness relative to the control average. Interestingly, the Exp_OFF scan is typically stiffer than the Exp_ON scan. Figures 3 and 4 further quantify the results by displaying only voxels with a z score larger than a specified significance threshold and overlaid on a corresponding anatomical atlas image7. Figure 3 compares each Exp scan to the Ctrl_avg scan, showing only voxels with |z|>2. Figure 4 compares the two interleaved Exp scans displaying only voxels with |z|>1. Regions with significantly changed elasticity include the primary and secondary contralateral somatosensory cortex, the cingulate cortex, thalamus, striatum and amygdala. These regions are commonly seen in brain studies of pain processing8.Discussion
The fact that our observations persist up to 10Hz, where changes in the BOLD response are negligible, implies the origin of the observed mechanical changes is either tightly coupled to, or is directly a measure of, primary neuronal activity. Potential mechanisms include osmotic pressure-induced water influx, electrostatic membrane interactions, entropic elasticity, and motor protein activation following ionic influx9.
Both Exp_ON and Exp_OFF have common regions with increased G’ compared to control scans. Slow processes such as neurogenic inflammation that can build up at the hind limb stimulation site, or along the nociceptive pathway during prolonged stimulation, may account for this observation10. Fast modulation of this activity where the Exp_ON state has a reduced stiffness compared to Exp_OFF state implies additional neuronal stimulation that produces inhibition such as has been observed in mollusks11 and in the human auditory system12.
The more spatially localized response for Ultra-FAST compared to SLOW or FAST protocols may be due to the known decrease in functional activity with increasing electrical current pulse frequency13.
Conclusion
We anticipate that mapping neuronal activity by measurement of tissue stiffness will provide a new window for studying brain function at high temporal and spatial resolution with specific application to tracking neural circuitry at high speed.Acknowledgements
We acknowledge valuable discussions with Nicholas Todd, James Butler, James Prichard, Nicolas Bolo, Gaute Einevoll, Charles Guttmann and Anna Devor. We gratefully acknowledge support from NIH R21 EB030757, the European Union’s Horizon 2020 research and Innovation program under grant agreement No 668039, German Research Foundation (DFG, SCHR 1542/1-1), Brigham and Women’s Hospital Department of Radiology and Boston University Department of Engineering. This work was also supported by the Wellcome EPSRC Centre for Medical Engineering at King’s College London (WT 203148/Z/16/Z). This work received funding from the European Union Seventh Framework Programme FP7/20072013 under grant agreement n° 601055.References
1. Ogawa, S. et al. Functional brain mapping by blood oxygenation level-dependent contrast magnetic resonance imaging. A comparison of signal characteristics with a biophysical model. Biophys. J. 64, 803–812 (1993).
2. Belliveau, J. W. et al. Functional mapping of the human visual cortex by magnetic resonance imaging. Science 254, 716–719 (1991).
3. Tian, P. et al. Cortical depth-specific microvascular dilation underlies laminar differences in blood oxygenation level-dependent functional MRI signal. Proc. Natl. Acad. Sci. U. S. A. 107, 15246–15251 (2010).
4. Babiloni, C., Pizzella, V., Gratta, C. D., Ferretti, A. & Romani, G. L. Fundamentals of electroencefalography, magnetoencefalography, and functional magnetic resonance imaging. Int. Rev. Neurobiol. 86, 67–80 (2009).
5. Patz, S. et al. Functional Neuroimaging in the Brain using Magnetic Resonance Elastography. Abstract 242, ISMRM 2017, Honolulu.
6. Bosshard, S. C. et al. Assessment of brain responses to innocuous and noxious electrical forepaw stimulation in mice using BOLD fMRI. Pain 151, 655–663 (2010).
7. Papp, E. A., Leergaard, T. B., Calabrese, E., Johnson, G. A. & Bjaalie, J. G. Waxholm Space atlas of the Sprague Dawley rat brain. NeuroImage 97, 374–386 (2014).
8. Thompson, S. J. & Bushnell, M. C. Rodent functional and anatomical imaging of pain. Neurosci. Lett. 520, 131–139 (2012).
9. Gardel, M. L., Kasza, K. E., Brangwynne, C. P., Liu, J. & Weitz, D. A. Chapter 19: Mechanical response of cytoskeletal networks. Methods Cell Biol. 89, 487–519 (2008).
10. Garland, E. L. Pain processing in the human nervous system: a selective review of nociceptive and biobehavioral pathways. Prim. Care 39, 561–571 (2012).
11. Clatworthy, A. L. & Walters, E. T. Activity-dependent depression of mechanosensory discharge in Aplysia. J. Neurophysiol. 70, 1195–1209 (1993).
12. Ayala, Y. A. & Malmierca, M. S. Cholinergic Modulation of Stimulus-Specific Adaptation in the Inferior Colliculus. J. Neurosci. 35, 12261–12272 (2015).
13. Masamoto, K., Kim, T., Fukuda, M., Wang, P. & Kim, S.-G. Relationship between neural, vascular, and BOLD signals in isoflurane-anesthetized rat somatosensory cortex. Cereb. Cortex. 17, 942–950 (2007).
Figures