0703
A Novel Method for Direct Detection and Spatial Mapping of Neuronal Activity1Department of Biomedical Engineering, Sungkyunkwan University, Suwon, Republic of Korea, 2Center for Neuroscience Imaging Research, Institute for Basic Science (IBS), Suwon, Republic of Korea
Synopsis
Although BOLD-fMRI is widely used for in-vivo functional brain mapping, there has been continuing interest in the possibility of using MRI to directly detect the neuronal activity. However, previous works failed to reach a clear consensus on that possibility. Here, we proposed a novel method for direct detection and spatial mapping of neuronal activity with temporal resolution on the order of the action-potential duration(4~5ms). We demonstrated its feasibility using an ex-vivo squid axon and an insulated copper-wire in an event-related electrical-stimulation paradigm. The results are very exciting and promising, although the underlying contrast mechanism needs to be elucidated.
Introduction
fMRI is one of the most widely used methods for in-vivo functional brain mapping with high spatial resolution. However, since fMRI utilizes hemodynamic responses to neuronal activation such as blood-oxygenation-level-dependent (BOLD) contrast, it has an intrinsic limitation on direct mapping of neuronal activity in terms of contrast source and time resolution. During the past few decades some attempts have been tried to use MRI for directly detecting ultra-weak magnetic fields (≤ 1nT) induced by neuronal activity1,2. Direct mapping of neuronal activity with MRI is theoretically straightforward but practically very challenging due to very low signal-sensitivity and temporal resolution. To date, both successes3-6 and failures7-11 have been reported, but there is no clear consensus on possibility of directly detecting the neuronal activity. Here, we present a novel method for directly detecting and spatially mapping the neuronal activity with temporal resolution on the order of action-potential duration (4~5ms). To demonstrate its feasibility, experiments were performed using an ex-vivo squid axon and an insulated copper-wire.Methods
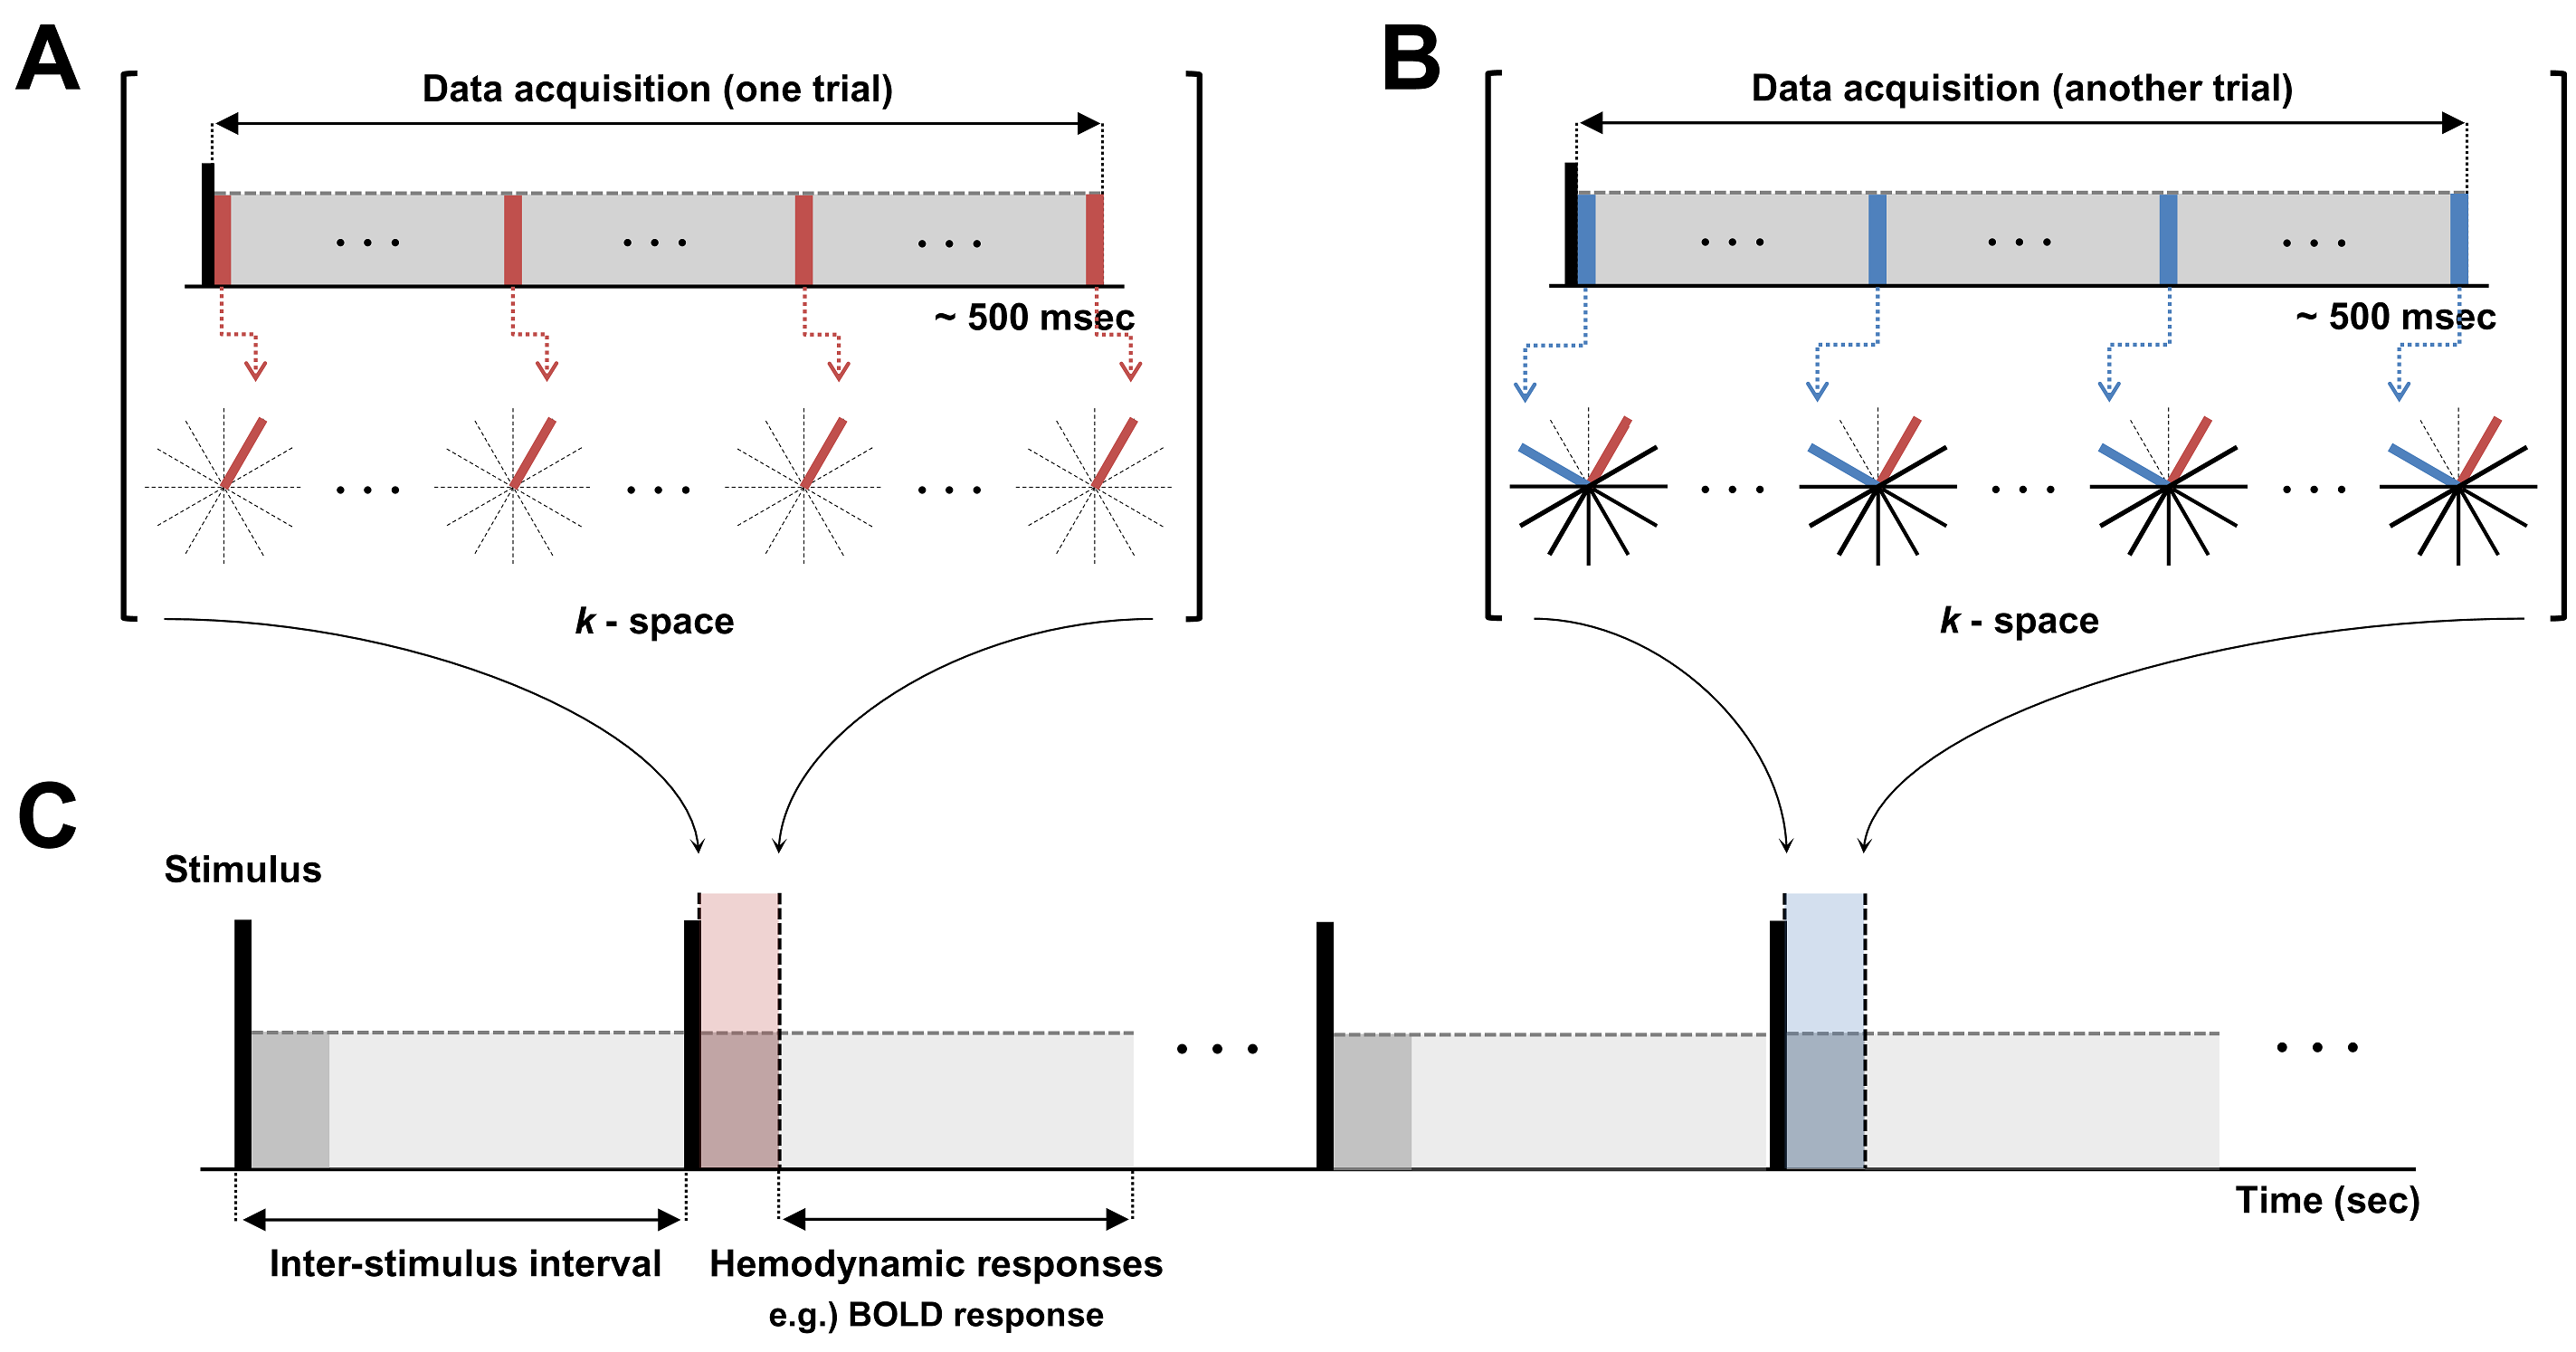
Line-scan-based UTE Imaging Method: The main idea of the new method is that, if we could increase the temporal resolution up to the order of action-potential duration in an event-related design, transient effects of action potential could maximally be caught up and coherently accumulated in repeated trials, thereby being highly probable to be detected. For that purpose, we combined line-scanning method12 with 2D-UTE imaging, the schematic diagram of which is shown in Fig.1. At each trial, same k-space lines were acquired and trials were repeated incrementing the radial-view order. Temporal resolution was 4.5ms.
Data Processing and Analysis: Images were reconstructed with a home-built MATLAB(ver.8.2.0;R2013b) program using fast-Fourier-transform(FFT) with gridding. A series of 2D spatial mapping of responses to action potential or currents were acquired from the time-series images after filtering the time-course data. A notch filter was applied to eliminate 60-Hz electrical noise and a weak low-pass filter with a cutoff at 80Hz was applied to reduce noises.
Experiments: Experiments were performed on a 9.4-T Bruker (BioSpec 94/30, Ettlingen, Germany) scanner. A squid axon and a thin-copper wire were inserted into a cylindrical phantom with buffer solution and 1-% agarose gel, respectively, and placed perpendicular to B0 inside the magnet. A single coronal-slice was taken. Common scan parameters were: TR/TE = 4.5/0.25ms and, thus, temporal resolution = 4.5ms, slice-thickness = 5mm, Number-of-radial-spokes = 202. No averaging was tried.
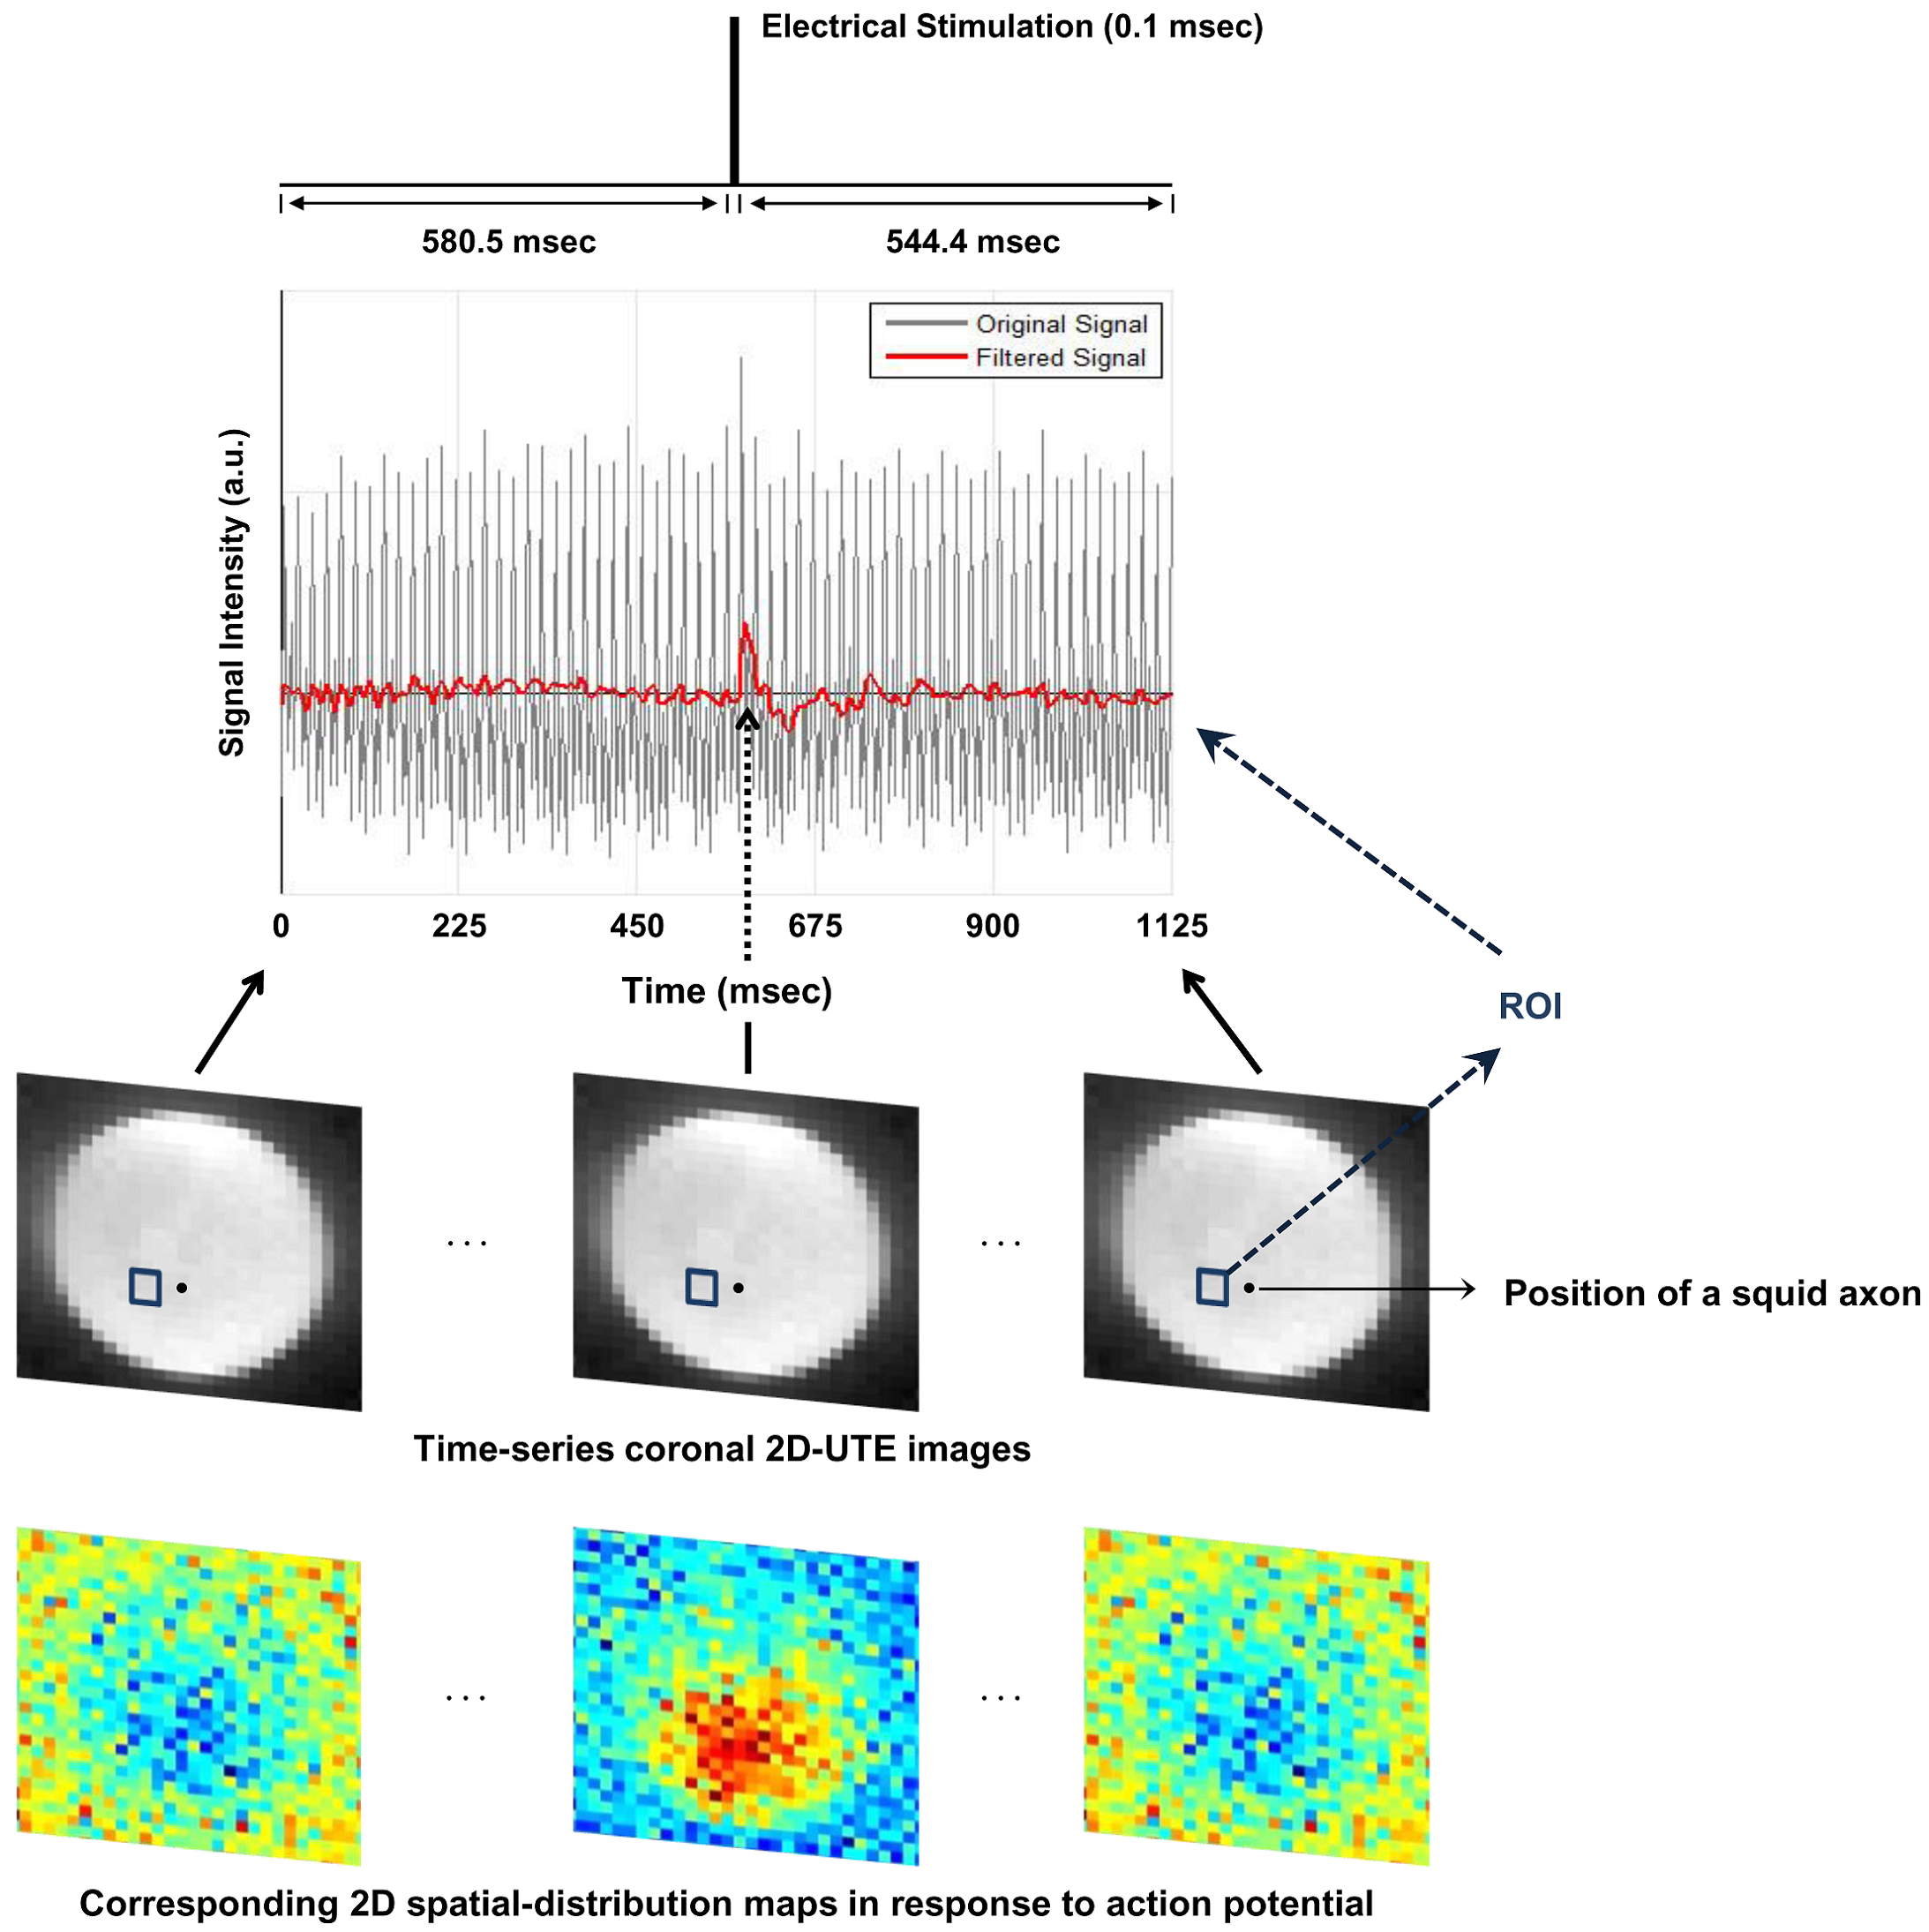
Ex-vivo squid giant-axon imaging: An event-related design was used with three consecutive periods at each trial: 900ms(off)-0.1ms(on)-544.4ms(off). Electrical stimulation was applied with 110 mV, which is on the order of action-potential voltage. A series of 321 images were acquired: number-of-trials = 202, scan-time = 10min, spatial-resolution = 1.26mm2, FA=3°.
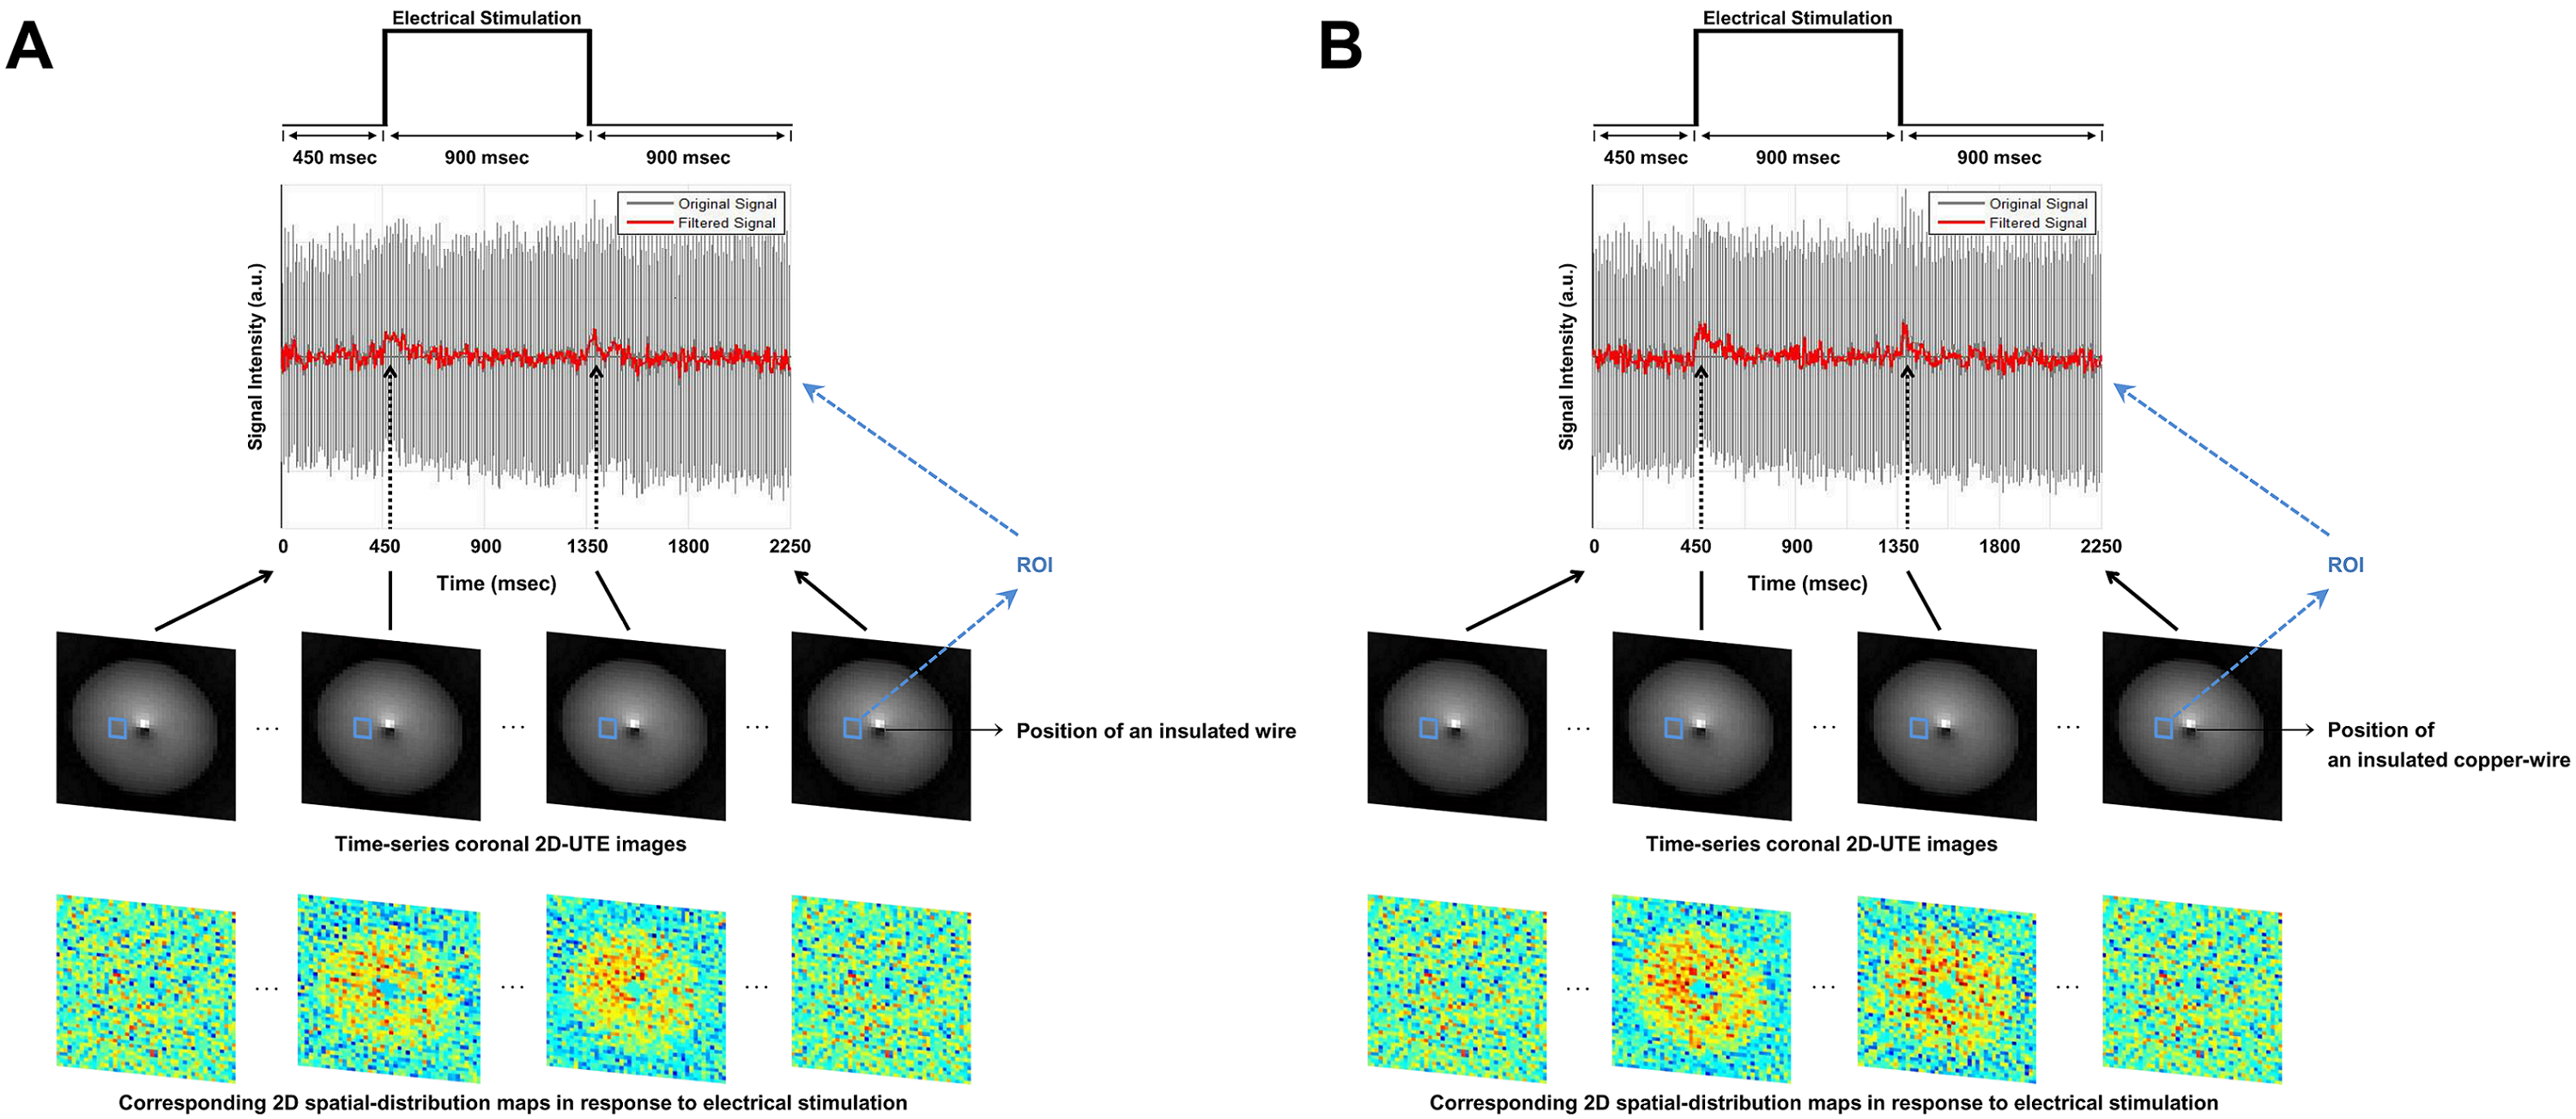
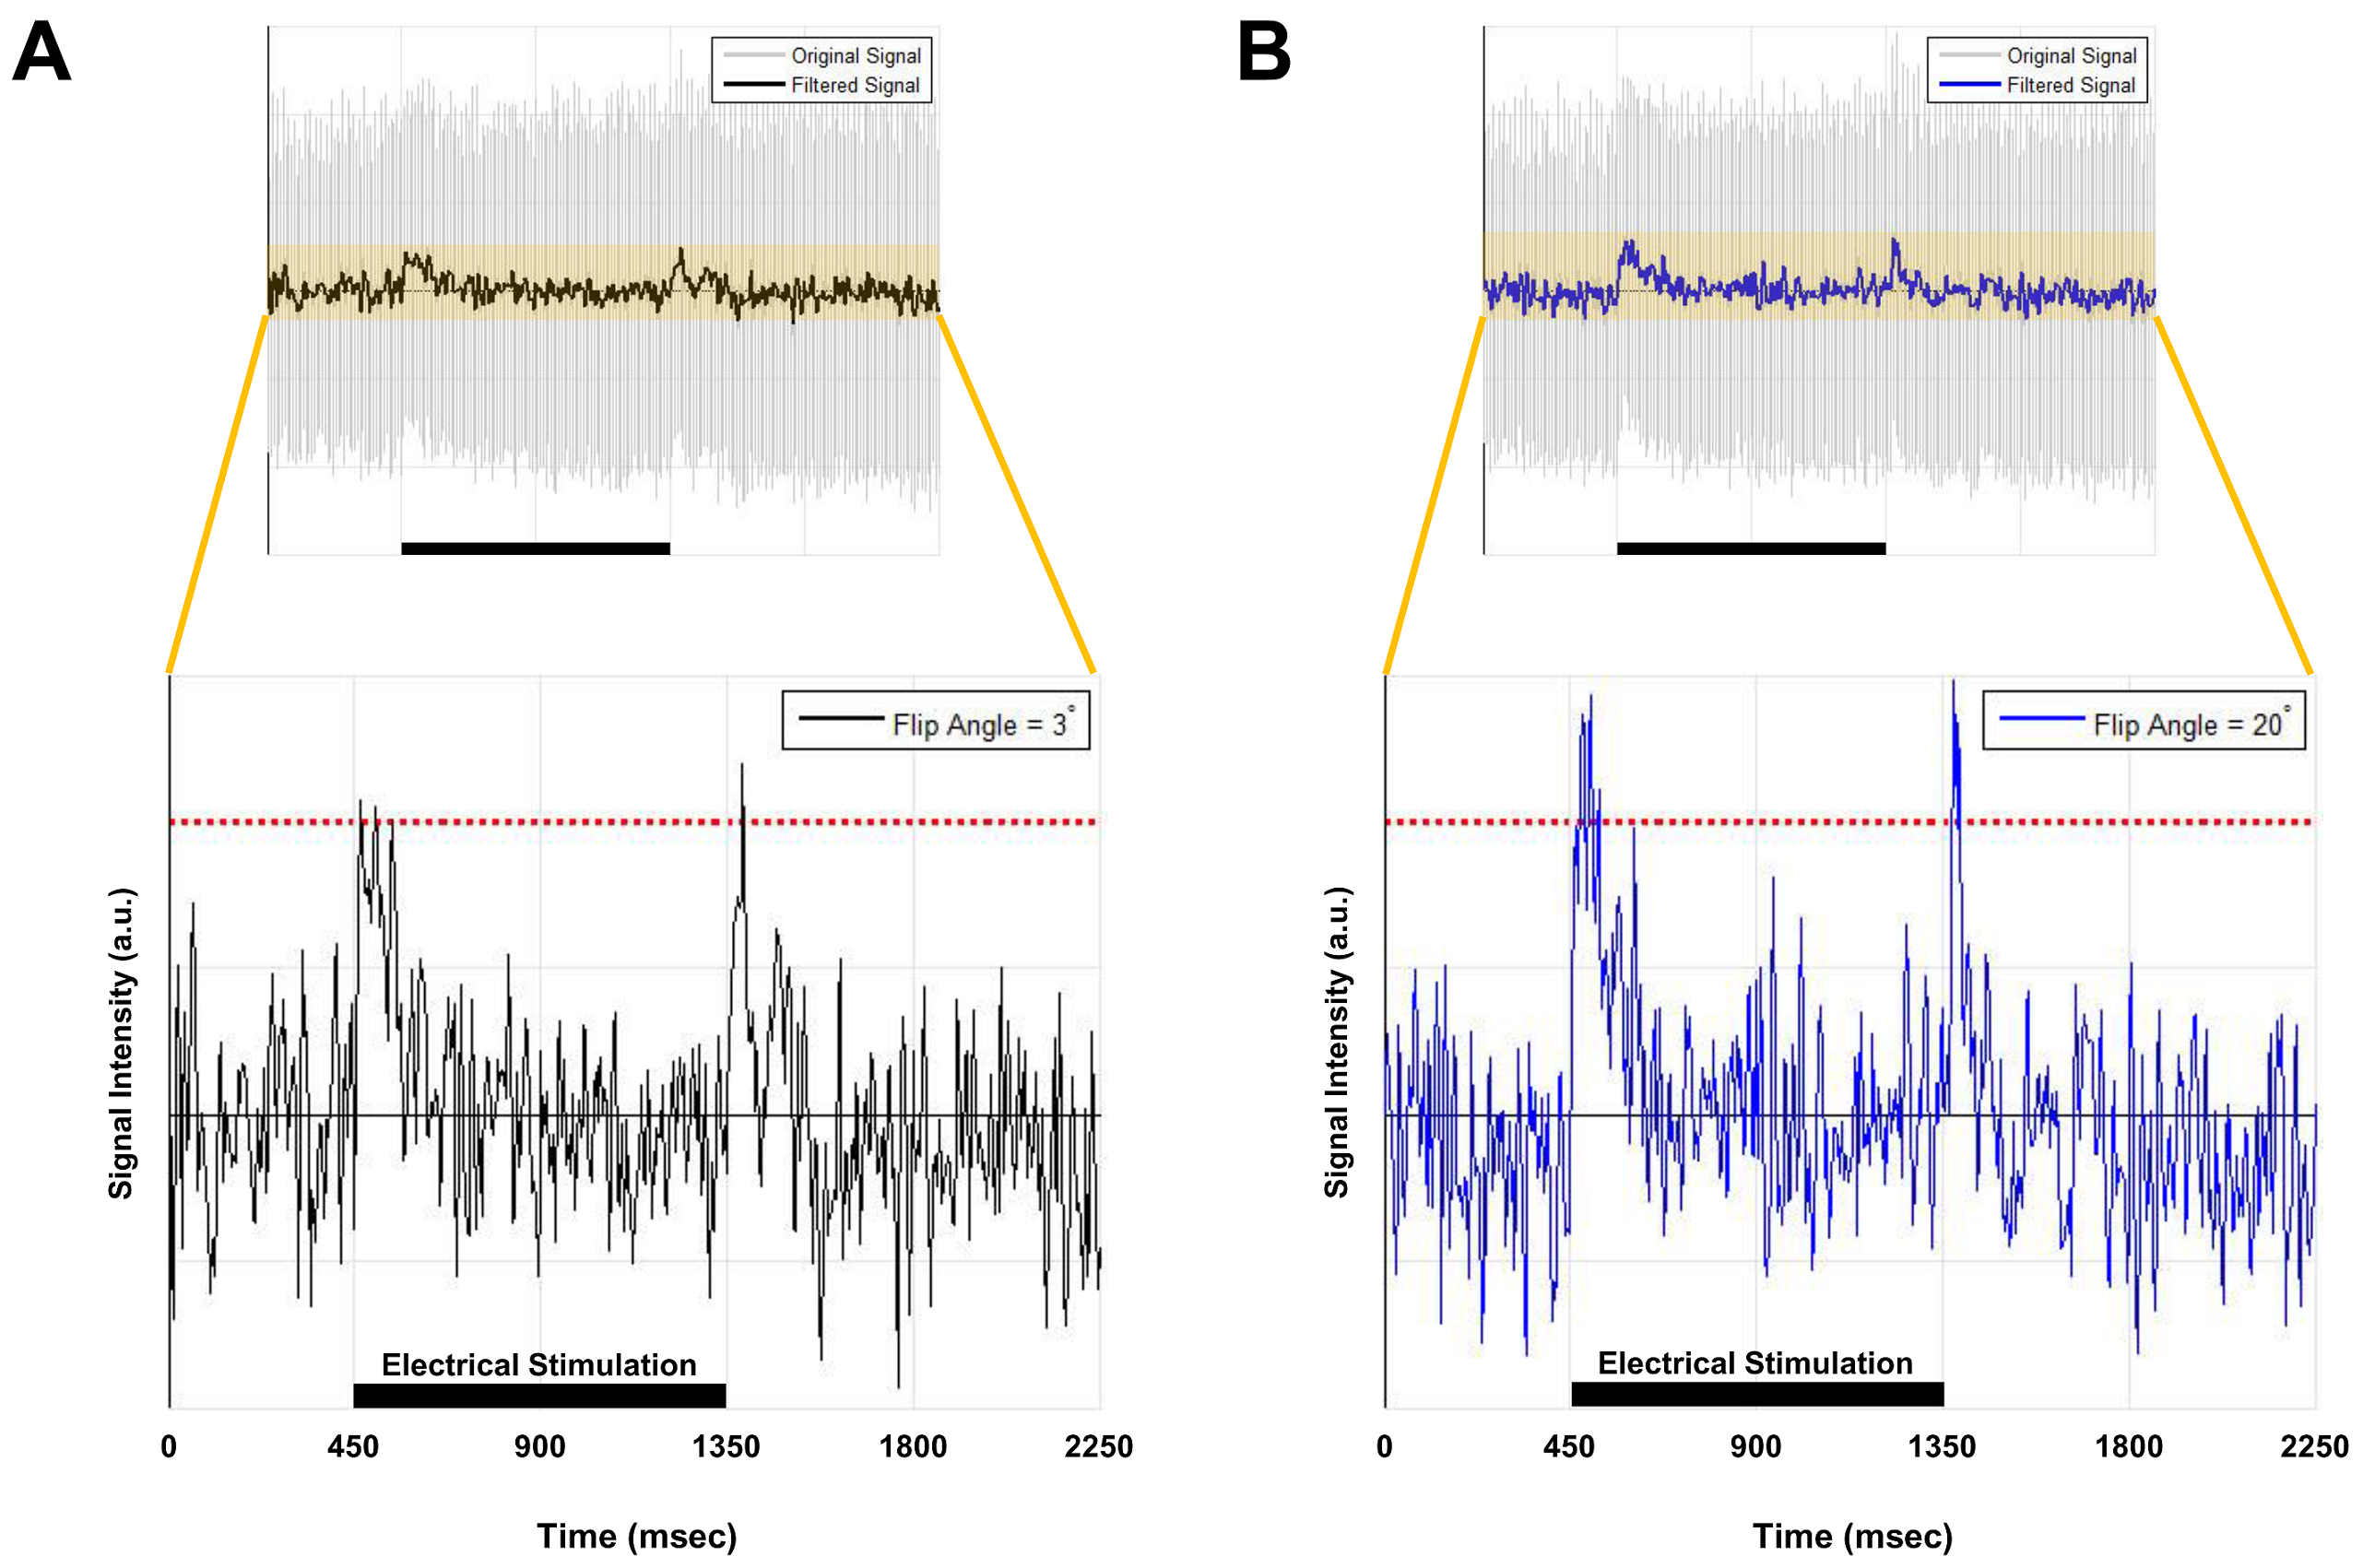
Current-carrying wire imaging: Each trial consisted of 1,800ms(off)-900ms(on)-900ms(off). Current was applied with 500mV. A series of 800 images were acquired: scan-time = 12min, spatial-resolution = 1.56mm2. FA = 3° and 20°.
Results
Figures 2 and 3 show experimental results for ex-vivo squid-axon imaging and insulated-wire imaging, respectively. Top rows display electrical-stimulation paradigms. Time-course data(second row) extracted from the region-of-interest(ROI) of the time-series images(third row) showed ~10% signal increase when electrical stimulation was applied to the axon(Fig.2). In case of wire, signals increased only at the instant of turning on and off the current(Fig. 3). Fourth rows illustrate 2-D spatial distributions of signal change in each time-series image, showing that signal increase was highest in the vicinity of axon or wire and was decreasing with a distance in an almost isotropic way. Figure 4 shows the difference in signal change for two different flip angles. The relative signal-increase was ~10% at 20° when compared to 3°. At each flip angle, the relative signal-increase at the instant of on- and off-stimulation was ~1% with reference to background signals.Discussion and Conclusion
Here we reported very promising results for direct detection and spatial mapping of neuronal activity. The key to the new idea is to increase temporal resolution up to the order of action-potential duration so that transient effects of action potential can maximally be caught up and coherently accumulated in an event-related design. Despite the exciting results, however, underlying contrast-generation mechanism is not fully understood yet. According to the wire experiments, signal change only occurred at the very instant of current-on and -off, not during the current application. This implies that our observation may not relate to magnetic field as usual, but to electric field induced by magnetic-field change. Possible sources of signal change might be T1 or ionic-flow-induced conductivity change correlated with electric field. Besides underlying mechanism, in-vivo applicability also needs to be tested.Acknowledgements
This work was supported by NRF-2017R1A2B2004944 and IBS-R015-D1.References
[1] Bodurka J, Bandettini PA. Magn Reson Med. 2002; 47:1052-1058.
[2] Bianciardi M, et al. Magn Reson Imaging. 2004; 22:1429-1440.
[3] Kamei H, et al. IEEE Trans On Magnetics. 1999; 35:4109-4111.
[4] Chow LS, et al. NeuroImage. 2006; 30:835-846.
[5] Park TS, et al. Physiol Meas. 2006; 27:191-190.
[6] Petridou N, et al. Proc Natl Acad Sci. 2006; 103(43):16015-16020.
[7] Singh M. IEEE Trans Nucl Sci. 1994; 41:349-351.
[8] Chu R, et al. NeuroImage. 2004; 23:1059-1067.
[9] Parkes LM, et al. Magn Reson Med. 2007; 57:411-416.
[10] Tang L, et al. Magn Reson Imaging. 2008; 26:484-489.
[11] Luo Q, et al. NeuroImage. 2009; 47:1268-1276.
[12] Yu X, et al. Nat Methods. 2014; 11:55-58.
Figures