0702
First Application of Automated Hippocampal Subfield Segmentation using 7T MRI in Patients with Major Depressive Disorder1Radiology, Icahn School of Medicine At Mount Sinai, New York, NY, United States, 2Biomedical Engineering, City College of New York, New York, NY, United States, 3Neurosurgery, Icahn School of Medicine At Mount Sinai, New York, NY, United States, 4Biomedical Engineering, University of Pennsylvania, Philadelphia, PA, United States, 5Psychiatry, Icahn School of Medicine At Mount Sinai, New York, NY, United States, 6Population Health Science and Policy Department, Icahn School of Medicine At Mount Sinai, New York, NY, United States, 7Radiology, Mount Sinai Medical Center, New York, NY, United States, 8Neuroscience, Icahn School of Medicine At Mount Sinai, New York, NY, United States
Synopsis
Major depressive disorder (MDD) is a debilitating illness, which is widely prevalent. There is a need to elucidate MDD pathophysiology to better target treatment. Studies have shown association between hippocampal subfield volumes and MDD, making the subfields potential biomarkers. We use high-resolution 7T-MRI to perform effective subfield delineations and evaluate subfield volume differences between sixteen patients and sixteen controls. Using automatic segmentation of hippocampal subfields software revealed a trend towards reduced right-CA1 and right-DG subfield volumes in patients compared to controls. Identifying hippocampal subfield volumes as imaging biomarkers for MDD may help design more targeted treatments for the disease.
Introduction
Major depressive disorder (MDD) is a debilitating illness of high prevalence worldwide, affecting approximately 6.7% of the US population annually1. There is a pressing need to elucidate the pathophysiology of MDD to better target treatment. Previous studies have shown association between hippocampal subfield volume changes in MDD, making them potential biomarkers for the disease.2-4 Using ultrahigh field MRI scanners, such as those operating at 7 Tesla (7T), allow for more effective subfield measurements than conventional clinical strength scanners due to superior contrast and resolution. In this study, we evaluate differences in subfield volumes between MDD patients and healthy controls by exploiting imaging properties of 7T scans.Methods
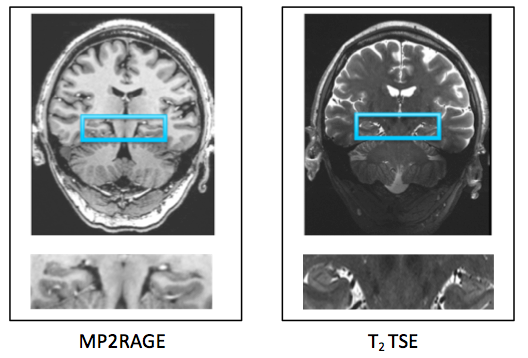
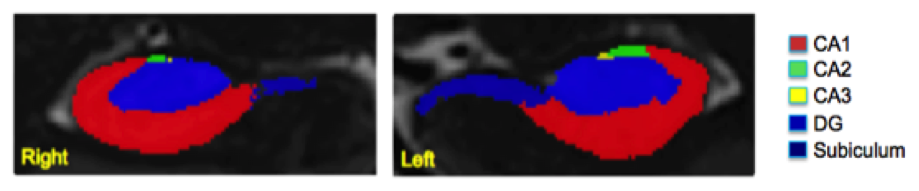
Sixteen MDD patients (ages 24-55) and sixteen healthy controls (24-55 years) underwent MRI scanning at 7T (Magnetom, Siemens). The imaging protocol consisted of MP2RAGE (TR=6000 ms, TI1=1050 ms, TI2=3000 ms, TE=5.06 ms, voxel size=0.8x0.8x0.8 mm3) and T2 TSE (TR=9000 ms, TE=69 ms, voxel size=0.45x0.45x2 mm3) acquired in a coronal oblique orientation, perpendicular to the long axis of the hippocampus. Figure 1 shows the hippocampus on sample MP2RAGE and T2 TSE images. Using Automatic Segmentation of Hippocampus Subfields (ASHS) software5, we generated subfield volumes to assess differences in subfields among all subjects. Subfield volumes included: cornu ammonis one (CA1), cornu ammonis two and three (CA2-3), dentate gyrus (DG), and subiculum on both sides. A sample overlay of subfield segments on a single slice is displayed in Figure 2. A comparison of the MDD patients to healthy controls was performed for each subfield volume.Results
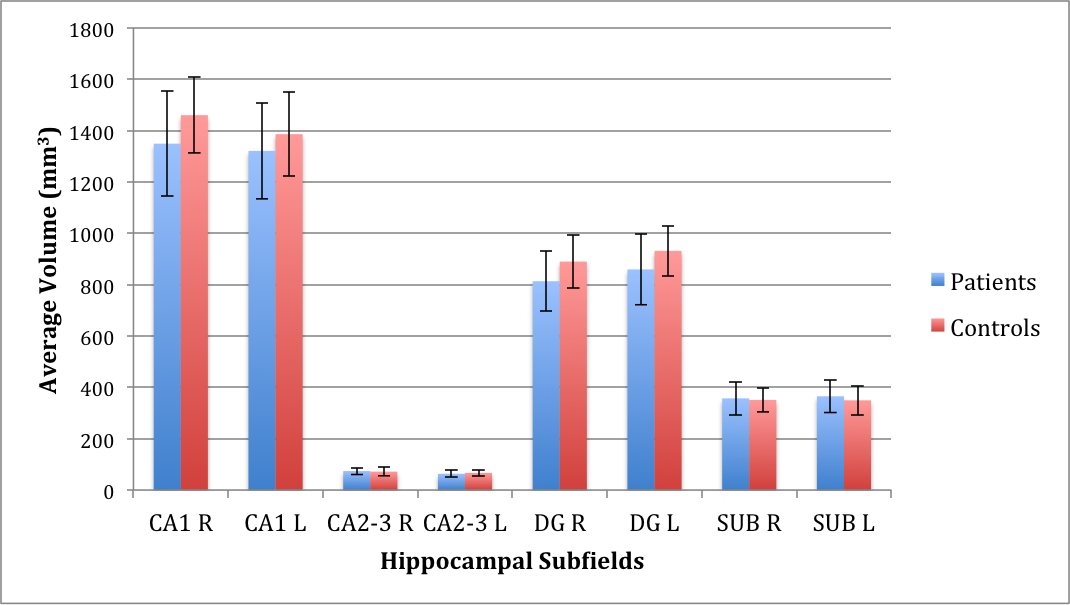
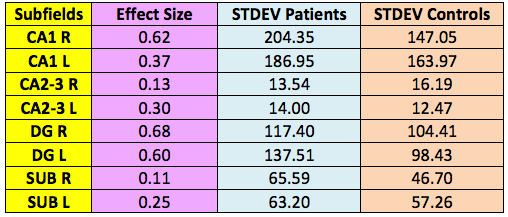
A trend towards significance was found in the difference between patients and controls in average CA1 volume on the right side (p=0.088) and average DG volume on the right side (p=0.060), with patients having reduced volumes compared to controls. The average volume differences are shown in Figure 3. Effect sizes of 0.62 and 0.68 were found for right CA1 and right DG respectively, as displayed in Table 1.Discussion
We have demonstrated feasibility of automated hippocampal subfield segmentation at 7T for comparing MDD patients and controls. A trend towards significance was found for reduced volumes in right CA1 and right DG in patients compared to controls. This volume loss may reflect a reduction in astrocyte density and neurogenesis in MDD6, 7. We are performing an ongoing study and plan to scan more patients and controls to increase sample size. We expect effect sizes to increase with greater sample size, however the trends we are observing are concordant with subfields that are implicated in depression pathology6-8 and therefore are promising. We also plan to compare to manual tracings and Freesurfer 6.0 subfield segmentations to validate these automated results. Hippocampal subfield volumes may serve as imaging biomarkers for MDD, which may help design more targeted treatments for the disease.Acknowledgements
NIH R01 MH109544
NIH R01 CA202911-01A1
NARSAD Young Investigator Grant
Icahn School of Medicine Capital Campaign
References
1. Kessler, R.C., P. Berglund, O. Demler, R. Jin, D. Koretz, K.R. Merikangas, et al., The epidemiology of major depressive disorder: results from the National Comorbidity Survey Replication (NCS-R). Jama, 2003. 289(23): p. 3095-3105.
2. Huang, Y., N.J. Coupland, R.M. Lebel, R. Carter, P. Seres, A.H. Wilman, et al., Structural changes in hippocampal subfields in major depressive disorder: a high-field magnetic resonance imaging study. Biological psychiatry, 2013. 74(1): p. 62-68.
3. Malykhin, N.V., M. Peter Seres BSc, and N.J. Coupland, Structural changes in the hippocampus in major depressive disorder: contributions of disease and treatment. Journal of psychiatry & neuroscience: JPN, 2010. 35(5): p. 337.
4. Malykhin, N. and N. Coupland, Hippocampal neuroplasticity in major depressive disorder. Neuroscience, 2015. 309: p. 200-213.
5. Yushkevich, P.A., J.B. Pluta, H. Wang, L. Xie, S.L. Ding, E.C. Gertje, et al., Automated volumetry and regional thickness analysis of hippocampal subfields and medial temporal cortical structures in mild cognitive impairment. Human brain mapping, 2015. 36(1): p. 258-287.
6. Travis, S., N.J. Coupland, P.H. Silversone, Y. Huang, E. Fujiwara, R. Carter, et al., Dentate gyrus volume and memory performance in major depressive disorder. Journal of affective disorders, 2015. 172: p. 159-164.
7. Saur, L., P.B. Bagatini, L.T. Neves, R.M. de Oliveira, S.P. Vaz, K. Ferreira, et al., Experimental Post-traumatic Stress Disorder Decreases Astrocyte Density and Changes Astrocytic Polarity in the CA1 Hippocampus of Male Rats. Neurochemical research, 2016. 41(4): p. 892-904.
8. Frodl, T., A. Carballedo, E.-M. Frey, V. O'Keane, N. Skokauskas, D. Morris, et al., Expression of glucocorticoid inducible genes is associated with reductions in cornu ammonis and dentate gyrus volumes in patients with major depressive disorder. Development and psychopathology, 2014. 26(4pt2): p. 1209-1217.
Figures