0701
High resolution T1-weighted brain imaging and segmentation at 7T: a travelling head study1School of Physics and Astronomy, University of Nottingham, Sir Peter Mansfield Imaging Centre, Nottingham, United Kingdom, 2Nuffield Department of Clinical Neurosciences, University of Oxford, Wellcome Centre for Integrative Neuroimaging (FMRIB), Oxford, United Kingdom, 3School of Psychology, Cardiff University, Cardiff University Brain Research Imaging Centre, Cardiff, United Kingdom, 4Department of Clinical Neurosciences, University of Cambridge, Wolfson Brain Imaging Centre, Cambridge, United Kingdom, 5University of Glasgow, Institute of Neuroscience & Psychology, Glasgow, United Kingdom
Synopsis
Ultra-high magnetic field (7T) MRI scanners can provide high spatial resolution images and excellent contrast for classifying brain tissue in vivo, but imaging reproducibility and tissue segmentation between sites is key for multi-site studies. Here, we present a travelling-head study focusing on the harmonized acquisition and segmentation of T1-weighted images acquired on three subjects at 0.7mm3 isotropic resolution at four different 7T sites. The aim of the study is to assess the harmonisation and robustness of the MPRAGE and MP2RAGE sequence across sites, by focusing on segmentation reproducibility and T1 estimation.
Introduction
Ultra-high magnetic field (7T) MRI scanners can provide high spatial resolution images and excellent contrast for classifying brain tissue in vivo, but imaging reproducibility and tissue segmentation between sites is key for multi-site studies. Here, we present a travelling-head study focusing on the harmonized acquisition and segmentation of T1-weighted images acquired on three subjects at 0.7mm3 isotropic resolution at four different 7T sites. The aim of the study is to assess the harmonisation and robustness of the MPRAGE and MP2RAGE sequence across sites, by focusing on segmentation reproducibility and T1 estimation.Methods
Acquisition: Three volunteers (all male, 31±4years) were scanned once at each of the four sites (Site A:Siemens Terra, Sites B&D:Siemens Magnetom, Site C:Philips Achieva) under local ethics approval. A standardised 3D-MP2RAGE acquisition was implemented on all sites using the following parameters: 0.7x0.7x0.7mm3, FOV=224x224x157mm3, acceleration factor (A>>P) of 3 (GRAPPA/SENSE for Siemens/Philips systems), TR of 3500ms, echo spacing of 6.3ms[BW=300Hz], flip angles of 5/2˚ and inversion times (TI) of 725/2150ms for the first/second images. The acquisition time was 6min14s/7min51s (SENSE/GRAPPA). The same adiabatic inversion pulse(1) was successfully implemented on all sites. MPRAGE image data was also acquired on all sites (echo spacing of 7.1ms[BW=240Hz], flip angle of 8˚, TI=1050ms, TR=2200ms, Acceleration factor SENSE/GRAPPA =2, acquisition time=5min53s/6min35s) with the same FOV, resolution and inversion pulse.
Processing: Offline PSIR reconstruction(2) was carried out on all MP2RAGE data after Uniform Sensitivity Roemer coil combination(3) (offline on Siemens scanners). The brain was extracted from both MPRAGE and MP2RAGE data using BET(4) and further segmented using FAST(4). Additionally, both MPRAGE and MP2RAGE data were segmented using Freesurfer(5) after inhomogeneity correction (MPRAGE) using spm12(6), and skull-masking (MP2RAGE). Since manual editing was required for the MPRAGE images (site independent), we focus here on the results of the MP2RAGE segmentation. An unbiased within-subject template space was created from the MP2RAGE datasets from the four sites, before tissue classification was done via Freesurfer using the longitudinal stream(7). A look-up table (LUT) was numerically calculated using Bloch-simulations incorporating the exact sequence parameters to allow T1 estimation from the MP2RAGE signals. Dice Similarity Coefficients (DSC) were also computed on the cortical ribbon segmentation, comparing the segmentation from the four different sites to the average subject space.
Results
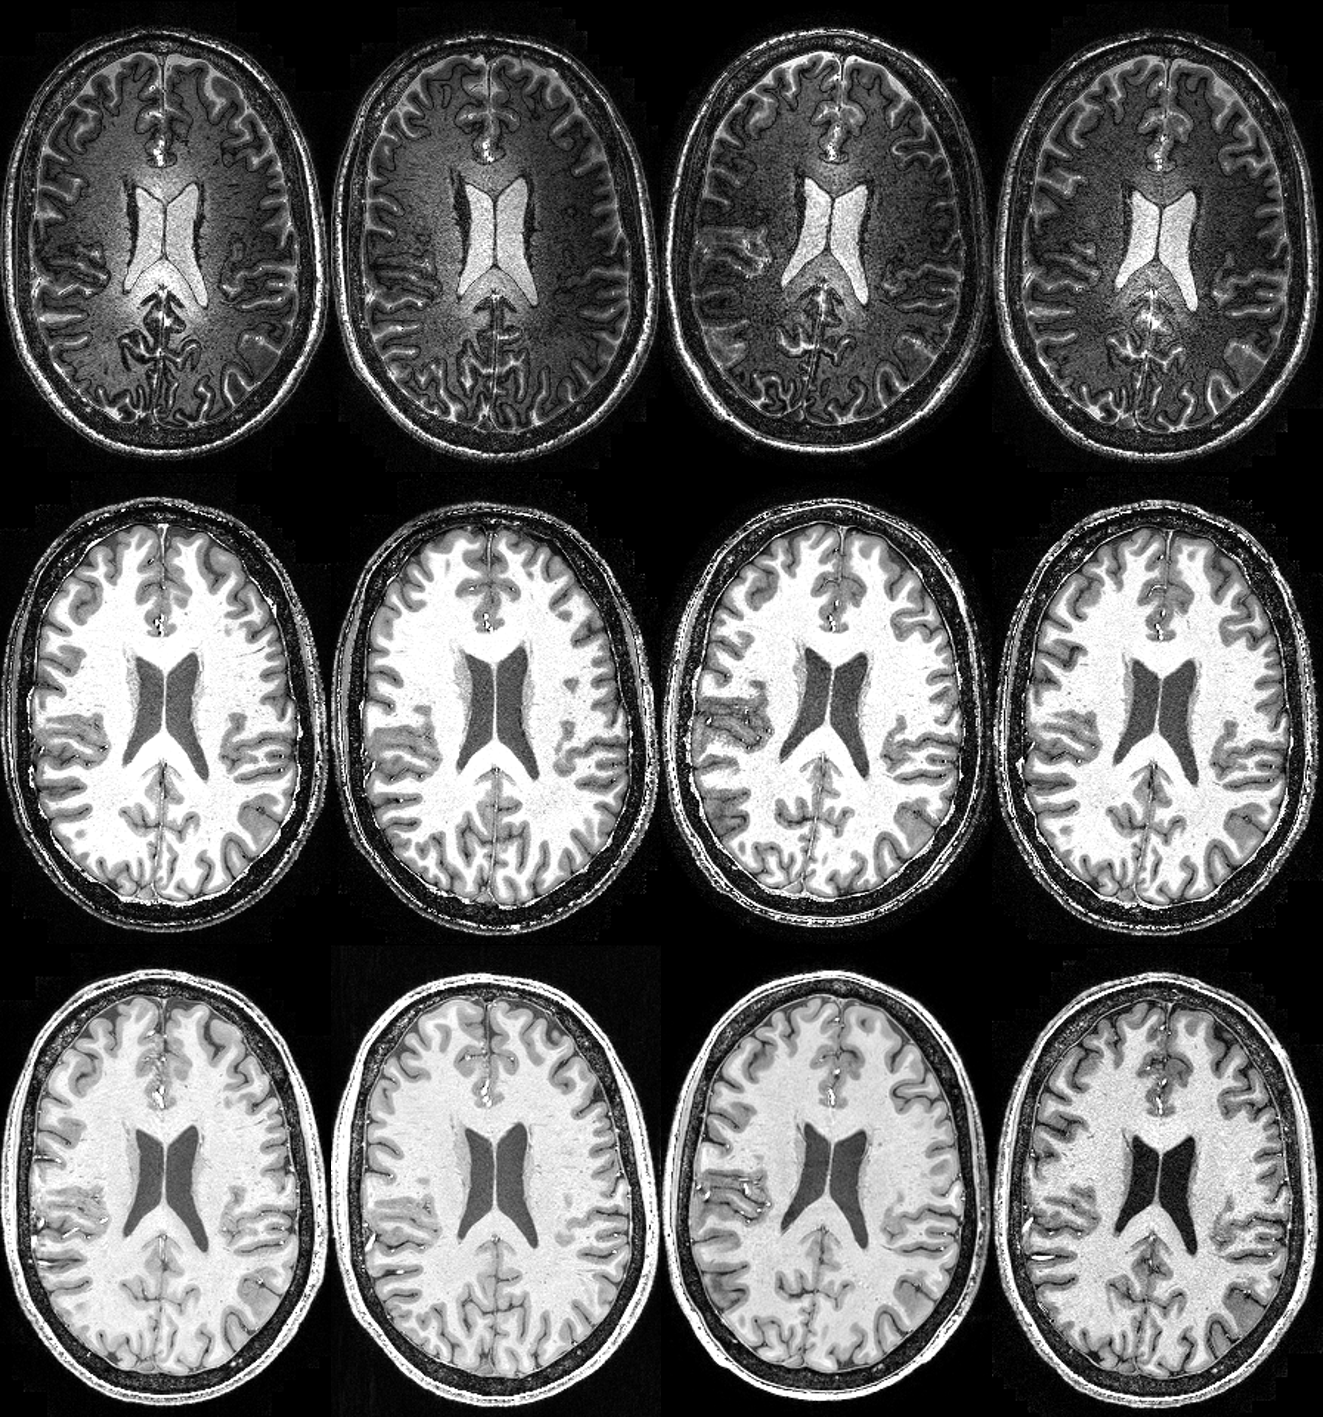
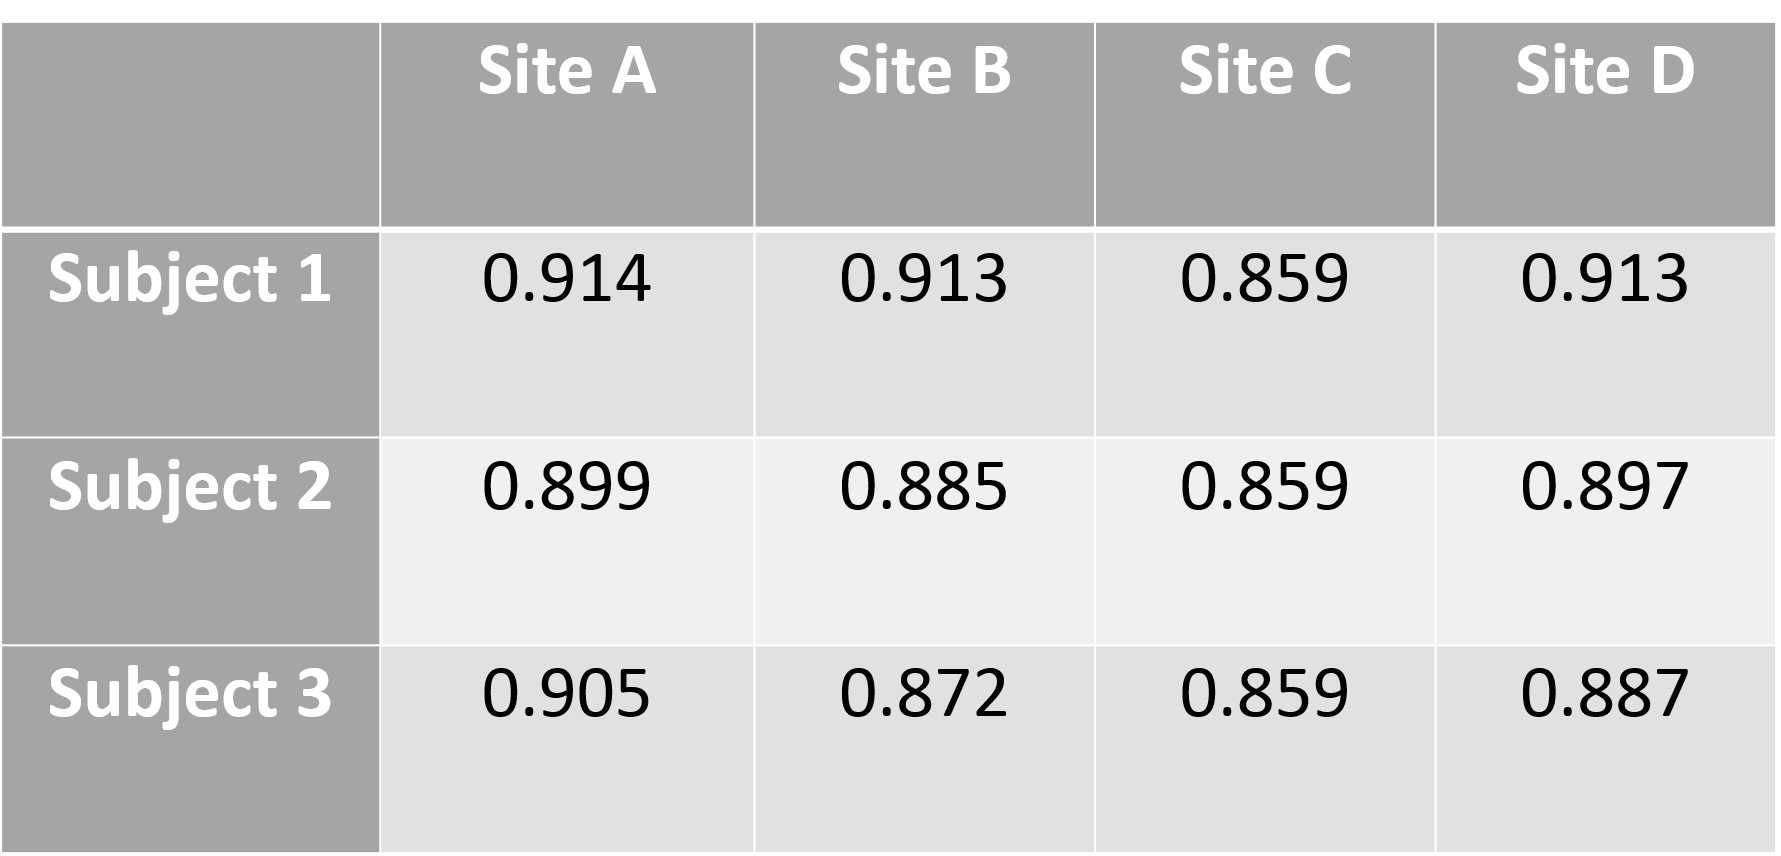
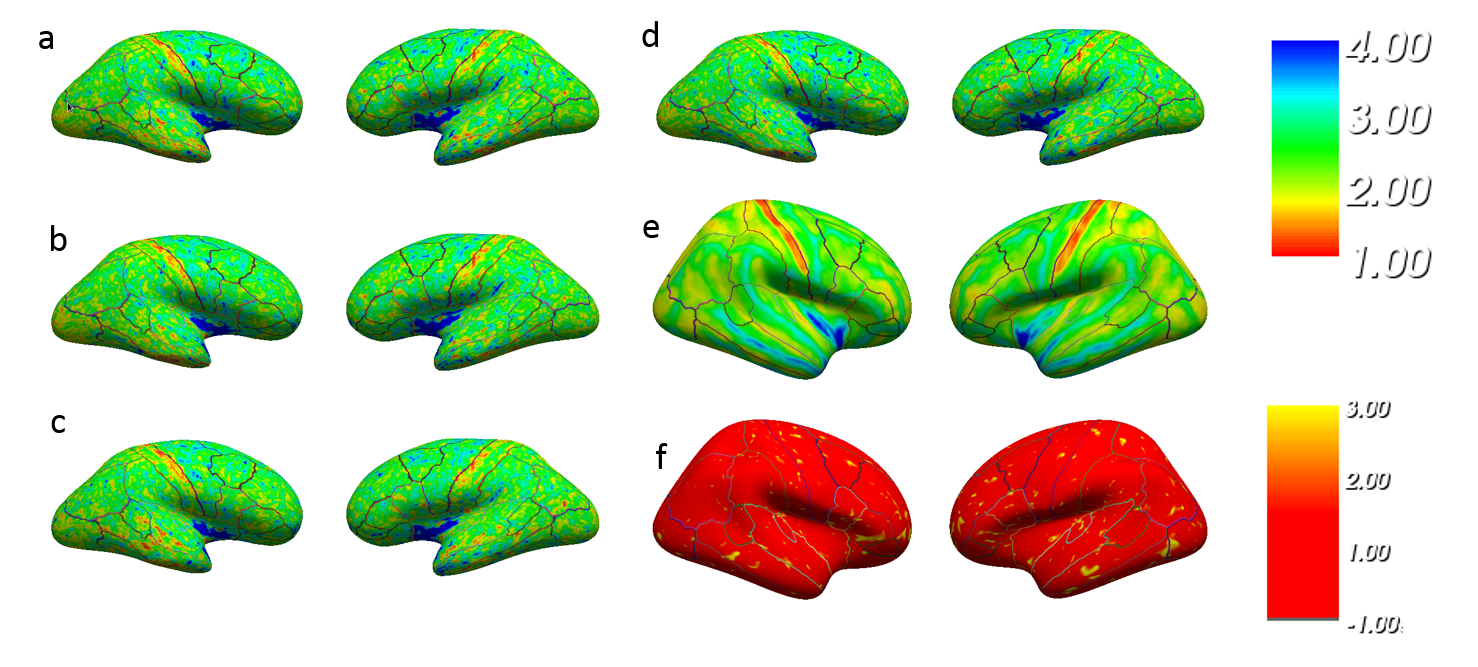
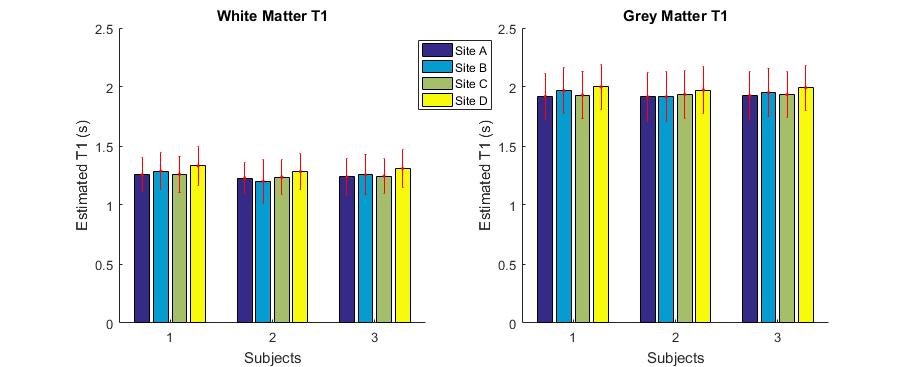
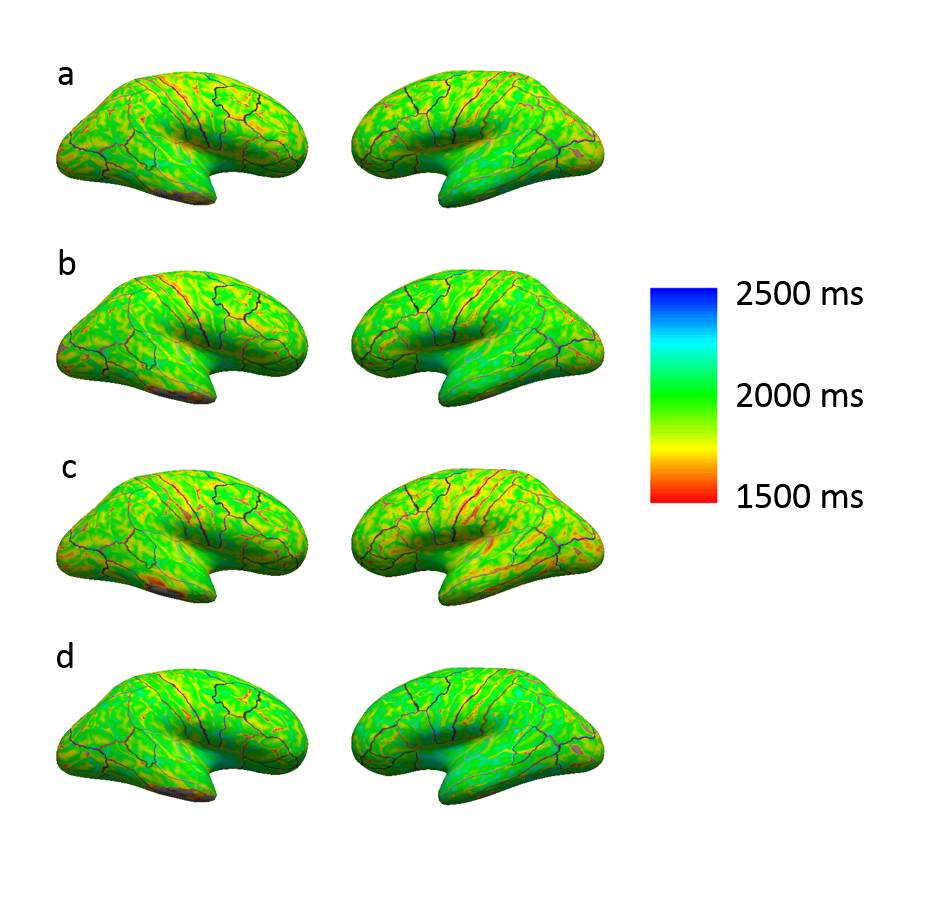
Images with similar quality and high contrast to noise ratio (CNR) were produced at all sites (Figure 1). Strong contrast was observed on the reconstructed PSIR, which was superior to the contrast in MPRAGE images (CNRGM/WM of 6.1 for MP2RAGE versus 4.9 for MPRAGE). Good agreement between sites could be obtained for the cortical ribbon segmentation via Freesurfer (Dice coefficient between 0.859 and 0.91, see Table 1), with one site producing a consistently lower value. The cortical thickness was compared using a repeated measure analysis of variance (ANOVA), looking at the effect of sites on the individual subject segmentations. No brain area showed a significant difference in cortical thickness across sites (Figure 2). After taking into account the average B1 inhomogeneity measured across subjects across sites in the LUT, measured T1 values were in good agreement with the literature(8) (mean(stdev) of T1WM=1.26s (0.16) and T1GM=1.94s (0.20)).Discussion
Segmentation of MP2RAGE data using Freesurfer produced robust quantitative cortical thickness measurements across sites, but segmentation with the MPRAGE sequence required additional manual editing and was thus not yet included in this study. Some small cortical thickness variation is visible on Figure 2, and could be improved with a more robust brain extraction step for the MP2RAGE data. Although the measured T1 values were in the same range across sites, small residual variations observed due to B1 variation are present. Correction for B1 will be implemented in the LUT(9) to allow reduction of variability in the measured T1 via use of B1 maps. It is also possible that some variation is due to differences in power normalization across sites, since each manufacturer uses a different technique for power optimization. Similarly, comparison of the gradient linearity and associated software compensation for gradient-related spatial distortion across sites is necessary as small variations in the gradient specifications could alter the brain shape, which could explain the lower DSC for the site with a different gradient set/manufacturer.Conclusion
The implementation, acquisition and segmentation of a high-resolution T1-weighted anatomical scan using harmonised sequences has been successfully demonstrated on this travelling head study dataset. Good agreement in segmentation and cortical thickness, as well as in quantitative T1 measurements is reported here, and will now be tested in a larger travelling head study involving 10 subjects scanned at five sites.Acknowledgements
We acknowledge the UK Medical Research Council for funding support (MR/N008537/1).References
(1): Tailored RF pulse for magnetization inversion at ultrahigh field. Hurley AC, Al-Radaideh A, Bai L, Aickelin U, Coxon R, Glover P, Gowland PA. Magn Reson Med (2010) 63: 51–58.
(2): Imaging gray matter with concomitant null point imaging from the phase sensitive inversion recovery sequence. Mougin O, Abdel-Fahim R, Dineen R, Pitiot A, Evangelou N, Gowland PA. Magn Reson Med (2016) 76: 1512-1516.
(3): The NMR Phased Array. Roemer PB, Edelstein WA, Hayes CE, Souza SP, Mueller OM. Magn Reson Med (1990) 16: 192–225
(4): FSL. Jenkinson M, Beckmann CF, Behrens TE, Woolrich MW, Smith SM. NeuroImage (2012), 62:782-90. (http://www.fmrib.ox.ac.uk/fsl)
(5): Cortical surface-based analysis. I. Segmentation and surface reconstruction. Dale AM, Fischl B, Sereno MI, Neuroimage (1999) 9, 179-194. (http://surfer.nmr.mgh.harvard.edu/)
(6): SPM 12: http://www.fil.ion.ucl.ac.uk/spm/software/spm12/
(7): Within-Subject Template Estimation for Unbiased Longitudinal Image Analysis. Reuter, M., Schmansky, N.J., Rosas, H.D., Fischl, B. Neuroimage (2012) 61 (4), 1402-1418.
(8): Water proton T1 measurements in brain tissue at 7, 3, and 1.5T using IR-EPI, IR-TSE, and MPRAGE: results and optimization. Wright PJ, Mougin OE, Totman JJ, Peters AM, Brookes MJ, Coxon R, Morris PE, Clemence M, Francis ST, Bowtell RW, Gowlans PA. Magn Reson Mater Phy (2008) 21: 121
(9): New Developments and Applications of the MP2RAGE Sequence - Focusing the Contrast and High Spatial Resolution R1 Mapping. Marques J, Gruetter R. PLoS ONE8(7): e69294.
Figures