0700
Convolutional neural network based segmentation of the the spinal cord and intramedullary injury in acute blunt spinal cord trauma1Radiology and Biomedical Imaging, Zuckerberg San Francisco General Hospital and UCSF, San Francisco, CA, United States, 2Brain and Spinal Injury Center, San Francisco, CA, United States, 3Institute of Biomedical Imaging, NeuroPoly Lab, Polytechnique Montreal, Montreal, QC, Canada
Synopsis
This study aims to develop and validate a convolutional neural network for automatic segmentation of the spinal cord (SC) and intramedullary injury in acute blunt SC trauma patients. Using image augmentation of the axial slice cross section and U-net architecture, we were able to achieve a dice coefficient for SC segmentation of 0.92. The same network architecture was also able to identify areas of intramedullary injury. This is the first study to accurately segment the acute blunt trauma SC. Automatic segmentation of the SC in this population makes automatic biomarker analysis and quantitative prognostication of outcomes possible for SC injury.
Introduction
Automated spinal cord segmentation is an essential step for atlas-based spinal cord (SC) image processing and analysis. Accurate automated SC segmentation is clinically relevant, as it enables registration of patient MR data with SC anatomical atlases for high throughput morphometric and quantitative multi-parametric image analysis. While significant advances in spinal cord segmentation algorithms have been made over the last decade1, current available algorithms are limited, particularly in cases where there is severe spinal cord deformation and intramedullary signal abnormality as seen with acute traumatic spinal cord injury (SCI) patients2. Here, we utilize a two-dimensional convolutional neural network (CNN)3 which uses axial image augmentation and a network architecture that consists of a contracting path and expansive path, to segment the spinal cord in T2w MRI of acute SCI patients as well as acute lesions related to SCI. This network is fully automated and compares favorably to available open-source SC segmentation algorithms for acute SCI MR data. Furthermore, preliminary data using the same network architecture to identify intramedullary signal abnormality in acute SCI patients is presented.Methods
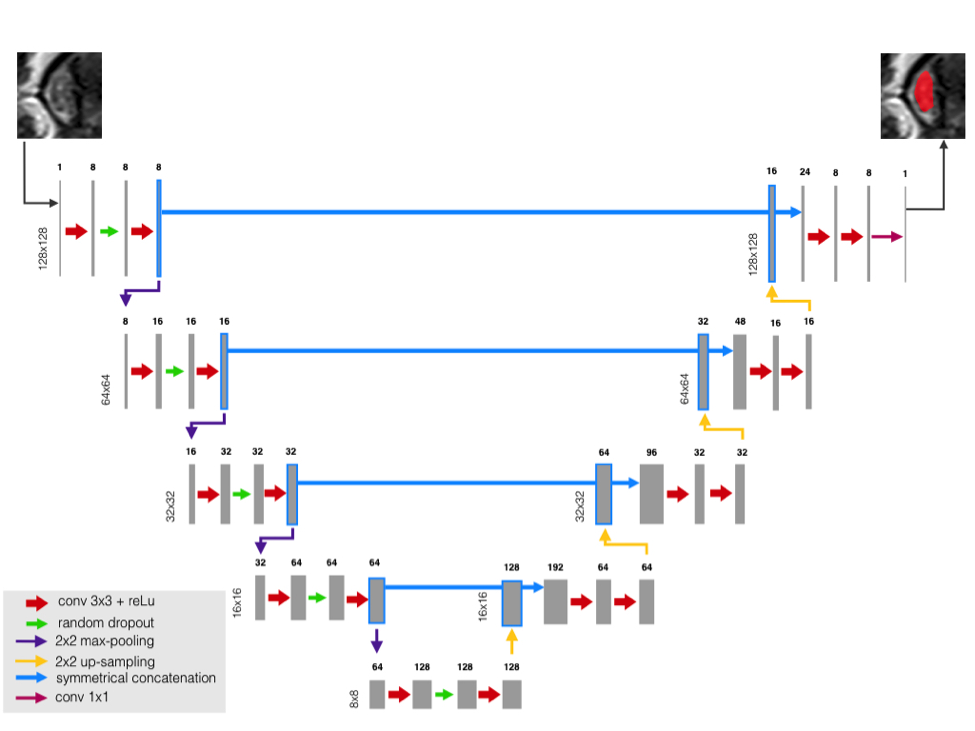
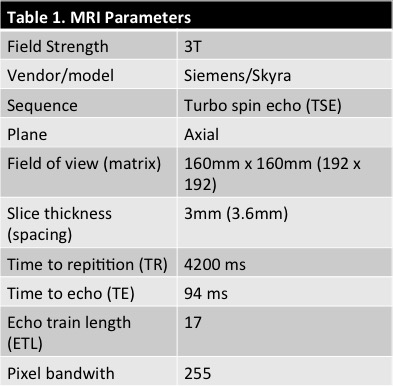
42 patients were scanned on a 3T Skyra Siemens when admitted for SC blunt trauma at the ZSFG trauma center and T2w was acquired (Table 1). The SC and acute lesions were manually segmented by an experienced neuroradiologist (JT). An image analysis pipeline was developed to interpolate images to the same resolution and crop to 128x128 around the SC centerline. Training data consisted of T2w MRIs of the SC for 33 patients which comprised 1036 axial images. The network was trained using eighty percent (829) axial slices of the spinal cord and validated using the remaining 207 images. Fourteen patients were used as the left-out (untrained) test set. The network architecture was based on U-net3 and is described in Figure 1. The same architecture was used for SC and lesion segmentation. T2w MRI images and corresponding masks were randomly augmented in batches of 32 images for each epoch. Data was augmented to prevent overfitting by random rotation (20°), width and height shift (10% of image dimensions), random shearing (intensity of 0.2), random zoom (20% of image dimensions), and random vertical/horizontal flipping. The network was trained to 5000 epochs. The Dice coefficient4 was used to measure the networks segmentation accuracy and the negative Dice coefficient was used as the loss function for backwards propagation. A student’s t-test was used to compare mean segmentation results between the CNN and PropSeg algorithm5 algorithm from the test set.Results
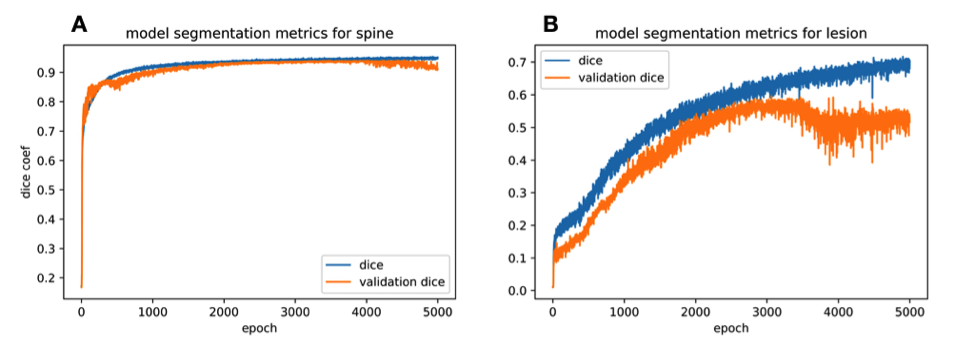
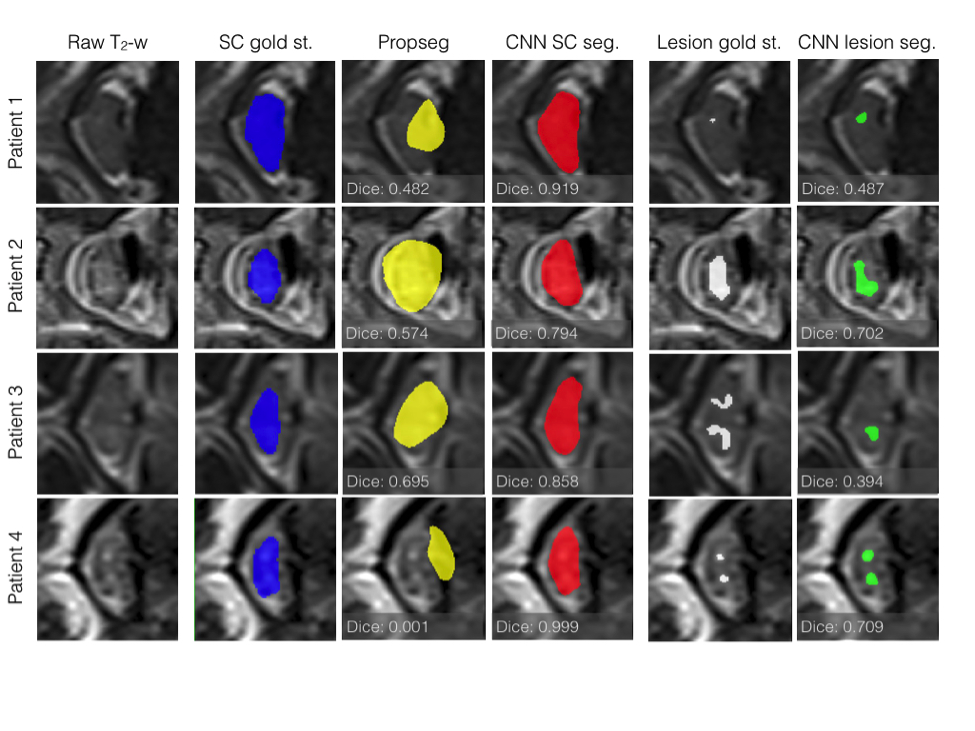
For spinal cord segmentation, the average Dice coefficient for patients in the test set was 0.92 (std: 0.03). For the same test set, the PropSeg algorithm5 from the Spinal Cord Toolbox (SCT)6, showed a Dice coefficient of 0.80 (std: 0.15), significantly lower compared to the CNN (p-value = 0.007). Evolution of the Dice coefficient for the training and validation sets are shown in Figure 2 for spine and lesion segmentation. Similarly, the max Dice coefficient for segmentation of lesions in the training set was 0.72, which reduced to 0.60 in the validation set and 0.42 in the test set (Figure 2B). The cross-sections of four patients which showed tissue damage resulting in particularly difficult segmentation are presented in Figure 3. As can be seen, the CNN performs almost perfectly in segmenting the spinal cord compared to the gold standard radiologist segmentation. Additionally, the lesion CNN model gives satisfactory results given the subjective nature of the gold-standard.Discussion
We applied CNN for automatic segmentation of the spinal cord and intramedullary lesions from T2w MR images in patients with acute blunt spinal cord trauma. Focal regions of spinal cord deformity, effacement of CSF space, and intrinsic intramedullary signal abnormality present in this population render automatic segmentation particularly challenging. The proposed CNN achieved a higher Dice coefficient than state-of-the-art spinal cord segmentation in acute SCI patients. The proposed CNN approach also yielded satisfactory results for automatic injury segmentation in SCI patients. Moreover, manual segmentation of lesions in acute blunt trauma of the spinal cord is not consensual and no perfect gold-standard is available for validation of lesion segmentation methods. Improved automated spinal cord segmentation and automated injury segmentation have the potential to enhance the automated workflow for atlas-based image analysis in traumatic SCI. Future studies will aim to validate current results in larger and more varied patient cohorts, utilize a more efficient loss metric for lesion segmentation, expand the current architecture to 3D CNN networks, and potentially integrate into open-source spinal cord image analysis tools such as the SCT.Acknowledgements
No acknowledgement found.References
1. De Leener B, Taso M, Cohen-Adad J, Callot V. Segmentation of the human spinal cord. Magma 2016;29:125-53.
2. Haefeli J, Mabray MC, Whetstone WD, et al. Multivariate Analysis of MRI Biomarkers for Predicting Neurologic Impairment in Cervical Spinal Cord Injury. AJNR American journal of neuroradiology 2017;38:648-55.
3. Ronneberger, O., Fischer, P. & Brox, T. U-Net: Convolutional Networks for Biomedical Image Segmentation in Medical Image Computing and Computer-Assisted Intervention – MICCAI 2015 (eds. Navab, N., Hornegger, J., Wells, W. M. & Frangi, A. F.) 234–241 (Springer International Publishing, 2015).
4. Dice LR. Measures of the Amount of Ecologic Association Between Species. Ecology 1945;26:297-302.
5. De Leener B, Kadoury S, Cohen-Adad J. Robust, accurate and fast automatic segmentation of the spinal cord. NeuroImage 2014;98:528-36.
6. De Leener B, Levy S, Dupont SM, et al. SCT: Spinal Cord Toolbox, an open-source software for processing spinal cord MRI data. NeuroImage 2017;145:24-43.
Figures