0698
Brain Tissue Segmentation and Subcortical Parcellation: How Reliable Are Different Tools?1Physikalisch-Technische Bundesanstalt (PTB), Berlin, Germany, 2MRI.Tools GmbH, Berlin, Germany, 3Department of Neurology, Charité - Universitätsmedizin Berlin, Berlin, Germany, 4Department of Neurology, University Medicine Greifswald, Greifswald, Germany
Synopsis
Volume based morphometry is a well-established tool to investigate changes of brain structures in neurodegenerative diseases, and a variety of implementations is available. With MRI investigations as an indispensable instrument for diagnosis and disease progress monitoring, the question about reliability and robustness of these tools arises. This work examines the accuracy of CAT 12 and FreeSurfer by comparing a selection of their calculated subcortical volumes to a ground truth.
Introduction
Neurodegenerative diseases often manifest in changes of brain structures. Alzheimer’s disease (AD), for example, is associated with gray matter atrophy1,2. Therefore, quantifying gray matter loss becomes an increasingly important tool in research and diagnosis of AD. Voxel based morphometry3 (VBM) is an established method to assess volumes of cortical and subcortical structures, and there are a number of different implementations of VBM, CAT124 and FreeSurfer5 being two widely used ones. Although previous studies reported correlations between both tools in large cohorts6, it was observed that individual volumes calculated by both tools differed dramatically7. Hence, the question arose, which of these tools’ results are more reliable? As MRI-based morphometry is more and more utilized for clinical diagnosis and progress monitoring of diseases, the question of comparability of different data sets with different signal-to-noise ratios (SNR), different resolutions, and data acquired at different field strengths becomes increasingly relevant.
This work aims to answer the question of reliability and robustness of volumetric measurements, by comparing the results from FreeSurfer and CAT12 to a ground truth from simulated data sets, where volumes of different subcortical structures are exactly known.
Methods
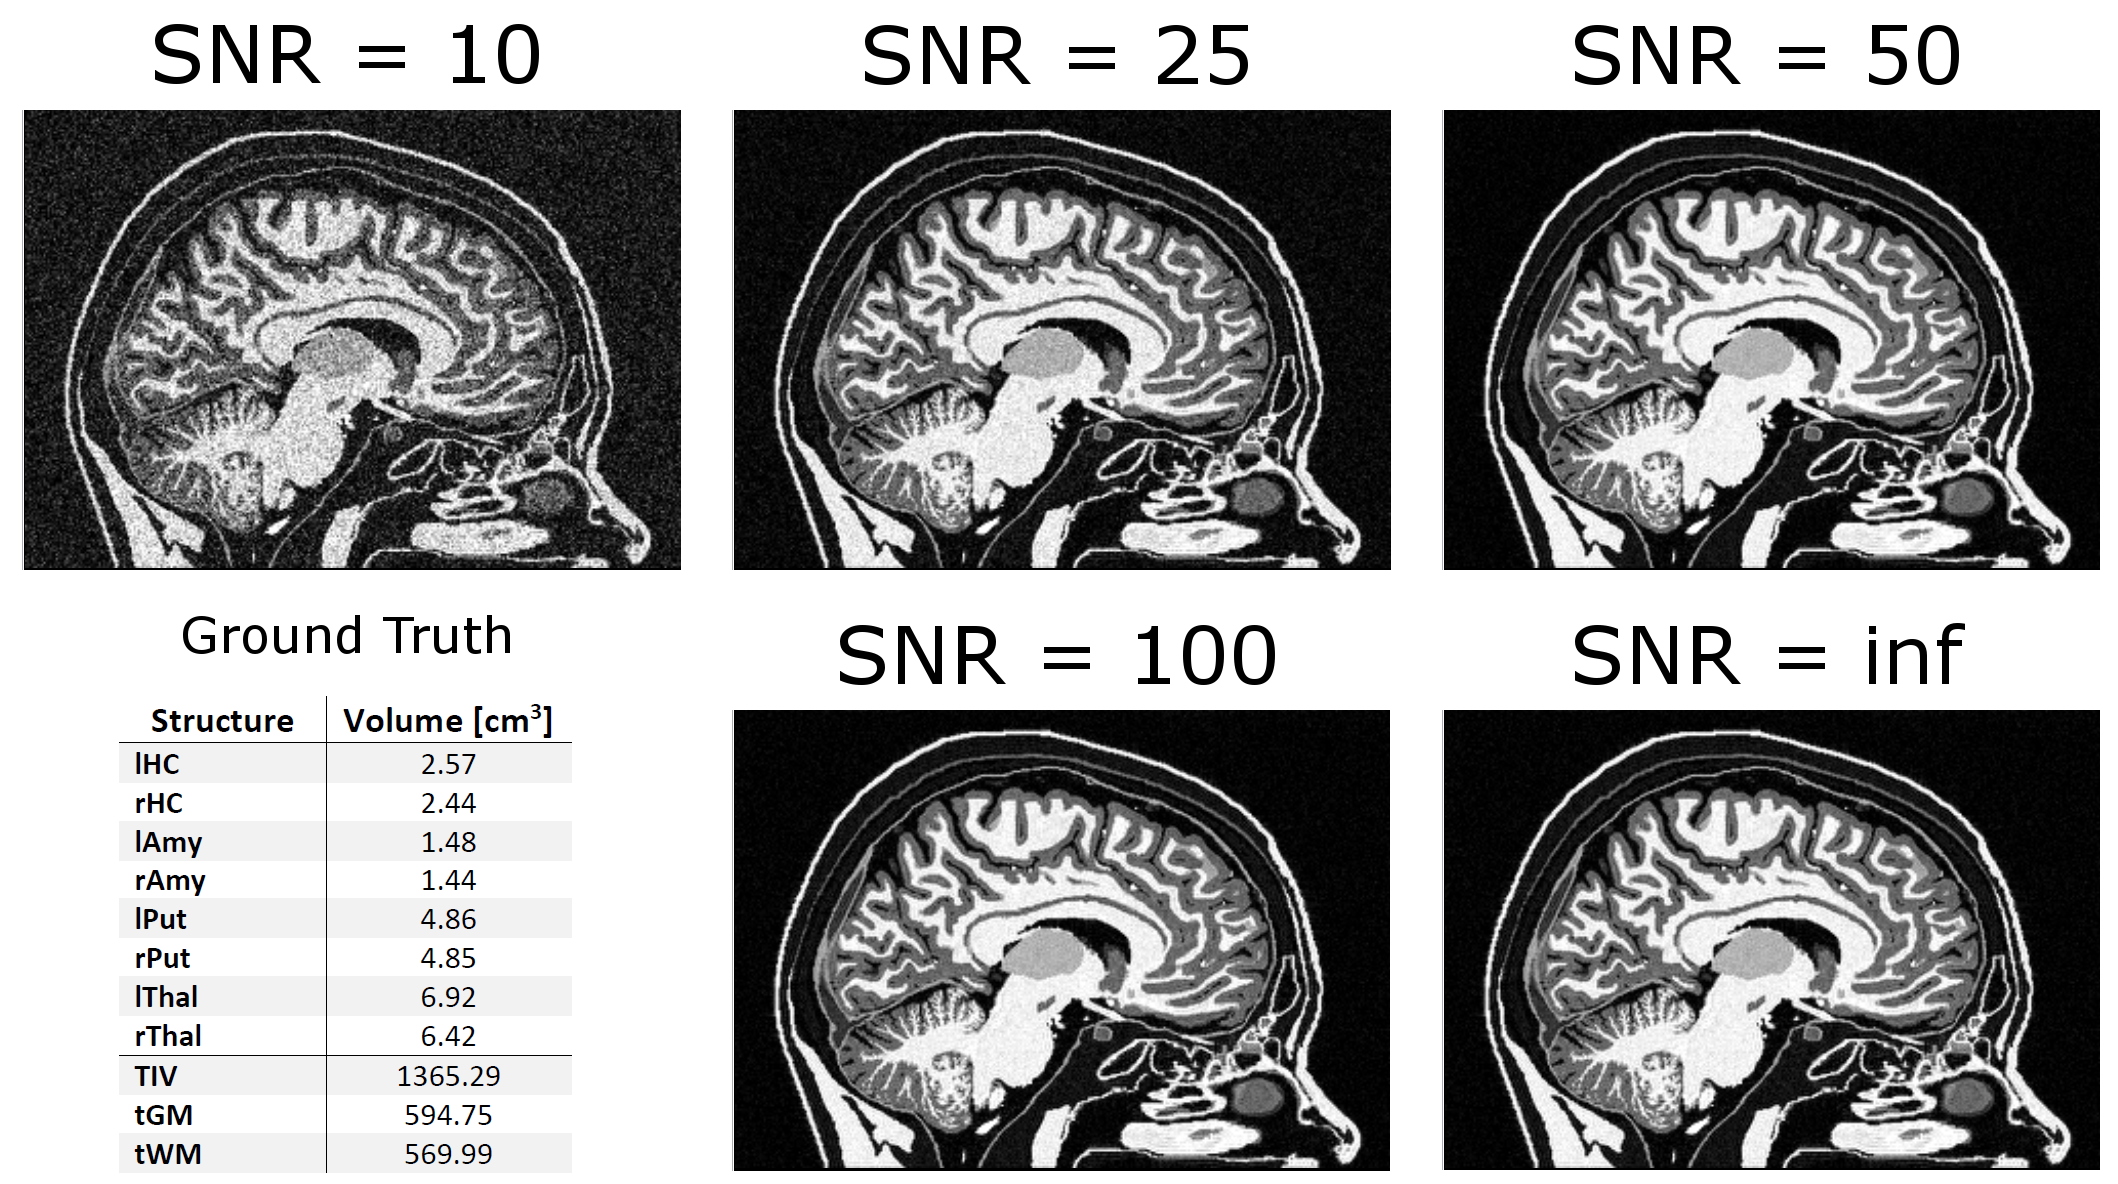
Simulated MRI datasets were constructed from the high-resolution MIDA voxel model8 using MATLAB. Ground truth tissue volumes were computed by summing the appropriate voxels. Each of the 153 structures was assigned an empirical signal intensity value based on average observed MP2RAGE9 image intensities from 7T scans. Downsampling to the desired image resolution of 0.75 mm³ was achieved by a Fourier transform of the model followed by appropriate k-space truncation and inverse FFT, which mimics the slight ringing artifacts typically encountered in MRI at high contrast interfaces. Following this, noise at different intensities was added. To judge the impact of artificially increased resolution, datasets were duplicated and rescaled to 0.5 mm³ voxels by k-space zero padding. Finally, left-right flipped versions of all datasets were generated. The resulting 20 datasets were analyzed in CAT12 using the Hammers10 atlas and FreeSurfer using the Desikan-Killiany11 atlas for cortical parcellation and the Fischl12 atlas for subcortical segmentation without further operator interaction.Results and Discussion
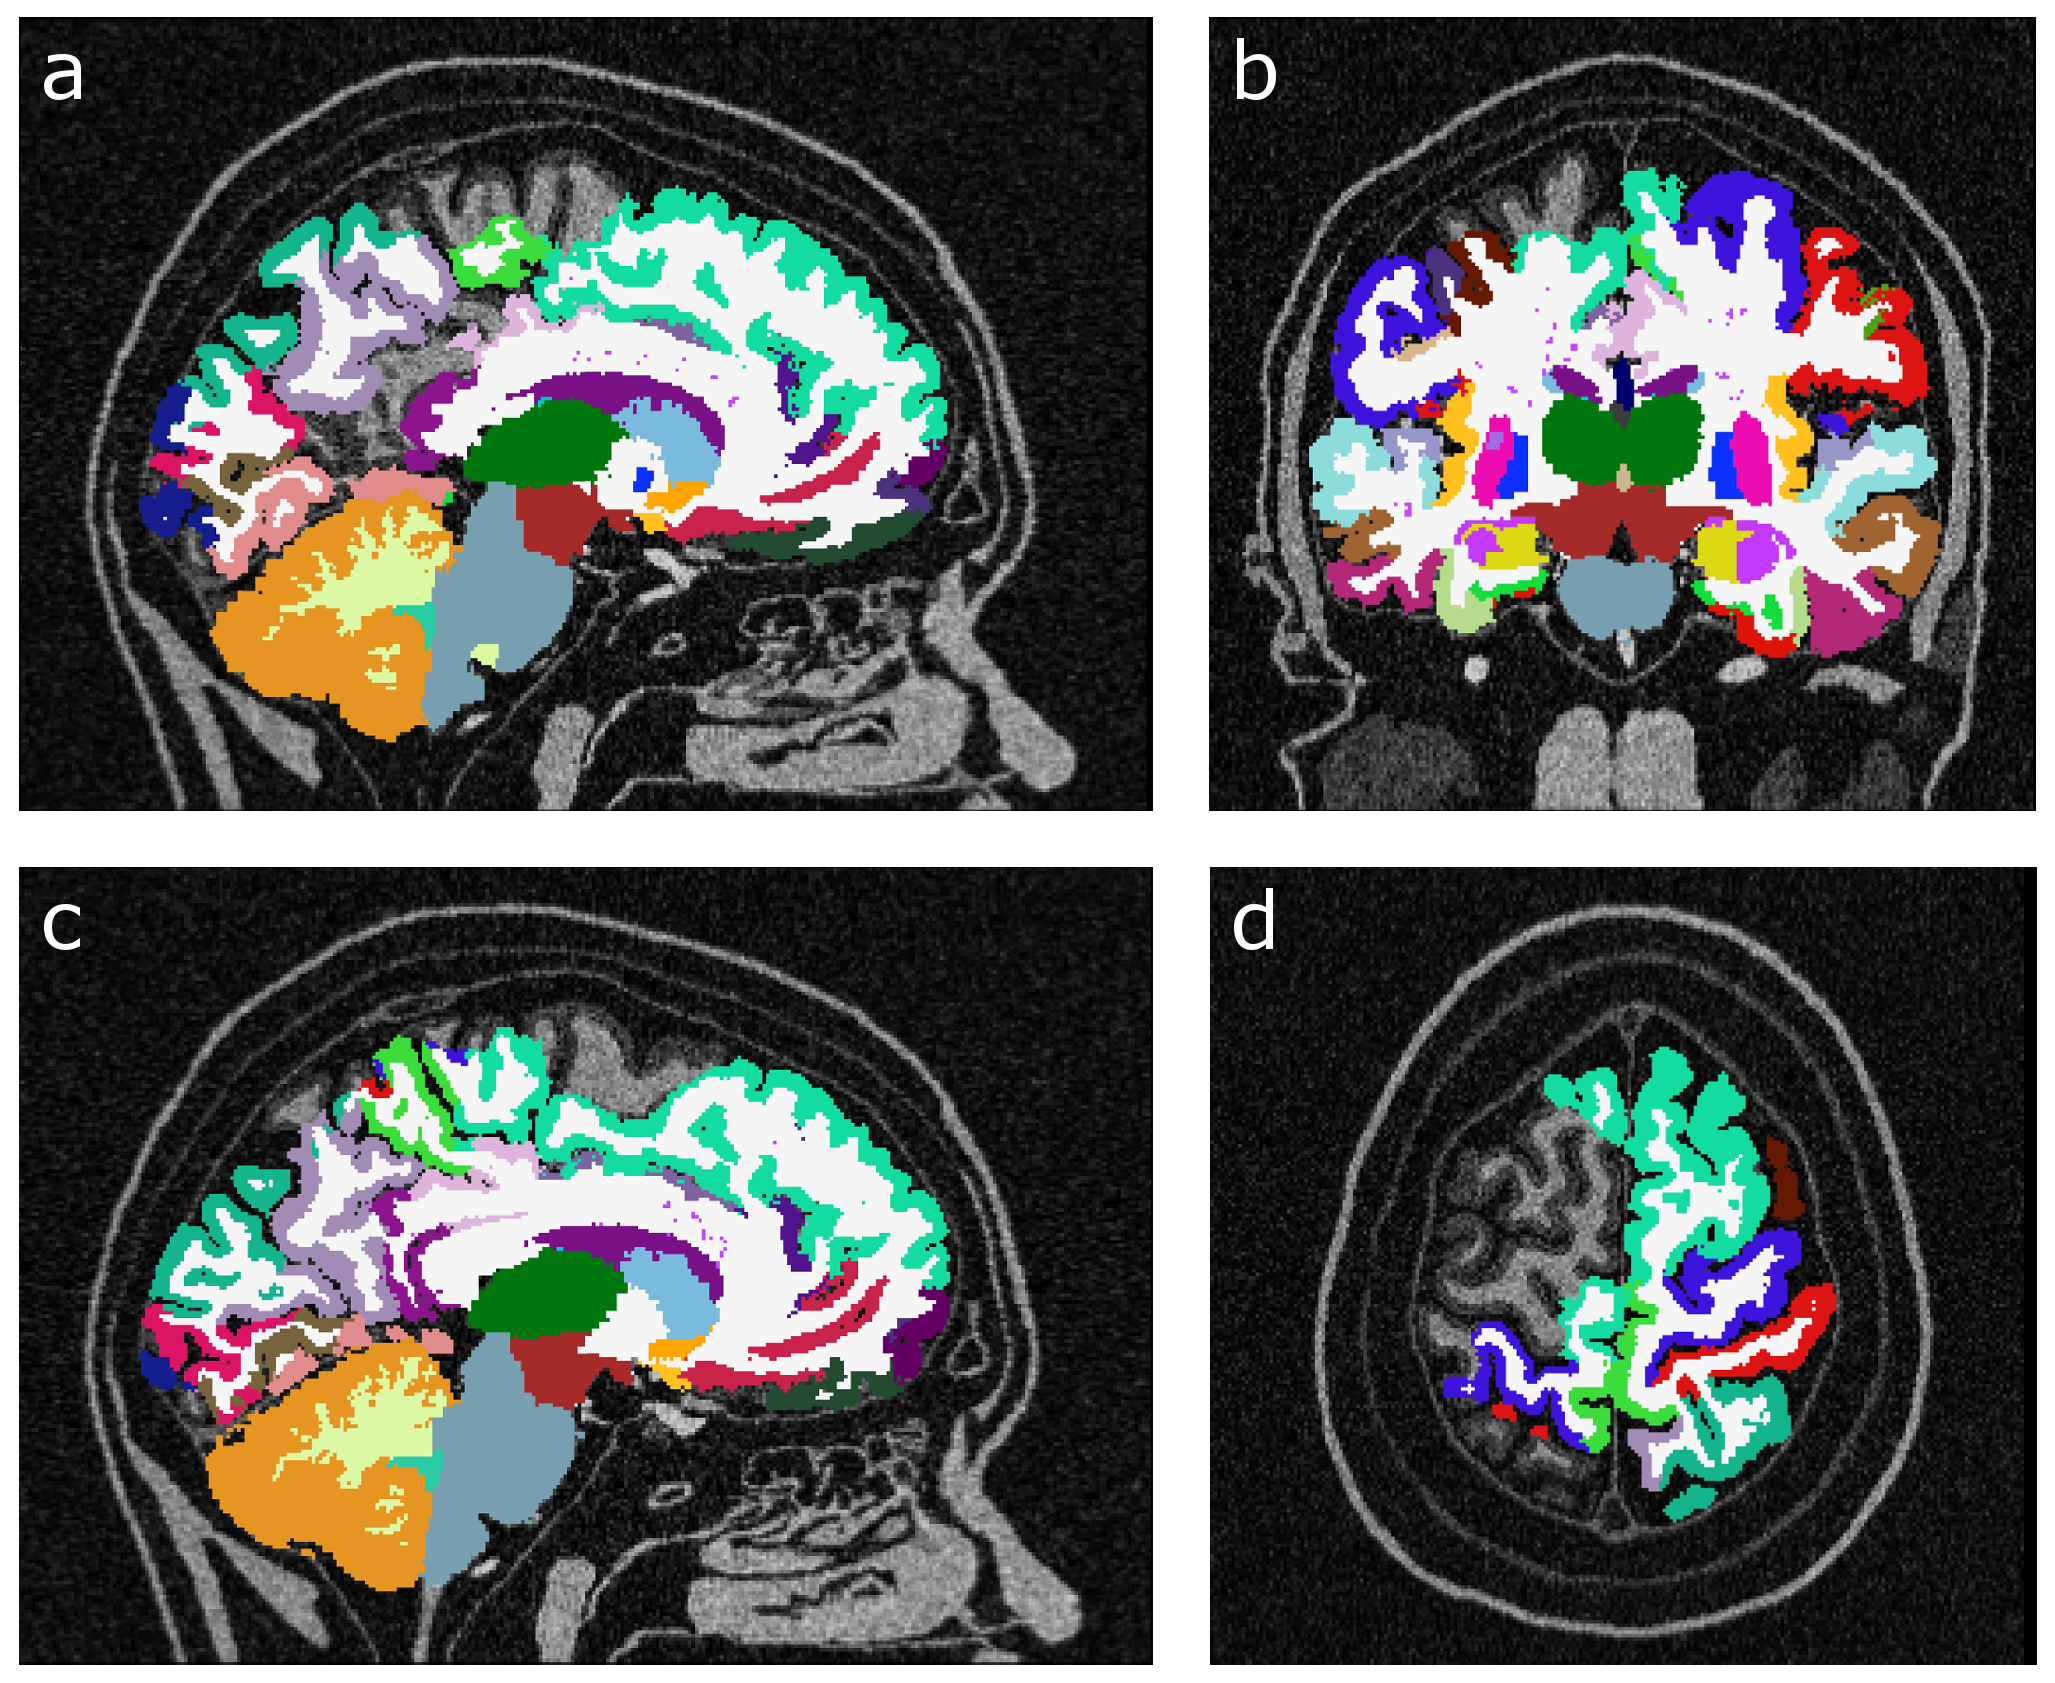
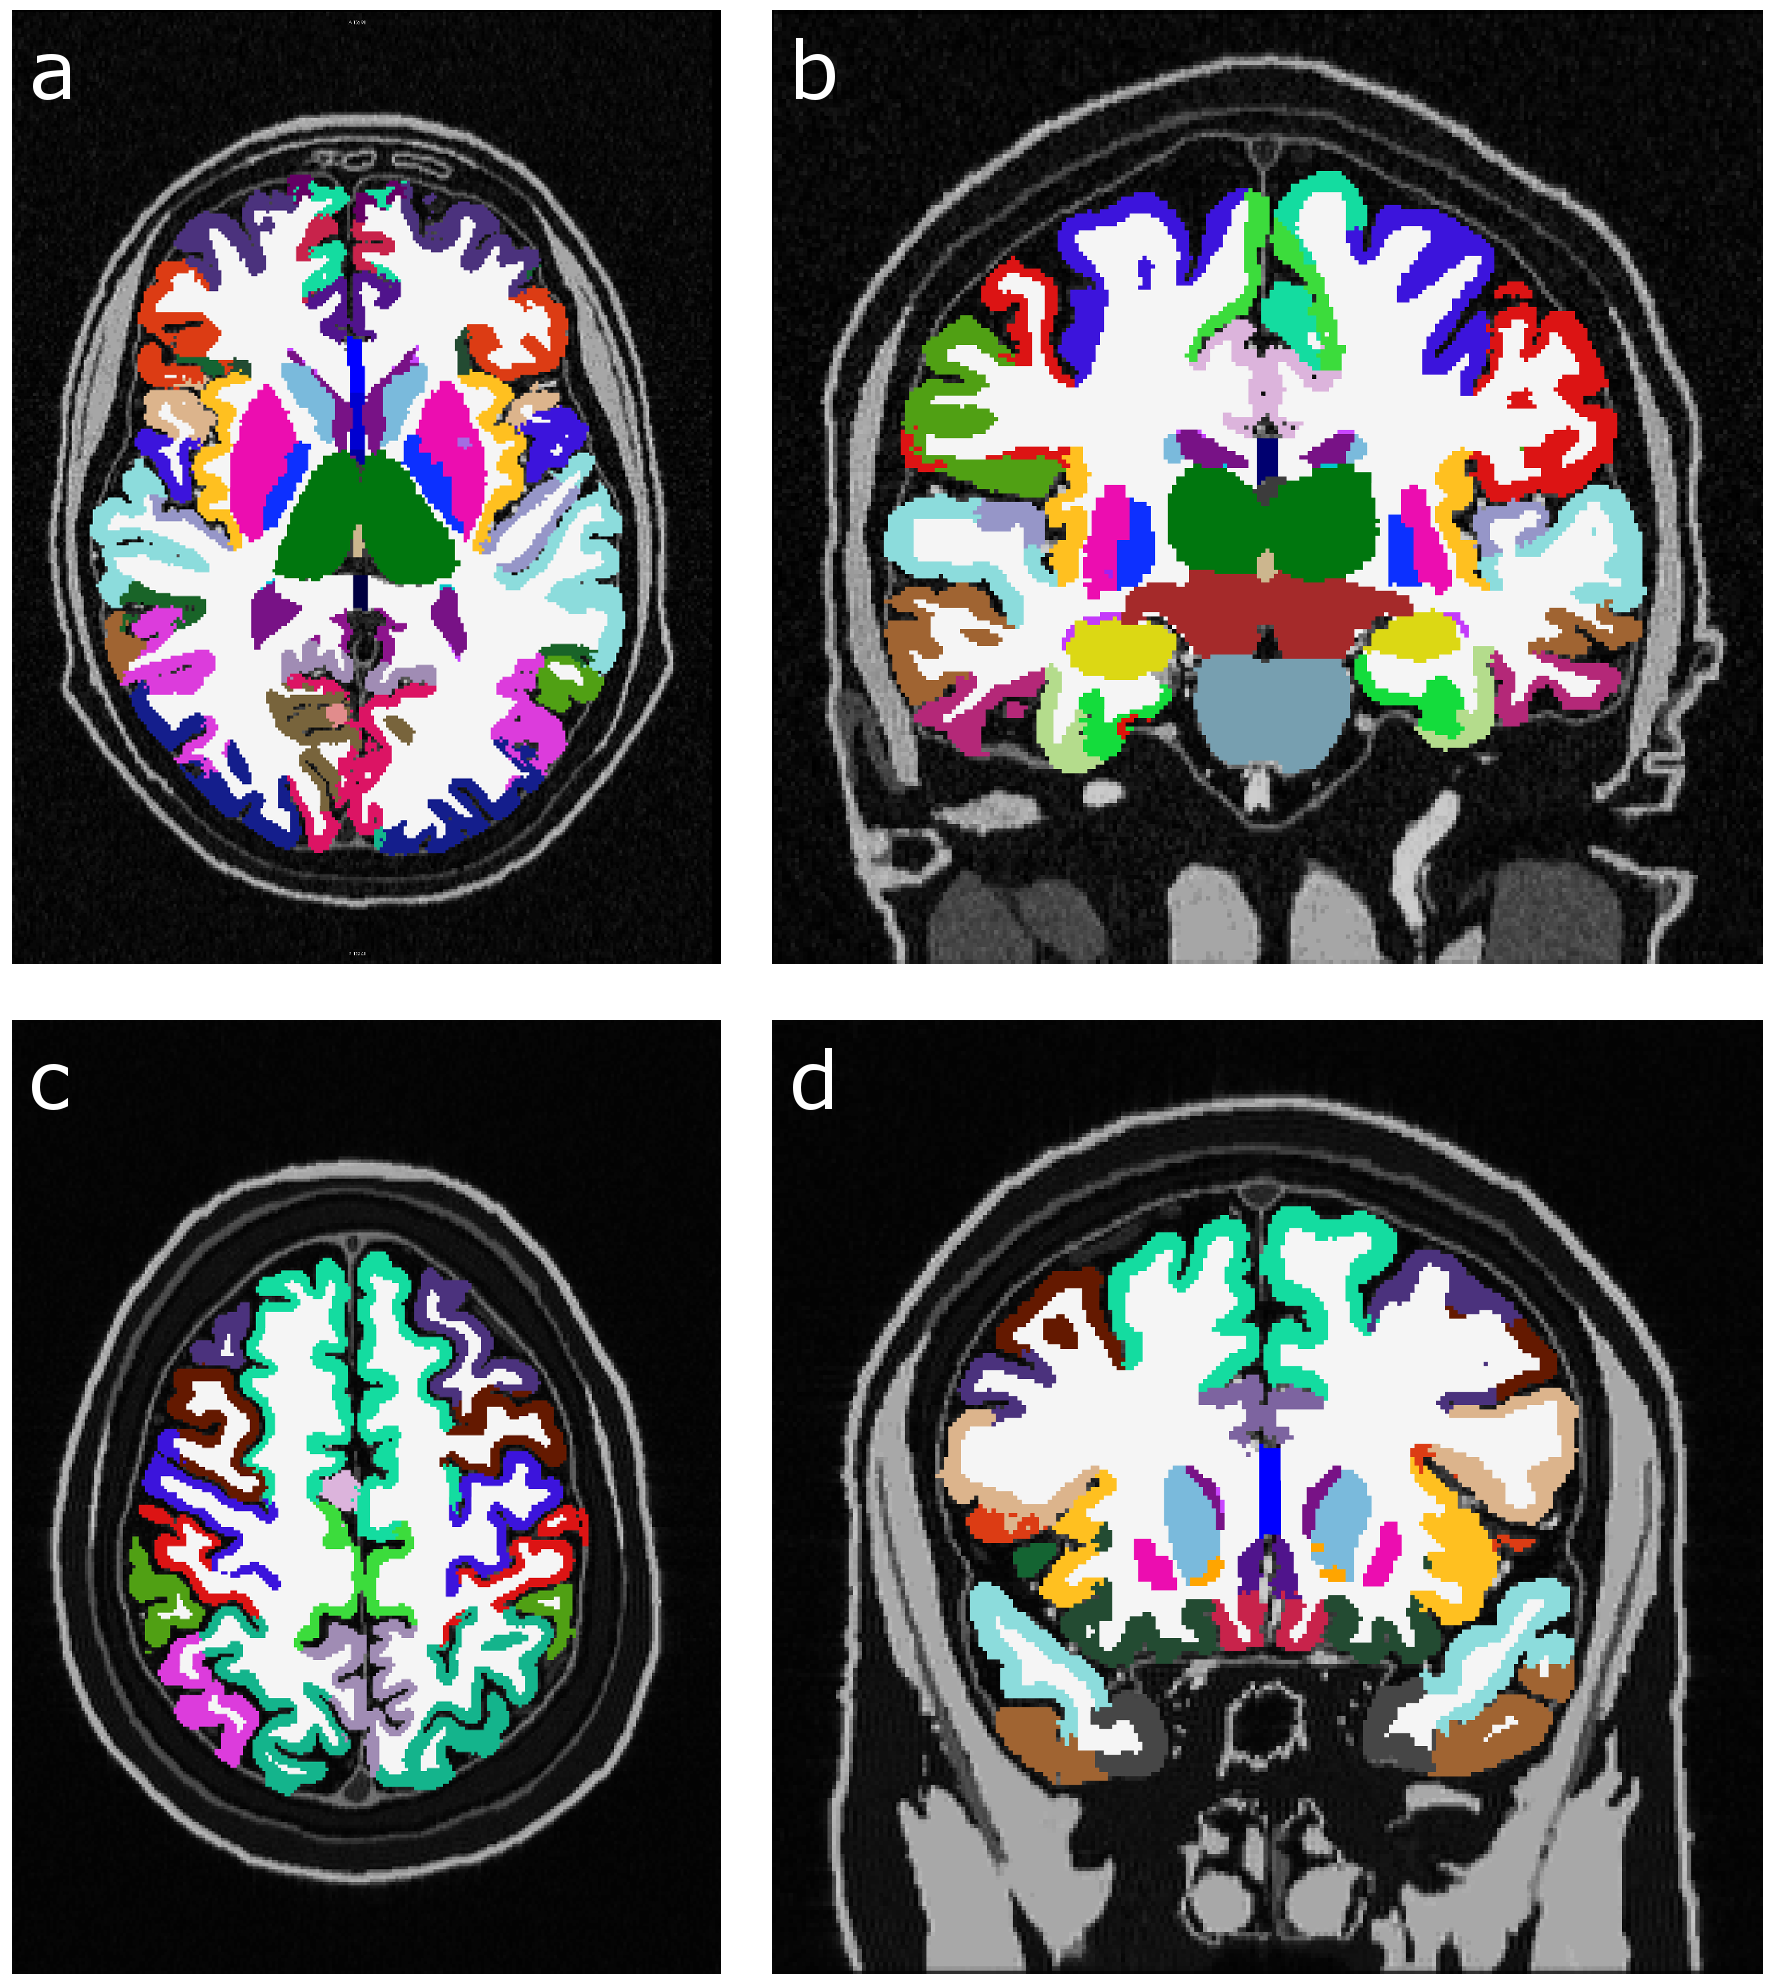
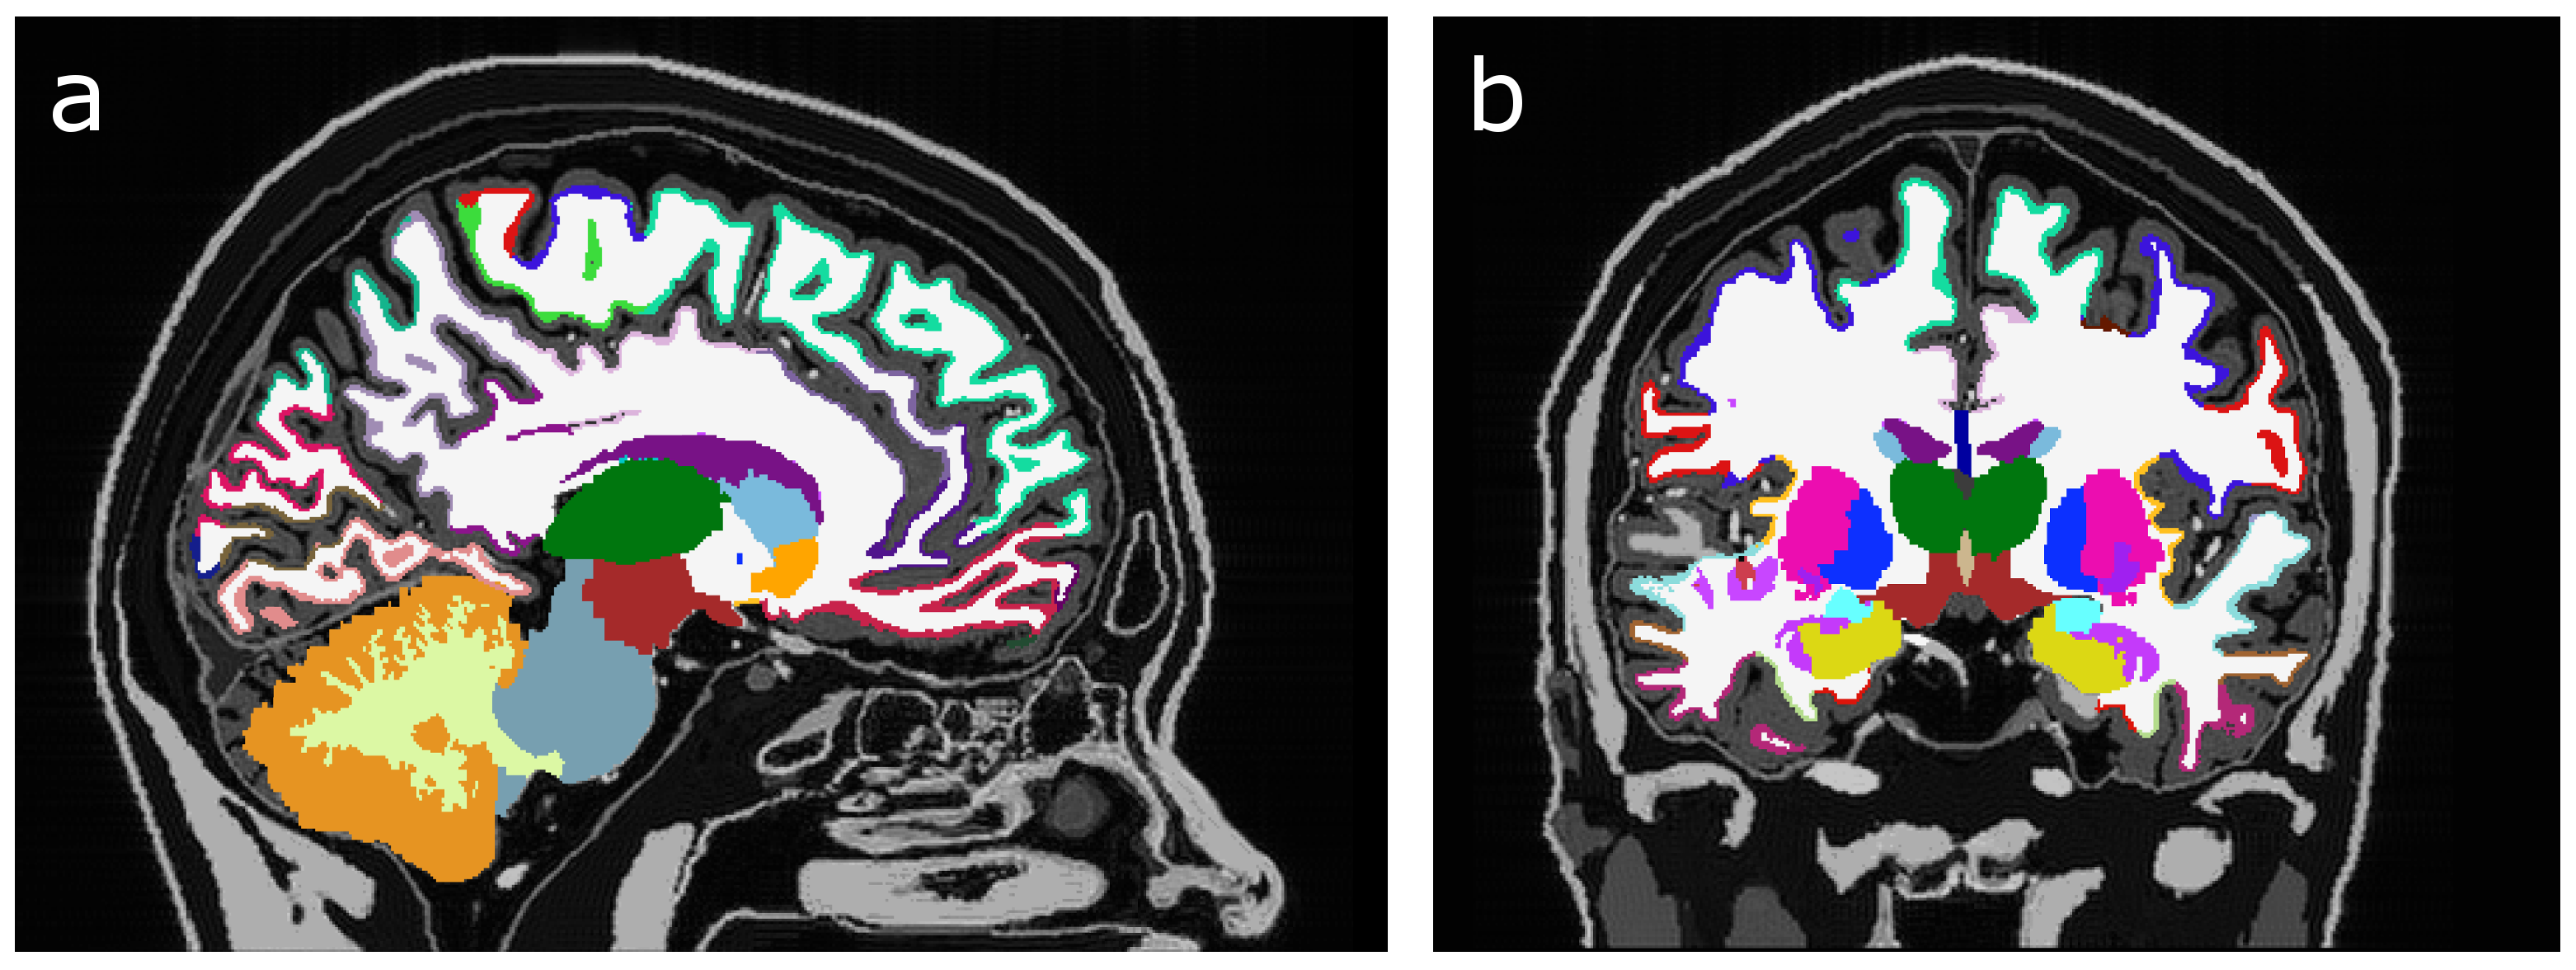
Fig. 1 displays the same slice of the simulated data sets at different SNRs. The ground truth for the subset of subcortical structures discussed in this abstract is given in the small table in Fig. 1. In Fig. 2 FreeSurfer results are displayed for data sets with low SNR (SNR = 10). It can be seen that skull stripping did not work properly, and large parts of the cortex were not segmented. At higher SNRs, the skull stripping and segmentation appear improved (Fig. 3). In all zero padded data sets, however, FreeSurfer estimated the cortex visibly too thin (Fig. 4). Attempts to processing the zero padded data set with low SNR were unsuccessful in FreeSurfer; the program aborted with an error. Unfortunately, CAT12 does not produce visualized image overlays of the segmentation and the brain image, which makes a visual assessment of the quality of the results impossible.
Fig. 5 displays the difference of the structural volumes calculated by CAT12 (left panel) and FreeSurfer (right panel) from the ground truth in percent. It can be seen that CAT12 results are not only closer to the ground truth, but are also more robust against effects due to zero padding and different levels of SNR. Strangely, while the volumes calculated by FreeSurfer especially for the small subcortical volumes are close to the ground truth, the results seem to worsen with higher SNR. Furthermore, zero padding seems to improve the performance of FreeSurfer on the calculation of subcortical volumes, but at the same time the estimation of cortical structures deteriorates.
Conclusion
The results presented here indicate, that volumes calculated in CAT12 are both more robust and closer to the ground truth, over different levels of SNR and zero padding than volumes derived from FreeSurfer. Nevertheless, these results will need to be corroborated in future work.Acknowledgements
This project has received funding from the EMPIR programme co-financed by the Participating States and from the European Union’s Horizon 2020 research and innovation programme. This paper reflects only the author's view and EURAMET is not responsible for any use that may be made of the information it contains.References
[1] G. B. Karas, P. Scheltens, S. A. R. B. Rombouts, P. J. Visser, R. A. van Schijndel, N. C. Fox, F. Barkhof. „Global and local gray matter loss in mild cognitive impairment and Alzheimer’s disease“. NeuroImage 23:708-716 (2004)
[2] S. L. Risacher, W. H. Anderson, A. Charil, P. F. Castelluccio, S. Shcherbinin, A. J. Saykin, A. J. Schwarz. „Alzheimer disease brain atrophy subtypes are associated with cognition and rate of decline“. Neurology (2017) DOI: 10.1212/WNL.0000000000004670, epub ahead of print
[3] J. Ashburner, K. J. Friston. “Voxel-Based Morphometry – The Methods”. NeuroImage 11:805-821 (2000)
[4] C. Gaser, R. Dahnke. “CAT – A Computational Anatomy Toolbox for the Analysis of Structural MRI Data.” HBM 2016:33-348 (2016)
[5] B. Fischl. “FreeSurfer”. NeuroImage 62:774-781 (2012)
[6] R. Righart, P. Schmidt, R. Dahnke, V. Biberacher, A. Beer, D. Buck, B. Hemmer, J. S. Kirschke, C. Zimmer, C. Glaser, M. Mühlau. „Volume versus surface-based cortical thickness measurements: A comparative study with healthy controls and multiple sclerosis patients“. PLoS ONE 12:e0179590 (2017)
[7] R. Seiger, A. Hahn, S. Ganger, S. Kasper, R. Lanzenberger. „Evaluating cortical thickness estimations of FreeSurfer and the CAT12 toolbox for SPM”. Proceedings of HBM, Vancouver, Canada (2017)
[8] M. I. Iacono, E. Neufeld, E. Akinnagbe, K. Bower, J. Wolf, I. Vogiatzis Oikonomidis, D. Sharma, B. Lloyd, B. J. Wilm, M. Wyss, K. P. Pruessmann, A. Jakab, N. Makris, E. D. Cohen, N. Kuster, W. Kainz, L. M. Angelone. “MIDA: A Multimodal Imaging-Based Detailed Anatomical Model of the Human Head and Neck”. PLoS ONE 10:e0124126 (2015)
[9] J. P. Marques, T. Kober, G. Krueger, W. van der Zwaag, P.-F. Van de Mortele, R. Gruetter. „MP2RAGE, a self bias-field corrected sequence for improved segmentation and T1-mapping at high field“. NeuroImage 49:1271-1281 (2010)
[10] A. Hammers, R. Allom, M. J. Koepp, S. L. Free, R. Myers, L. Lemieux, T. N. Mitchell, D. J. Brooks, J. S. Duncan. “Three-Dimensional Maximum Probability Atlas of the Human Brain, With Particular Reference to the Temporal Lobe”. Hum Brain Mapp 19:224-247 (2003)
[11] R. S. Desikan, F. Ségonne, B. Fischl, B. T. Quinn, B. C. Dickerson, D. Blacker, R. L. Buckner, A. M. Dale, R. P. Maguire, B. T. Hyman, M. S. Albert, R. J. Killiany. „An automated labeling system for subdividing the human cerebral cortex on MRI scans into gyral based regions of interest”. NeuroImage 31:968-980 (2006)
[12] B. Fischl, D. H. Salat, E. Busa, M. Albert, M. Dieterich, C. Haselgrove, A. van der Kouwe, R. Killiany, D. Kennedy, S. Klaveness, A. Montillo, N. Makris, B. Rosen, A. M. Dale. “Whole Brain Segmentation: Neurotechnique Automated Labeling of Neuroanatomical Structures in the Human Brain”. Neuron 33: 341-355 (2002)
Figures