0697
Automated segmentation of calibration regions for pediatric whole brain T1- and T2-weighted ratio myelin mapping1Developmental Imaging, Murdoch Children's Research Institute, Melbourne, Australia, 2Neuroscience Research, Murdoch Children's Research Institute, Melbourne, Australia, 3Neurosurgery, The Royal Children's Hospital, Melbourne, Australia, 4Medical Imaging, The Royal Children's Hospital, Melbourne, Australia, 5Paediatrics, University of Melbourne, Melbourne, Australia, 6Radiology, University of Melbourne, Melbourne, Australia, 7Epilepsy, Florey Institute of Neuroscience and Mental Health, Melbourne, Australia, 8Neurology, The Royal Children's Hospital, Melbourne, Australia, 9Victorian Infant Brain Study (VIBeS), Murdoch Children's Research Institute, Melbourne, Australia, 10Florey Institute of Neuroscience and Mental Health, Melbourne, Australia, 11School of Psychological Sciences, Monash University/Monash Institute of Cognitive and Clinical Neurosciences, Melbourne, Australia, 12Medicine, Monash University, Melbourne, Australia
Synopsis
Delineation of calibration regions is a key component of the T1w/T2w ratio myelin mapping approach. The existing method implemented in SPM was not designed for pediatric MRI application. We have developed an automated approach that is able to reliably segment appropriate calibration regions in the pediatric populations- the CSF and scalp fat layer. Using two pediatric MRI datasets, we demonstrated reliability of our segmentation method and the low variance of regional T1w/T2w ratios than the existing method. Our proposed calibration method has potential to be implemented in pediatric myelination studies using the whole brain T1w/T2w ratio technique.
Introduction
Myelin imaging can be used to track typical brain development, and to further understand the pathophysiological basis of white matter disorders in humans. The whole brain T1- and T2-weighted (T1w/T2w) ratio is a technique that enables in vivo myelin mapping.1, 2 The existing method, implemented in SPM (MRTool), was developed using healthy adult MRI1 and applied in brain studies of adult disorders.3, 4 A key step in the MRTool procedure is calibration of the T1w and T2w images against intensities of reference regions outside the brain, thus normalizing ratio image intensity to allow for across subject/scanner comparisons.1 However, MRTool was not designed for pediatric MRI, in part due to the need for template space registration during the calibration step. We developed an automated whole brain T1w/T2w ratio myelin mapping technique, using alternative segmentation of calibration regions, which is feasible for pediatric application. The two calibration regions segmented as part of this method are the cerebrospinal fluid (CSF) and the scalp fat layer. This study aimed to demonstrate the reliability of our calibration technique for T1w/T2w ratio mapping by comparing it with MRTool, using two pediatric MRI datasets obtained from the Victorian Infant Brain Studies (VIBeS) at 7 and 13 years of age.Aims
Compare our method to the SPM-MRTool based on the following criteria:
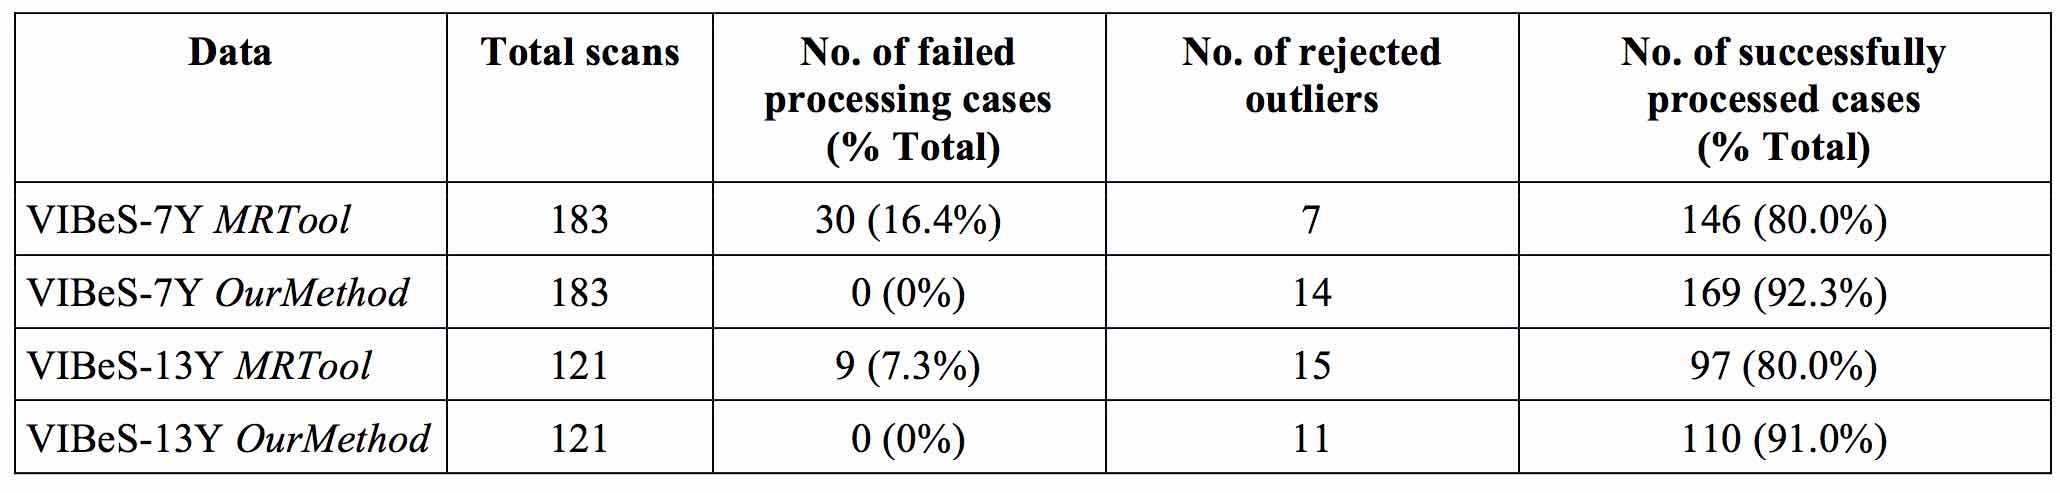
- Rate of successful completion of image processing.
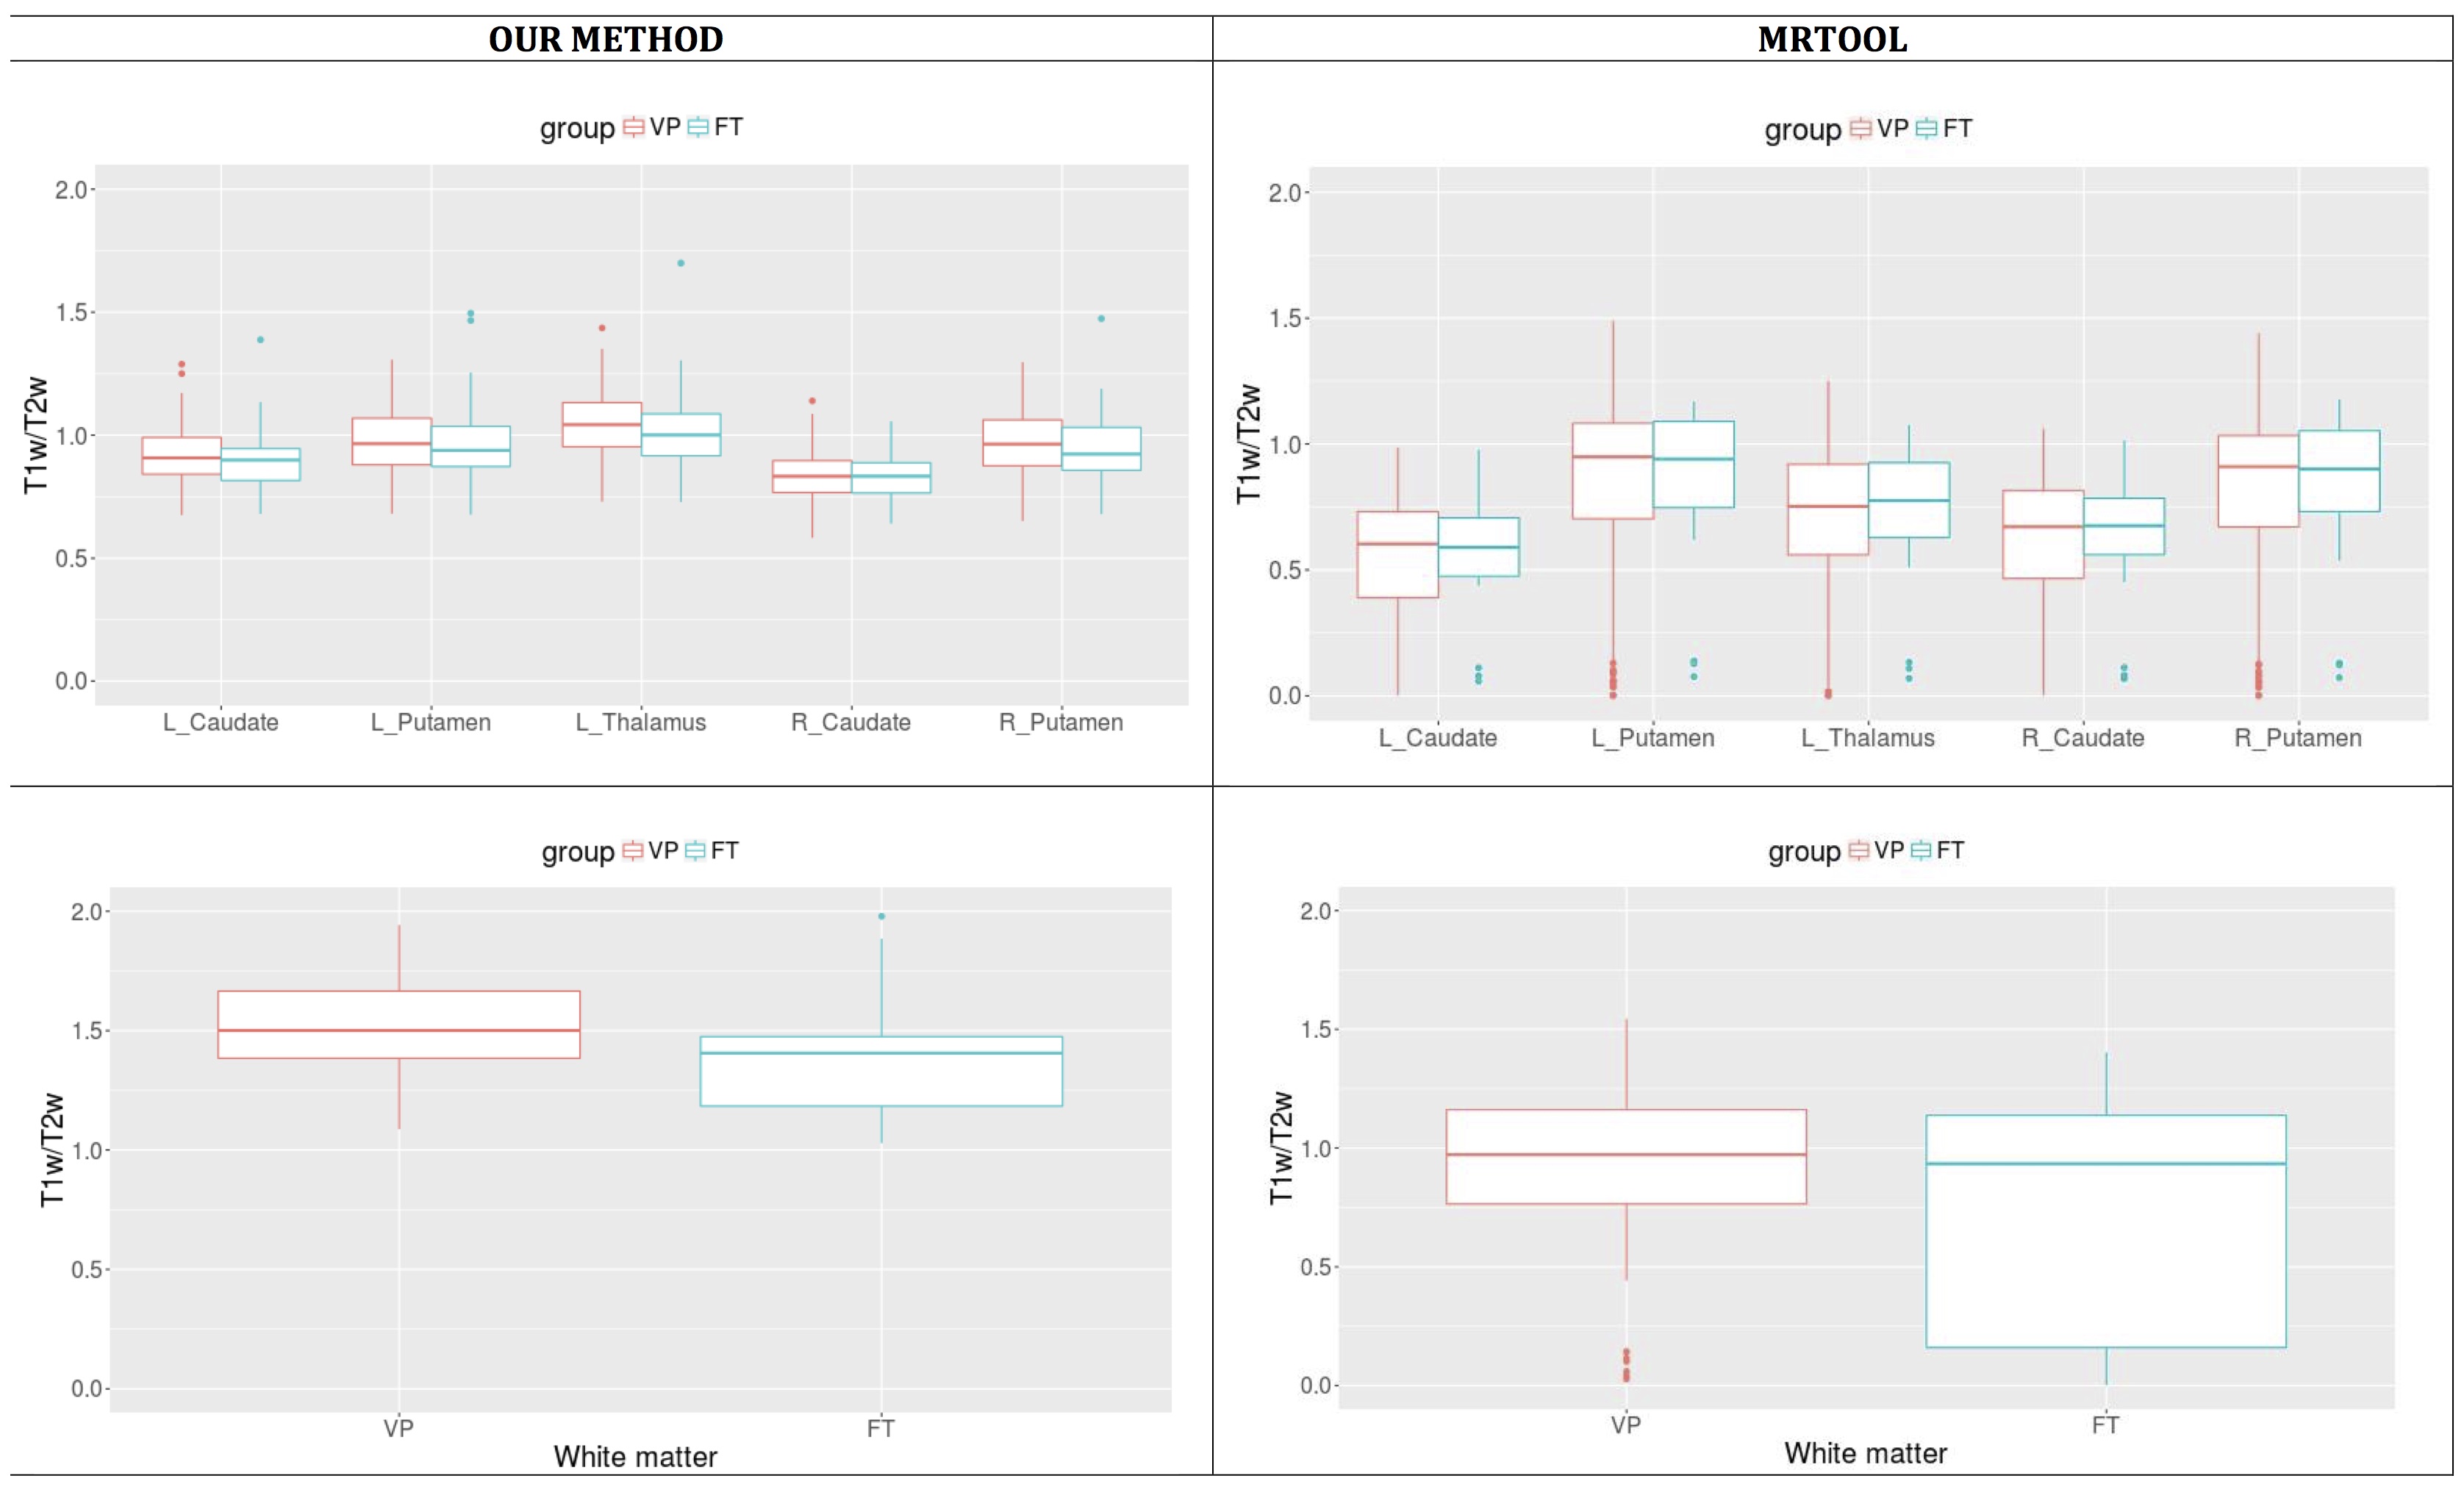
- Compatibility of T1w/T2w ratio group difference results (i.e. Very preterm (VP) versus full term (FT)).
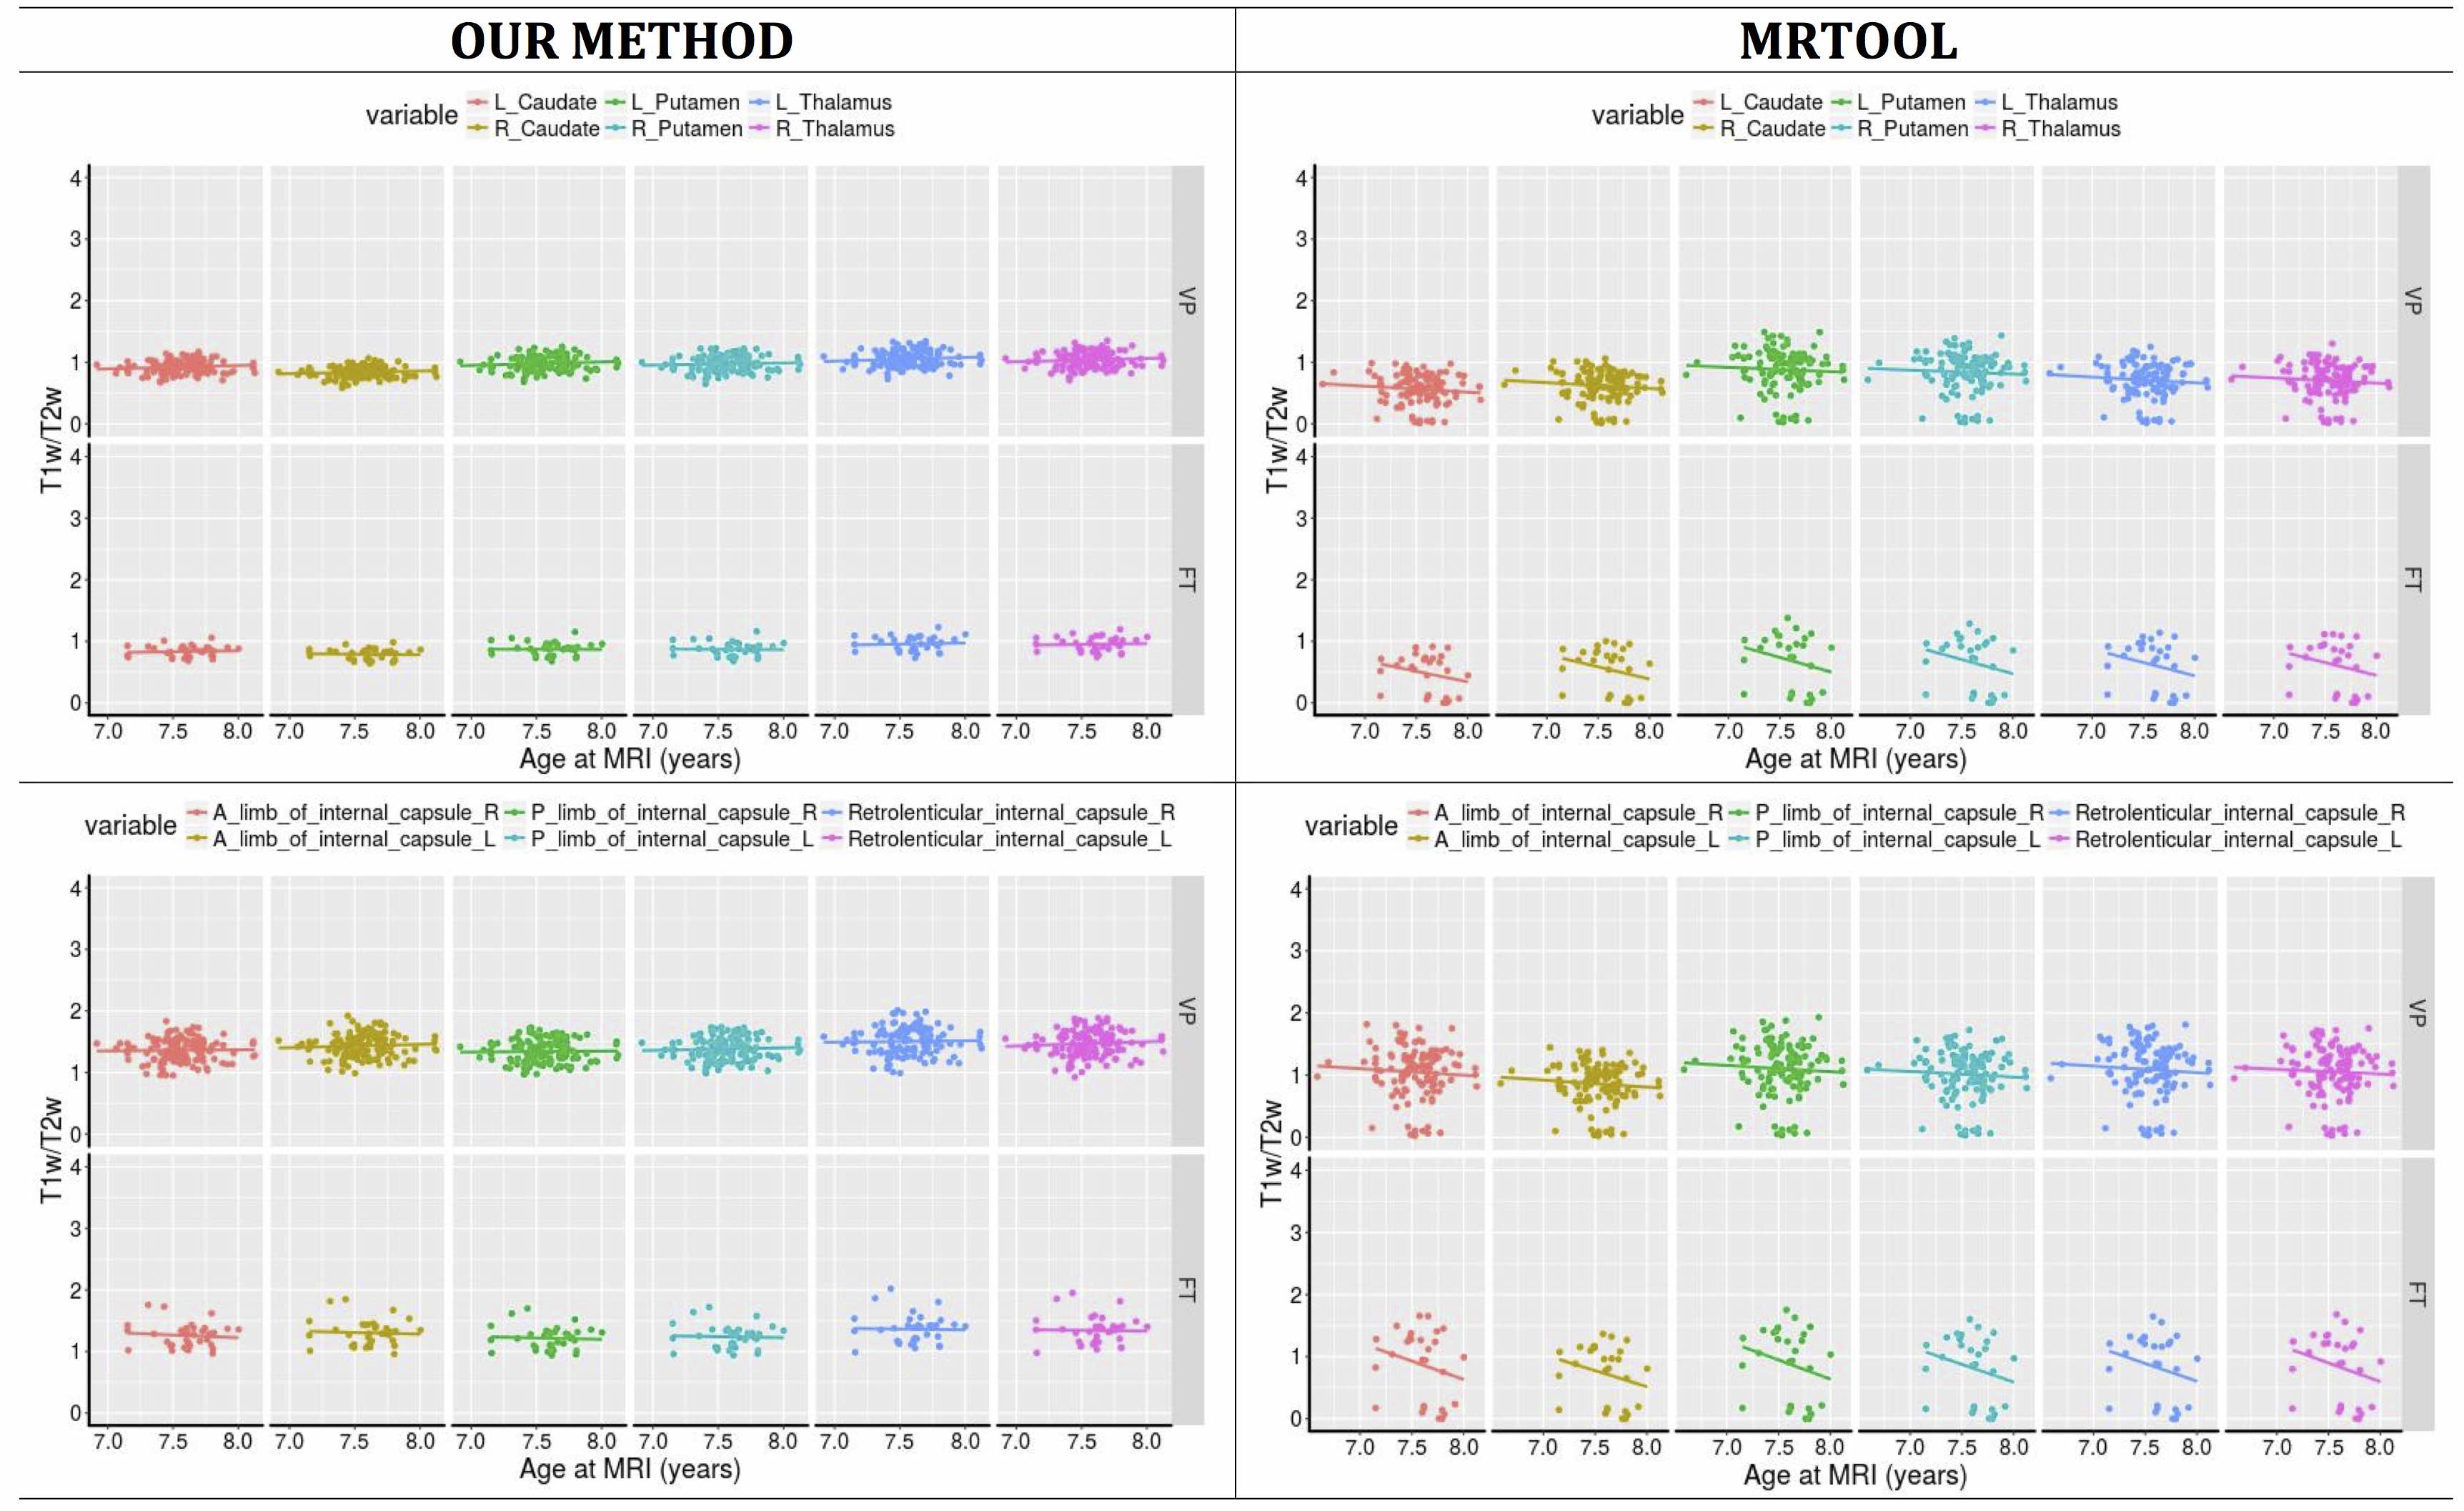
- Variances of individual T1w/T2w ratios.
In addition we investigated the distribution of mean T1w and T2w intensities in calibration regions used in our method.
Methods
Participants: One hundred and forty-eight children born VP (<30 weeks’ gestation) or very low birth weight (<1250 g) and 35 children born FT (37-42 weeks’ gestation) were scanned at 7 years corrected age (VIBeS-7Y). Of these, 86 VP and 35 FT children were followed up at 13 years corrected age (VIBeS-13Y).
MRI acquisition: All acquired using 3T MRI. VIBeS-7Y: T1-MPRAGE (0.85 mm sagittal slices; TR/TE = 1900/2.27 ms); T2 (0.9 mm sagittal slices, TR/TE = 3200/447 ms). VIBeS-13Y: T1-multiecho MPRAGE with prospective motion compensations (0.9mm3 isotropic, TR/TE = 2530/1.77, 3.51, 5.32, 7.2 ms); T2 (0.9 mm sagittal slices, TR/TE = 3200/447 ms).
Processing: The T1w and T2w images were bias-corrected and the T2w image was coregistered and resampled to the T1w image space. Both images were intensity normalized against standard values and calibrated using two reference structures with relatively homogeneous, but reversed intensity values in the subject’s space: the scalp fat layer (scalp-fat) and the CSF mask. The scalp-fat mask was segmented using the in house ITK tool based on the morphological watershed transform from markers.5, 6 The CSF mask was obtained from SPM tissue segmentation. The T1w/T2w ratio was then calculated and mapped in the subject’s space.
The mean ratio intensity value was derived from the SPM segmented white matter mask. The ratio maps were non-linearly warped into the standard template space. The mean ratio intensity values were derived from 48 white matter regions based on the JHU white matter atlas, and six subcortical gray matter regions based on the Harvard-Oxford atlas.
Results
The rates of successful completion of image processing were higher with our method than with the MRTool method (Figure 1). The patterns of VP and FT group differences demonstrated by both methods showed similar trends, with more variances noted using the MRTool method (Figure 2). Our method demonstrated less individual variances of T1w/T2w ratio than the MRTool method (Figure 3).
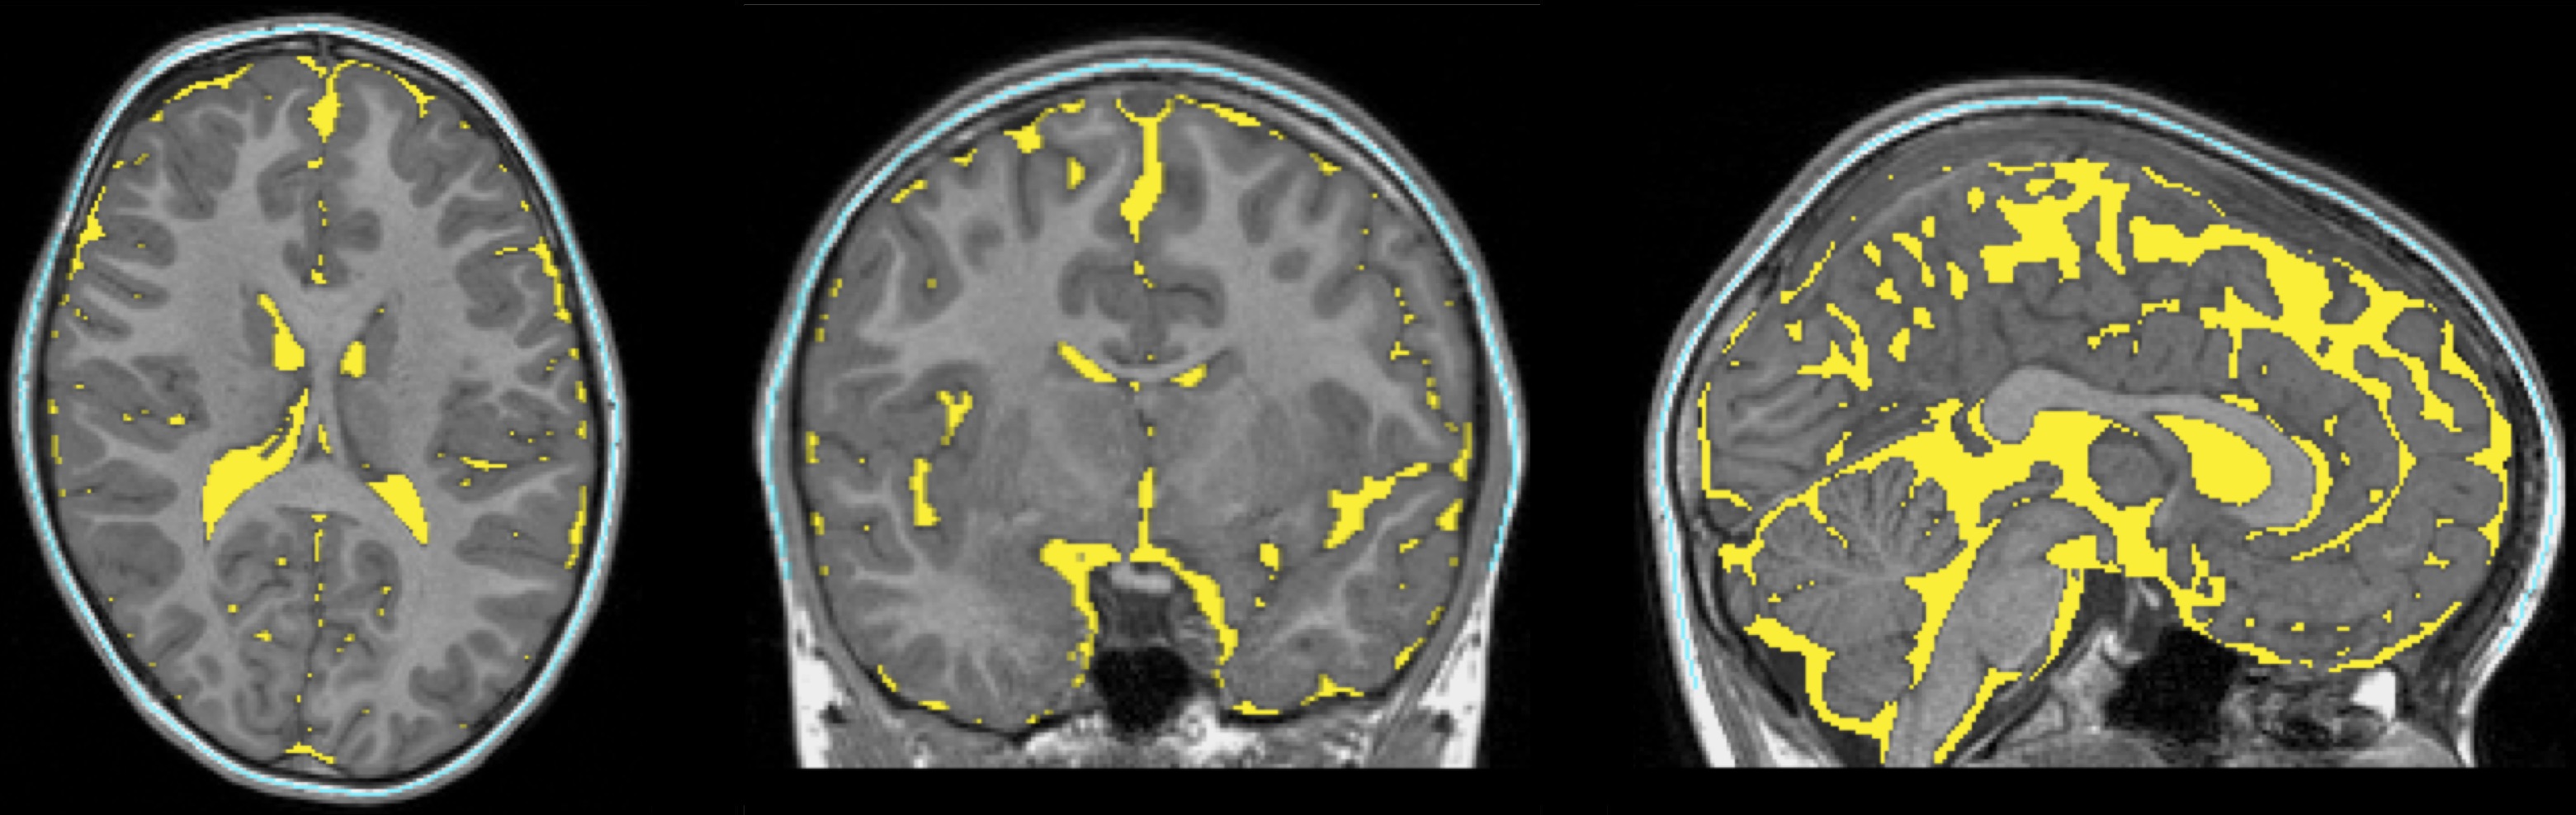
The segmented tissue mask accuracy from our method was visually satisfactory. An example is shown in Figure 4. The T1w and T2w intensity profiles of both tissue masks generated by our method had compatible patterns in both MRI datasets. Greater intensity variance was observed for the scalp-fat mask in the T1w space, than the others (Figure 5).
Discussion and conclusion
Delineation of calibration regions is a key component of the T1w/T2w myelin mapping approach. We have developed an automated approach that is able to reliably segment appropriate regions in pediatric populations. The regions – CSF and scalp – are not brain tissue and therefore less likely to be influenced by myelination disorders, and have large spatial extents which is likely to improve reliability in the presence of bias field inhomogeneity as well as reducing partial voxel effect. Testing of our method in pediatric populations demonstrated reliable segmentation of calibration regions and lower variance of regional ratios than an existing method. This highlights the potential for our method to be implemented in pediatric myelination studies using the whole brain T1w/T2w ratio technique.Acknowledgements
We thank Dr. Christopher Adamson, PhD, for technical support.
This research was conducted within the Developmental Imaging and Neuroscience Research groups, Murdoch Children's Research Institute, the Department of Neurosurgery, the Royal Children's Hospital, at the Melbourne Children's MRI centre, Melbourne, Victoria. It was supported by the Royal Children's Hospital Foundation (RCH 1000 to Dr. Yang), Australia's National Health and Medical Research Council (Postgraduate Scholarship 1039160 to Dr. Yang), Murdoch Children's Research Institute, The University of Melbourne Department of Paediatrics, and the Victorian Government's Operational Infrastructure Support Program.
References
1. Ganzetti M, Wenderoth N, Mantini D. Whole brain myelin mapping using t1- and t2-weighted mr imaging data. Front Hum Neurosci. 2014;8:671
2. Glasser MF, Van Essen DC. Mapping human cortical areas in vivo based on myelin content as revealed by t1- and t2-weighted mri. J Neurosci. 2011;31:11597-11616
3. Ganzetti M, Wenderoth N, Mantini D. Mapping pathological changes in brain structure by combining t1- and t2-weighted mr imaging data. Neuroradiology. 2015;57:917-928
4. Yasuno F, Kazui H, Morita N, Kajimoto K, Ihara M, Taguchi A, et al. Use of t1-weighted/t2-weighted magnetic resonance ratio to elucidate changes due to amyloid beta accumulation in cognitively normal subjects. Neuroimage Clin. 2017;13:209-214
5. Beare R, Chen J, Adamson CL, Silk T, Thompson DK, Yang JY, et al. Brain extraction using the watershed transform from markers. Front Neuroinform. 2013;7:32
6. Beare R, Yang JY, Maixner WJ, Harvey AS, Kean MJ, Anderson VA, et al. Automated alignment of perioperative mri scans: A technical note and application in pediatric epilepsy surgery. Hum Brain Mapp. 2016;37:3530-3543
Figures