0696
Automatic MS lesion segmentation in the spinal cord using deep learning1NeuroPoly Lab, Polytechnique Montreal, Montréal, QC, Canada, 2Faculty of Medicine, University of Montreal, Montreal, QC, Canada, 3Montreal Neurological Institute, Montreal, QC, Canada, 4Department of Radiology, Beijing Tiantan Hospital, Capital Medical University, Beijing, China, 5Department of Radiology, Xuanwu Hospital, Capital Medical University, Beijing, China, 6Department of Radiology, University Hospital of Rennes, Rennes, France, 7Univ Rennes, Inria, CNRS, Inserm, IRISA UMR 6074, VISAGES ERL U-1228, F-35000, Rennes, France, 8Department of Neurology, University Hospital of Rennes, Rennes, France, 9University Hospital of Montpellier, Montpellier, France, 10CRMBM, CNRS, Aix-Marseille University, Marseille, France, 11CEMEREM, Hôpital de la Timone, AP-HM, Marseille, France, 12Department of Neurology, CHU Timone, APHM, Marseille, France, 13Neuroimaging Research Unit, INSPE, Division of Neuroscience, San Raffaele Scientific Institute, Vita-Salute San Raffaele University, Milan, Italy, 14Brigham and Women's Hospital, Harvard Medical School, Boston, MA, United States, 15Queen Square MS Centre, UCL Institute of Neurology, Faculty of Brain Sciences, University College London, London, United Kingdom, 16Functional Neuroimaging Unit, CRIUGM, Université de Montréal, Montreal, QC, Canada
Synopsis
Detection of multiple sclerosis (MS) lesions in the spinal cord
Purpose
To automatically segment both the spinal cord (SC) and MS lesion on a large range of T2-weighted MRI volumetric data from multiple sclerosis (MS) patients, by using a cascade of machine learning algorithms.Introduction
Conventional MRI sequences (e.g., T2-weighted) are used to detect MS lesions, providing a key clinical tool for diagnosing MS and assessing disease activity. Manual lesion segmentation is laborious, and results can be variable. Robust, automatic MS lesion segmentation methods are needed to reduce analysis time and increase consistency of results. However, such tools face important challenges due to the heterogeneity of lesion location, size and shape, and variability in scan quality (artifacts, resolution, contrast, etc.). Although automatic lesion segmentation from brain MRI data has been investigated over the past two decades1–3, these methods cannot be directly applied to spinal lesions, mainly due to the specific shape of the SC. In this study we propose a fully automatic pipeline to segment the SC and MS lesions, and to validate it against a large multi-center dataset of T2-w images.Data
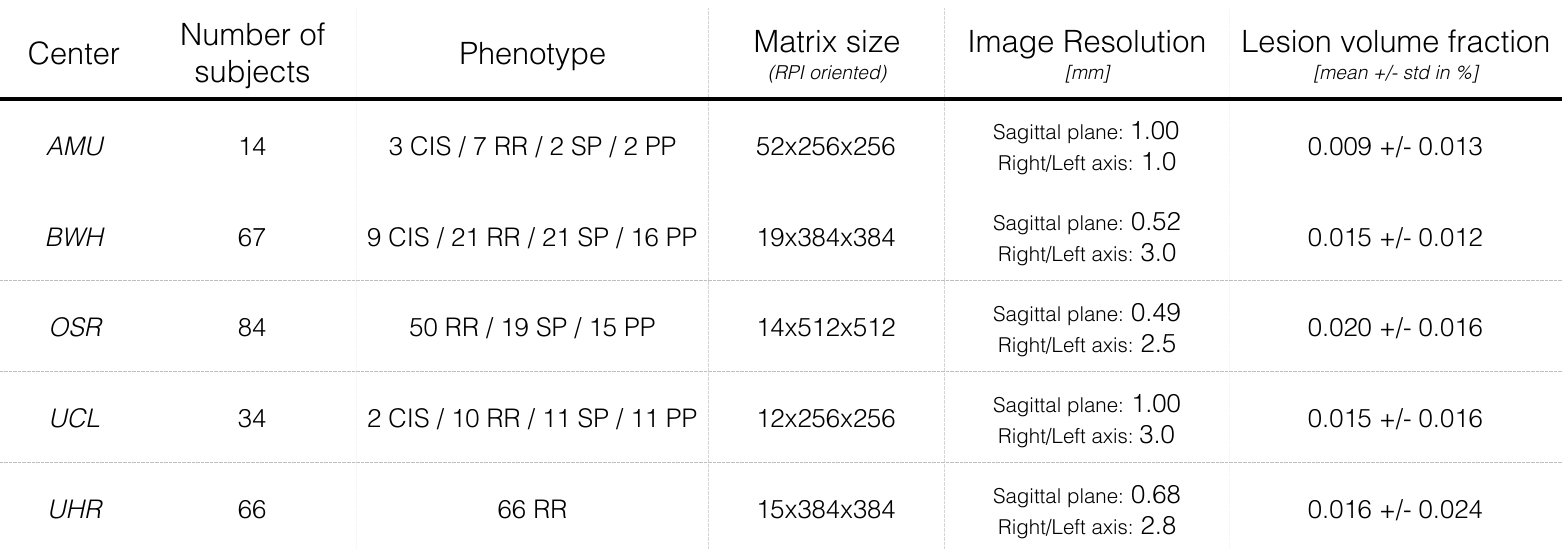
The dataset comprised 265 MS patients from 5 centers, and included all MS phenotypes. Images were acquired on 3T systems with a T2-w contrast. Dataset description is presented in Figure 1.
For each image, experts manually created both SC and lesion masks that were considered ground-truth for assessing the performance of the presented automatic algorithm. The dataset was randomly split into 3 sub-datasets: training (80%), validation (10%) and testing (10%).
Methods
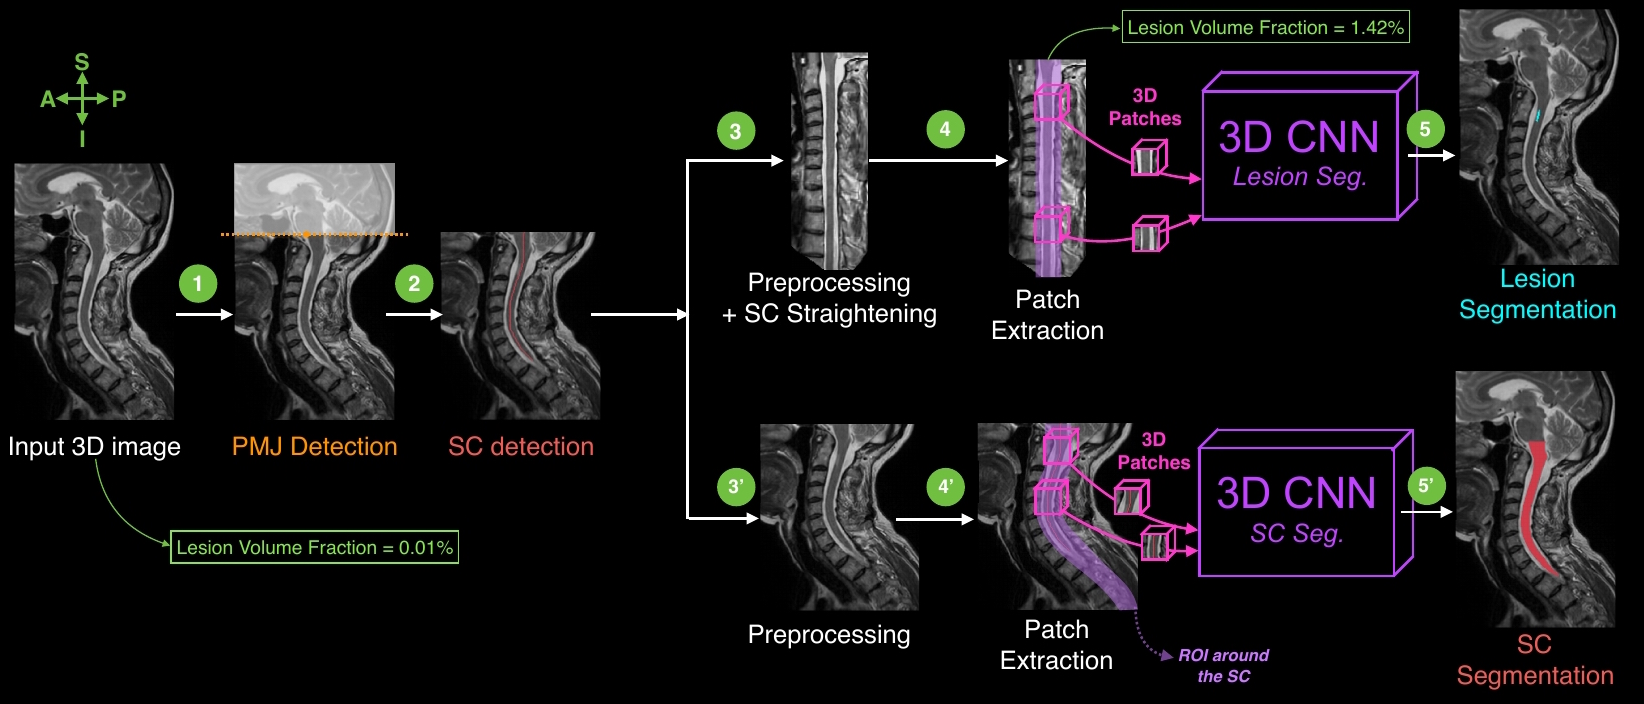
On average only 0.0164% of voxels per volumetric image are lesion voxels, creating a high imbalance of the proportion of lesion voxels in MRI images. Therefore, the idea of the proposed method is to gradually reduce the region of interest around the probable location of lesions (i.e. within the SC). Figure 2 presents the key steps of the processing pipeline.
Detection Preprocessing: All images were resampled to a common isotropic resolution (0.5mm) and set to a common orientation.
Ponto-Medullary Junction (PMJ) and SC detection: A linear Support Vector Machine (SVM) classifier and Histogram of Oriented Gradients (HOG) features were used to detect the PMJ4. The input image was then cropped at the predicted PMJ location. To detect the SC centerline, an optimization problem was solved as trade-off between a localization map (produced by a SVM classifier) and the cord continuity along the superior-inferior axis4.
Segmentation Preprocessing and Patch Extraction: As preprocessing step, an intensity standardization processing was performed per center5,6. For the MS lesion segmentation task, the data was straightened along the centerline7. 3D axial patches (24x24x24mm) were extracted along the predicted SC centerline.
SC and MS lesion segmentation: Two 3D convolutional neural networks (CNN)8 were fed by the extracted 3D patches. Networks were trained end-to-end from scratch (i.e., without requiring a pre-trained network) on a NVIDIA Tesla P100 GPU. Data augmentation consisted of random flips. Despite the large reduction of the region of interest around lesions, the class imbalance was still around 1.2% of true positive voxels. Therefore, we used additional strategies to mitigate the imbalanced data: (i) oversampling the positive samples in the training dataset9 and (ii) using the generalized dice loss10.
Results
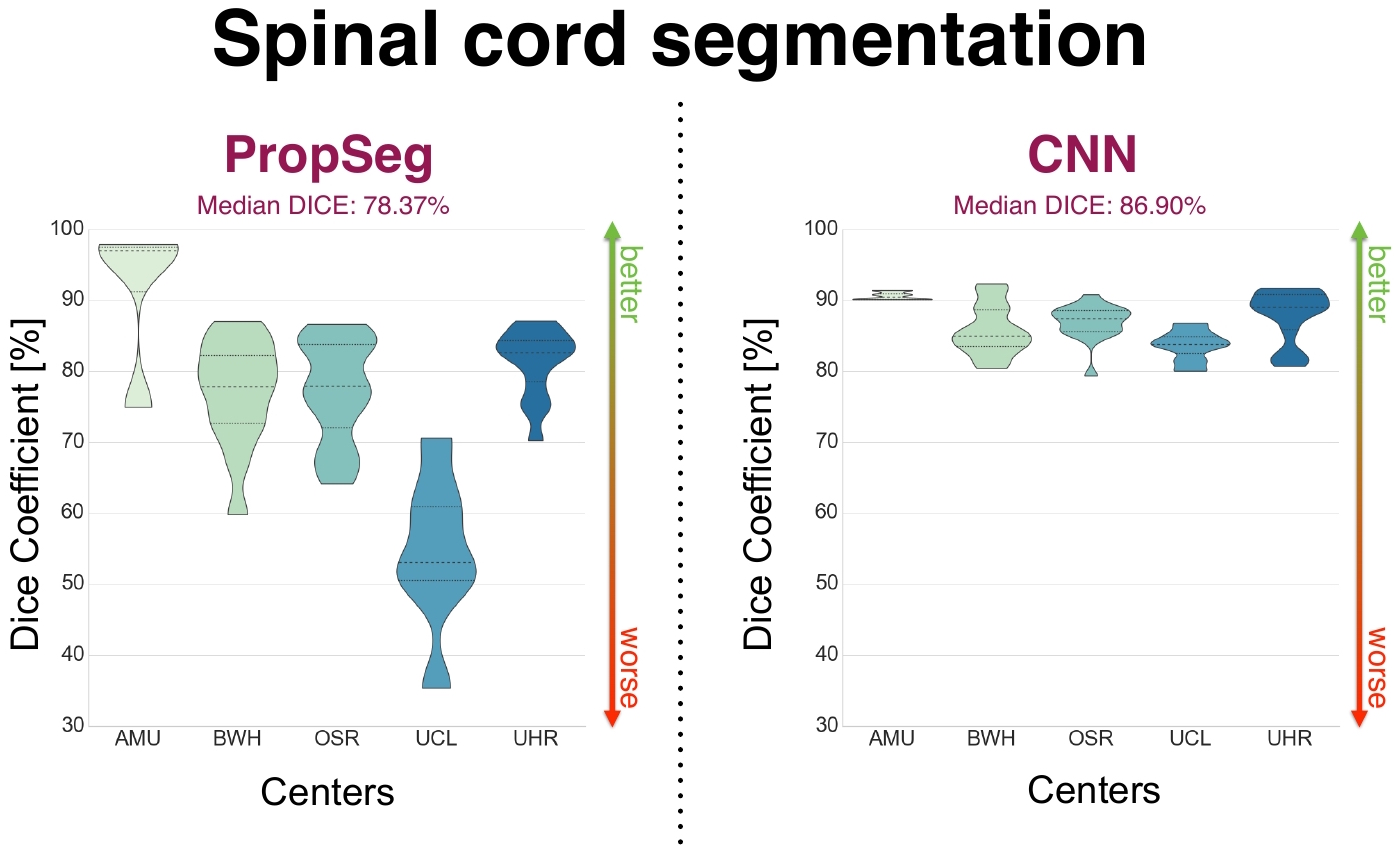
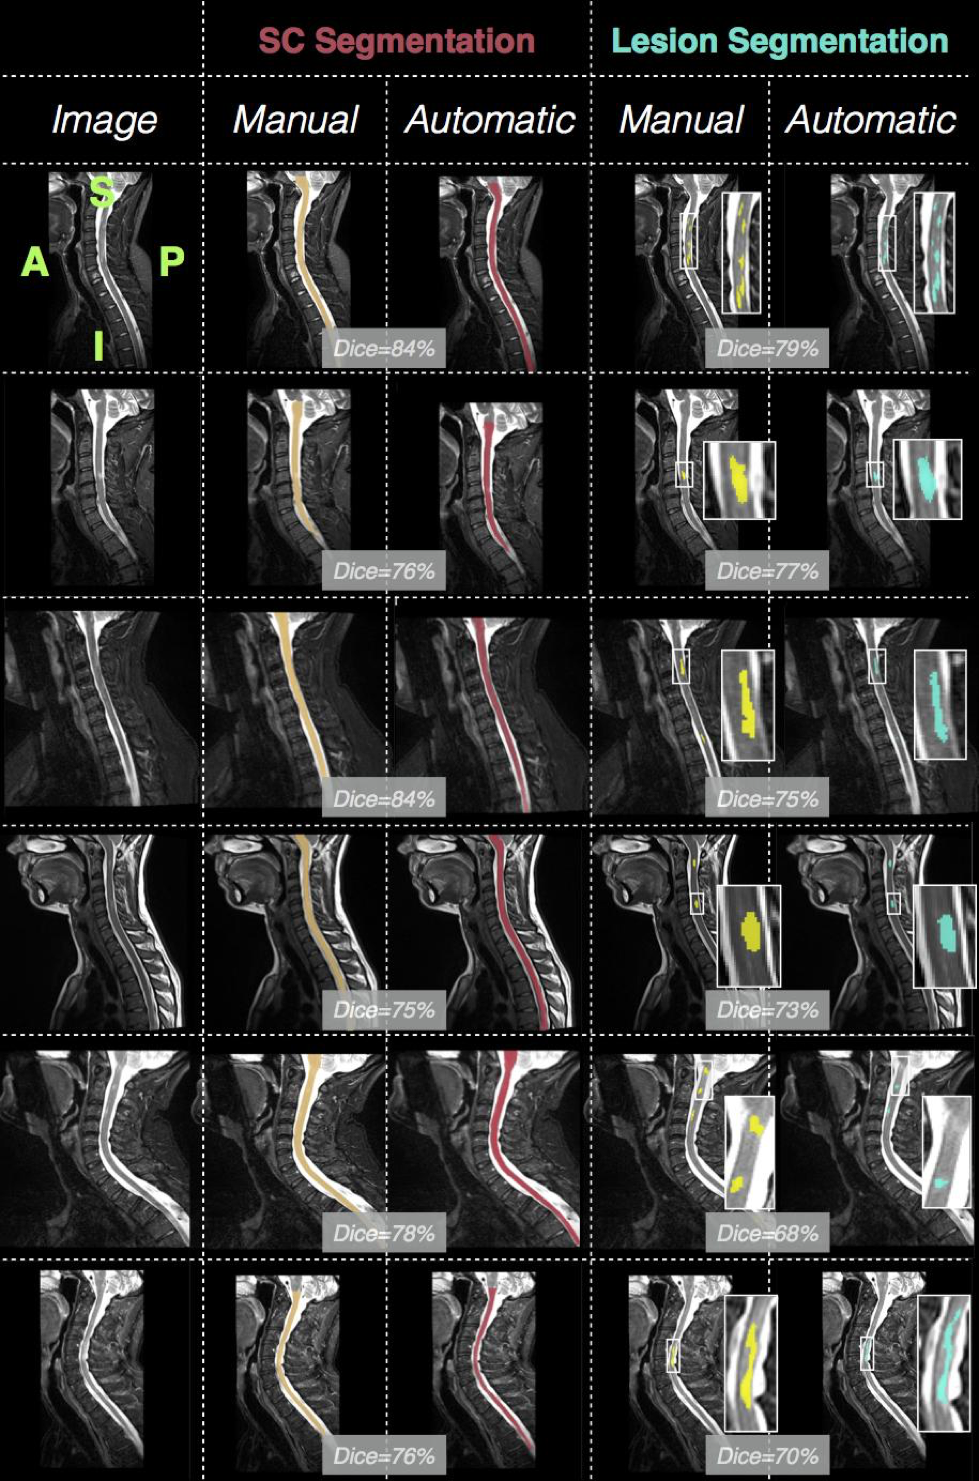
The PMJ presence on the images was automatically detected with a precision of 100% (i.e. no image without PMJ was cropped), a recall of 65.22% (i.e. some images with PMJ were not cropped) and an averaged absolute distance error of 0.97 +/- 0.78mm. The averaged Mean Squared Error (MSE) between the ground truth and the predicted centerlines was 1.67 +/- 0.65mm. The proposed SC segmentation method achieved better results than PropSeg (averaged Dice: 86.72 +/- 3.44% vs. 76.28 +/- 11.95%, see Figure 3), a previously-published algorithm11 available in the Spinal Cord Toolbox (SCT)12.
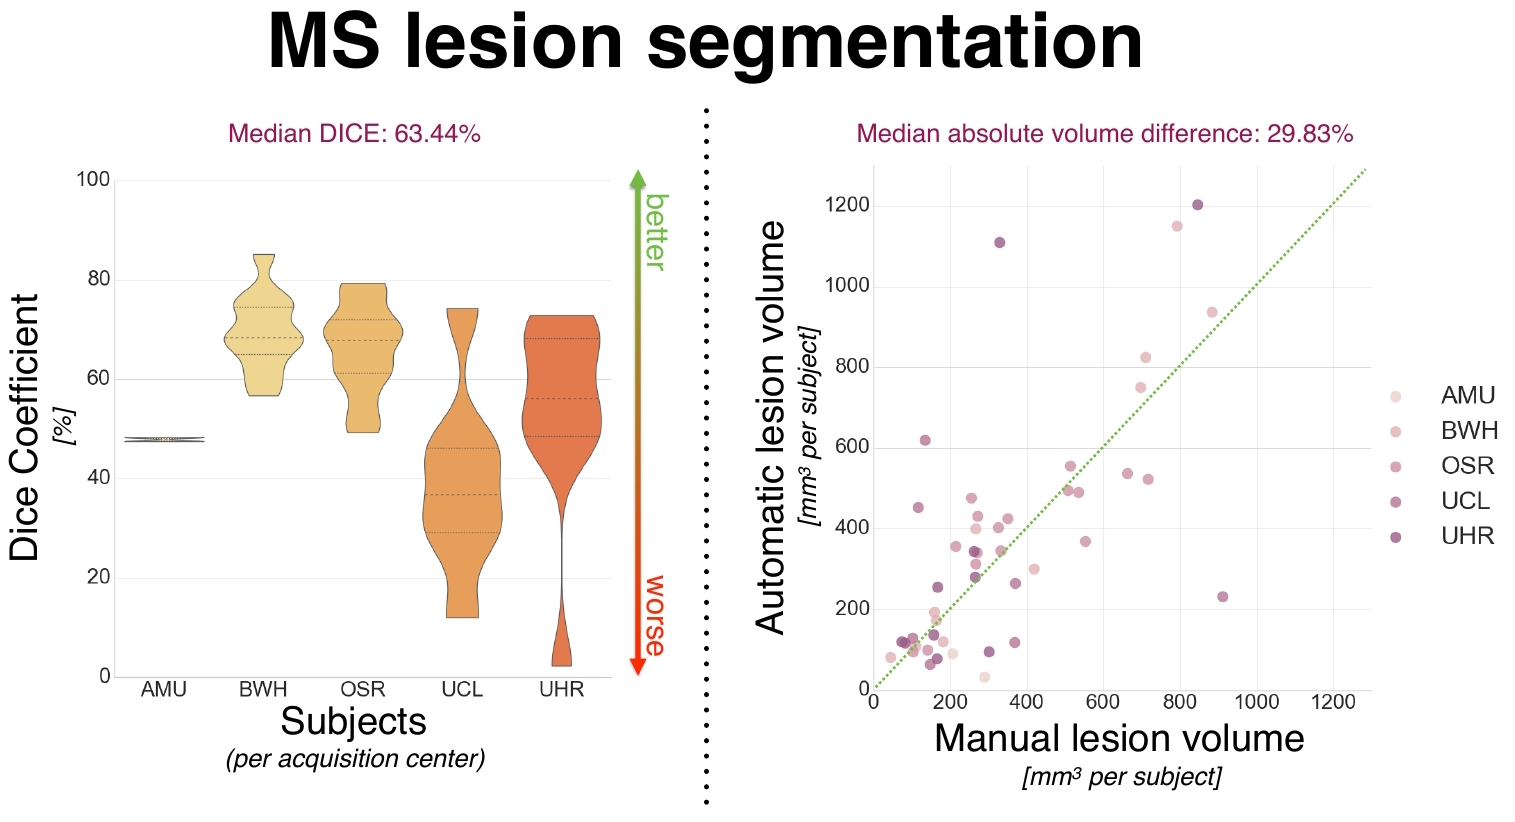
To assess inter-rater variability, consensus of lesion segmentation between raters was measured and yielded a Dice coefficient of 69.94 +/- 8.23% (majority voting segmentation). The proposed lesion segmentation method achieved an averaged Dice of 61.02 +/- 17.0% and a median absolute lesion volume difference of 29.83% (see Figure 4 and 5). However, the method performance differs notably depending on the center (e.g. median Dice 68.39 vs. 36.76% for subjects from BWH and UCL centers respectively), which appears to be consistent with inter-rater variability results across centers.
Discussion and Conclusion
The key contribution of this work is a fully automatic pipeline that segments the SC and lesions in MS patients. Further works will focus on (1) improving SC segmentation by performing post-processing, (2) increasing lesion segmentation robustness with regard to the heterogeneity observed in multi-center. Once the algorithm is ready to be used by others, we will make it publicly available in SCT.Acknowledgements
We would like to acknowledge all members from the NeuroPoly laboratory for useful and constructive discussions, especially Dominique Eden and Benjamin De Leener for their daily and valuable support.
Acknowledged for sharing data: Dr. Claudia Gandini Wheeler-Kingshott (University College London).
Grant support:
- The Canada Research Chair in Quantitative Magnetic Resonance Imaging (JCA), the Canadian Institute of Health Research [CIHR FDN-143263], the Canada Foundation for Innovation [32454, 34824], the Fonds de Recherche du Québec - Santé [28826], the Fonds de Recherche du Québec - Nature et Technologies [2015-PR-182754], the Natural Sciences and Engineering Research Council of Canada [435897-2013] and the Quebec BioImaging Network.
- The Centre National de la Recherche Scientifique (CNRS), the “Fondation A*midex-Investissements d'Avenir” and the “Fondation Aix-MArseille Université”, the Stockholm County Council (ALF project).
- The French National Program for Clinical Research (PHRC) which funded the EMISEP study. The European Union (FEDER), the French State, the Brittany Council, Rennes Metropole, Inria, Inserm and the University Hospital of Rennes for supporting data acquisition.”
References
1. García-Lorenzo, D., Francis, S., Narayanan, S., Arnold, D. L. & Collins, D. L. Review of automatic segmentation methods of multiple sclerosis white matter lesions on conventional magnetic resonance imaging. Med. Image Anal. 17, 1–18 (2013).
2. Lladó, X. et al. Segmentation of multiple sclerosis lesions in brain MRI: A review of automated approaches. Inf. Sci. 186, 164–185 (2012).
3. de Sitter, A. et al. Performance of five research-domain automated WM lesion segmentation methods in a multi-center MS study. Neuroimage 163, 106–114 (2017).
4. Gros, C. et al. OptiC: Robust and Automatic Spinal Cord Localization on a Large Variety of MRI Data Using a Distance Transform Based Global Optimization. in Lecture Notes in Computer Science 712–719 (2017).
5. Nyúl, L. G. & Udupa, J. K. On standardizing the MR image intensity scale. Magn. Reson. Med. 42, 1072–1081 (1999).
6. Shah, M. et al. Evaluating intensity normalization on MRIs of human brain with multiple sclerosis. Med. Image Anal. 15, 267–282 (2011).
7. De Leener, B. et al. Topologically preserving straightening of spinal cord MRI. J. Magn. Reson. Imaging (2017). doi:10.1002/jmri.25622
8. Çiçek, Ö., Abdulkadir, A., Lienkamp, S. S., Brox, T. & Ronneberger, O. 3D U-Net: Learning Dense Volumetric Segmentation from Sparse Annotation. in Lecture Notes in Computer Science 424–432 (2016).
9. Buda, M., Maki, A. & Mazurowski, M. A. A systematic study of the class imbalance problem in convolutional neural networks. arXiv preprint arXiv:1710. 05381 (2017).
10. Sudre, C. H., Li, W., Vercauteren, T., Ourselin, S. & Jorge Cardoso, M. Generalised Dice Overlap as a Deep Learning Loss Function for Highly Unbalanced Segmentations. in Lecture Notes in Computer Science 240–248 (2017).
11. De Leener, B., Cohen-Adad, J. & Kadoury, S. Automatic Segmentation of the Spinal Cord and Spinal Canal Coupled With Vertebral Labeling. IEEE Trans. Med. Imaging 34, 1705–1718 (2015).
12. De Leener, B. et al. SCT: Spinal Cord Toolbox, an open-source software for processing spinal cord MRI data. Neuroimage (2016). doi:10.1016/j.neuroimage.2016.10.009
Figures