0695
Automated Segmentation of Cerebellar Nuclei from Ultra-High-Field Quantitative Susceptibility Maps with Multi-Atlas Shape Fusion1Spinoza Centre for Neuroimaging, Amsterdam, Netherlands, 2Netherlands Institute for Neuroscience, Amsterdam, Netherlands, 3Max Planck Institute for Human Cognitive and Brain Sciences, Leipzig, Germany, 4Medical Physics Group, Jena University Hospital, Jena, Germany, 5Siemens Healthcare GmbH, Erlangen, Germany, 6Department of Neurology, Essen University Hospital, University of Duisburg-Essen, Essen, Germany
Synopsis
Multi-atlas segmentation techniques fail to properly represent very small nuclei because of their low overlap in the fusion stage. We present a shape modeling approach that recovers more accurately such small structures, which we apply to the segmentation of the deep cerebellar nuclei.
Introduction
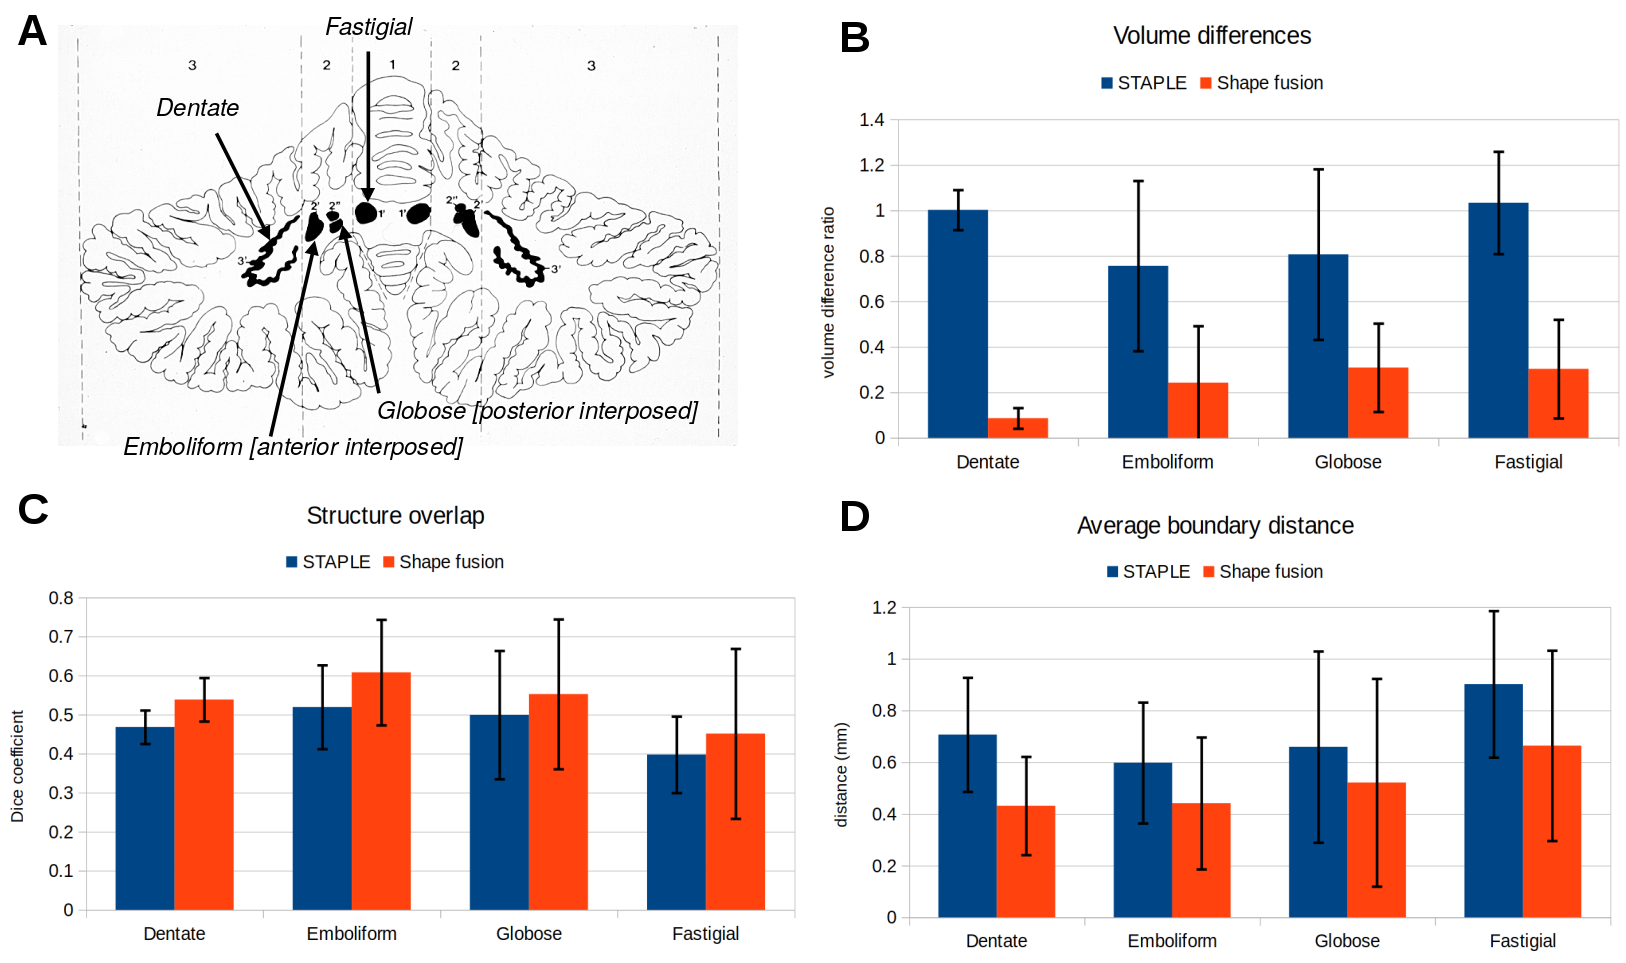
Recent multi-atlas methods for image segmentation have become very effective, for instance to segment the hippocampus or the cerebellar lobules1,2. These techniques, while improving the registration aspect, still rely on fairly simple fusion methods for generating the final segmentation, such as majority voting or STAPLE3 that ignore the shape of the structures and assume a fair amount of intra-individual overlap between segmentations. Automatic approaches for accurately delineating the cerebellar nuclei on MR images are scarce and typically utilize one individual atlas4, where the dentate nucleus is represented as a bean-like structure. The dentate nucleus, however, is a highly convoluted structure on the order of 400 mm³, while the other cerebellar nuclei, the emboliform nucleus, the globose nucleus and the fastigial nucleus are rather small with volumes of around 50 mm³, 10 mm³ and 45 mm3, respectively5 (Fig. 1A). In such cases, the assumption of overlap is compromised if the dentate nucleus ribbon is not perfectly aligned and registration accuracy is on the order of nucleus size. Here, we propose an alternate fusion technique based on explicit shape modeling rather than a voxel-by-voxel analysis to overcome this limitation for the segmentation of cerebellar nuclei in high resolution 7T quantitative susceptibility mapping (QSM) of the cerebellum.Methods
Image acquisition and reconstruction: Ten whole brain T2*-weighted images of young subjects were acquired using a 3D flow-compensated FLASH sequence at a resolution of 0.5 mm isotropic on a Siemens 7 T MRI scanner with a 24-channel Nova head coil (TE 11.2 ms, TR 22 ms, FA 10°, GRAPPA acceleration factor 2, 6/8 partial Fourier, acquisition time 20:22 min:sec). Quantitative susceptibility maps were calculated from the FLASH phase images using sophisticated harmonic artifact reduction for phase data with varied radii (V-SHARP)6 and homogeneity enabled incremental dipole inversion (HEIDI)7.
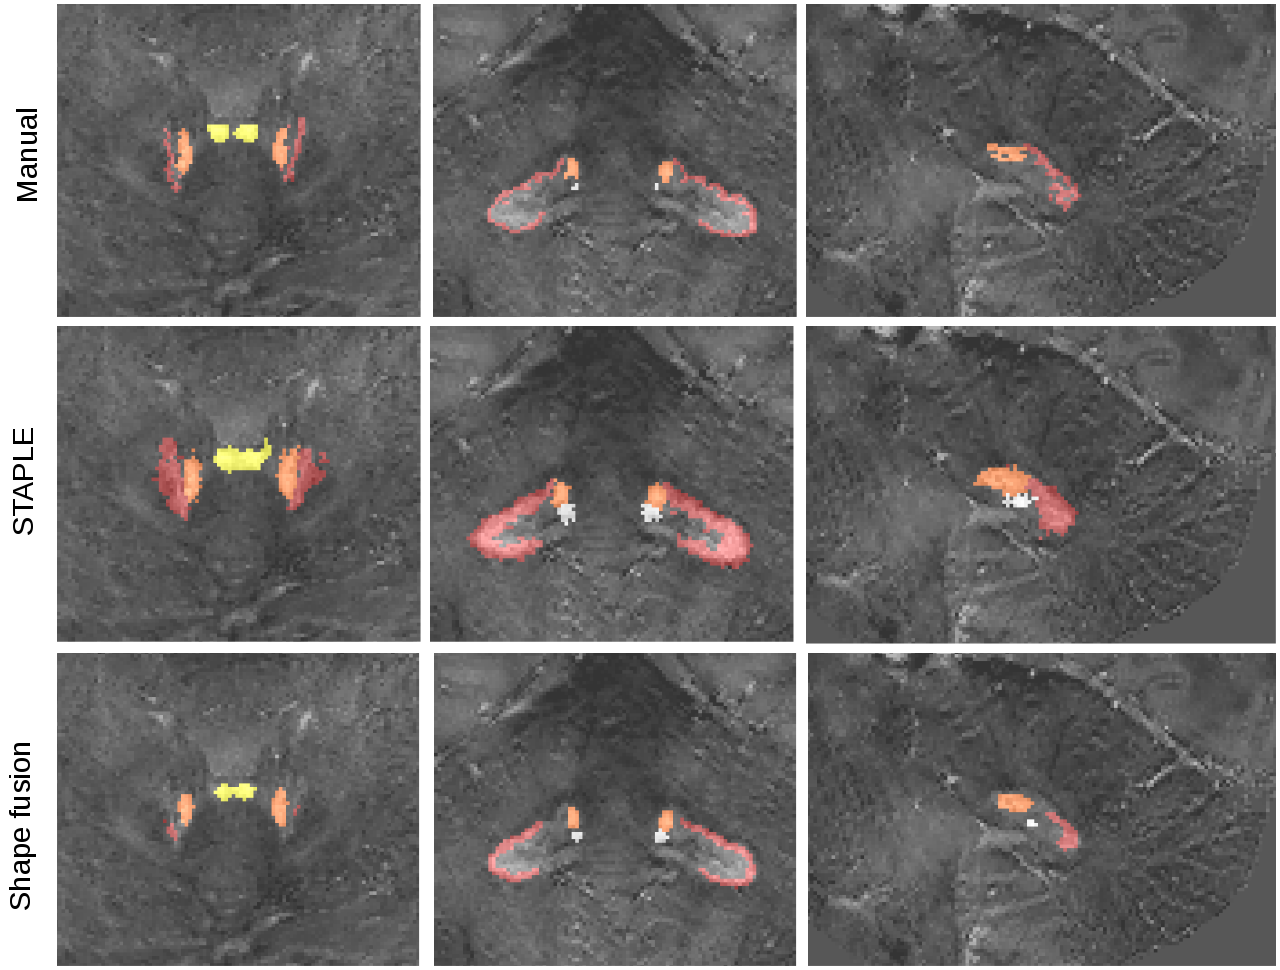
Manual delineations: Cerebellar nuclei were visually identified on the susceptibility images. Because of their high iron content the cerebellar nuclei appear bright on these maps. The cerebellar nuclei were delineated manually on the axial, sagittal and coronal images by a trained lab technician using MRICroN (http://people.cas.sc.edu/rorden/mricron/).
Image processing: We compared multi-atlas segmentation approaches with a leave-one-out strategy, i.e., nine subjects were used as segmentation templates for the remaining one. Firstly, we deformed susceptibility maps between each template and subject using ANTs8. Secondly, we performed label fusion either with STAPLE3, which estimates jointly the maximum likelihood labeling and the relative accuracy of raters, or with a dedicated shape-based averaging method. The latter consisted in building signed distance functions for each nucleus before deformation, then transforming and averaging them across templates. The zero-level set of the averaged distance function which represents the nucleus is then re-estimated, so that the average shape volume is the closest possible to the average volume of the deformed templates. Accuracy of both fusion approaches was assessed by computing volume differences, Dice overlaps, and average boundary distances between manual and automated segmentations (Fig. 1).
Results and Discussion
Due to the small size and low amount of overlap of the four cerebellar nuclei, STAPLE resulted in highly inflated volumes (Fig. 2), while the shape fusion method greatly reduced this problem. Overlap accuracy was systematically improved, although the obtained numbers are still low due to the small size of the emboliform, globose and fastigial nuclei as well as the thin and convoluted dentate nucleus. Boundary distance improved to fall generally within one voxel. Interestingly, both methods use the same approach for atlas registration. While the voxel-based method makes predictions of individual labeling quality, our shape-based approach assumes equal weights but treats each labeling as a single object. When comparing the larger, more convoluted dentate to the three other nuclei, the improvement brought by shape fusion is more pronounced for the volume (168% improvement, compared to 89-109%) and boundary distance (48% improvement, compared to 23-30%), but is overall similar for overlap (10-16% improvement for all nuclei).Conclusion
We presented an efficient shape-based method for label fusion in the context of multi-atlas labeling of the deep cerebellar nuclei from QSM. We show substantial improvements in segmentation quality both for large but geometrically complex and small nuclei. Utilization of shape information provides more specific information to define an average structure with preserved global properties compared to the usual voxel-based fusion methods. Inclusion of additional information about appearance or shape characteristics in this global multi-atlas shape-based segmentation framework will most likely further improve segmentation performance, and may reach the capabilities of expert human raters.Acknowledgements
We would like to thank Beate Brol for manual delineation of the deep cerebellar nuclei, and Max Keuken and Birte Forstmann for many methodological discussions on closely related topics. Partially funded by the DFG (DE 2516/1-1 and TI 239/17-1).References
1. Coupé, P., Manjón, J.V., Fonov, V., Pruessner, J., Robles, M., Collins, D.L., 2011. Patch-based segmentation using expert priors: Application to hippocampus and ventricle segmentation. NeuroImage 54, 940–954. doi:10.1016/j.neuroimage.2010.09.018.
2. Pipitone, J., Park, M.T.M., Winterburn, J., Lett, T.A., Lerch, J.P., Pruessner, J.C., Lepage, M., Voineskos, A.N., Chakravarty, M.M., 2014. Multi-atlas segmentation of the whole hippocampus and subfields using multiple automatically generated templates. NeuroImage 101, 494–512. doi:10.1016/j.neuroimage.2014.04.054.
3. Warfield, S.K., Zou, K.H., Wells, W.M., 2004. Simultaneous truth and performance level estimation (STAPLE): an algorithm for the validation of image segmentation. IEEE Trans Med Imaging 23, 903–921. doi:10.1109/TMI.2004.828354.
4. Diedrichsen J, Maderwald S, Küper M, Thürling M, Rabe K, Gizewski ER, Ladd ME, Timmann D., 2011. Imaging the deep cerebellar nuclei: a probabilistic atlas and normalization procedure. NeuroImage 54, 1786–94. doi: 10.1016/j.neuroimage.2010.10.035.
5. Tellmann, S., Bludau, S., Eickhoff, S., Mohlberg, H., Minnerop, M., Amunts, K., 2015. Cytoarchitectonic mapping of the human brain cerebellar nuclei in stereotaxic space and delineation of their co-activation patterns. Frontiers in Neuroanatomy 9, 54. doi: 10.3389/fnana.2015.00054.
6. Schweser, F., Deistung, A., Lehr, B.W., Reichenbach, J.R., 2011. Quantitative imaging of intrinsic magnetic tissue properties using MRI signal phase: An approach to in vivo brain iron metabolism? NeuroImage 54, 2789–2807. doi:10.1016/j.neuroimage.2010.10.070.
7. Schweser, F., Sommer, K., Deistung, A., Reichenbach, J.R., 2012. Quantitative susceptibility mapping for investigating subtle susceptibility variations in the human brain. NeuroImage 62, 2083–2100. doi:10.1016/j.neuroimage.2012.05.067.
8. Avants, B.B., Epstein, C.L., Grossman, M., Gee, J.C., 2008. Symmetric diffeomorphic image registration with cross-correlation: Evaluating automated labeling of elderly and neurodegenerative brain. Medical Image Analysis 12, 26–41.
9. Naidich, T.P., Duvernoy, H.M. (Eds.), 2009. Duvernoy’s atlas of the human brain stem and cerebellum: high-field MRI: surface anatomy, internal structure, vascularization and 3D sectional anatomy. Springer, Wien ; New York.
Figures