0693
Self-Organising Maps Enable Global Searching For Patch Based Segmentations1The Australian e-Health Research Centre, Commonwealth Science and Industrial Research Organisation, Brisbane, Australia
Synopsis
Most automated MRI tissue-segmentation techniques require whole-brain atlases, which are extremely time-consuming to manually delineate. This inhibits utilisation of complementary structural sequences during segmentation as matching atlases rarely exist. We demonstrate a means of reducing the computational complexity of patch-based segmentation using self-organising maps. This overcomes the need for local-only searching of matching patches and, in turn, the need for complete atlases. We demonstrate this technique’s ability to perform registration-free tissue-segmentation of target images using an atlas that is less than 2% complete. The technique may be used as-is, or for rapidly generating novel whole-brain atlases for other techniques.
Introduction
Most automated MRI tissue-segmentation techniques require whole-brain
atlases, which are extremely time-consuming to manually delineate. This inhibits
utilisation of complementary structural sequences during segmentation as
matching atlases rarely exist. Such methods also typically rely on registration
and are not robust to pathology. Patch-based segmentation is a technique that
exploits repeated patterns of brain structure. Such techniques match ‘patches’
– small cubes of voxels – between atlas and target images, transferring labels
from matching atlas-patches the target image. Computational complexity,
however, typically restricts searching to nearby patches, which requires
registration.1 As such, patch-based
segmentation can suffer similar difficulties to more-traditional techniques.
We demonstrate that self-organising maps (SOM) – a technique
originally designed to qualitatively arrange data – allows for efficient searching
of an entire atlas for matching patches, doing so more effectively than other
dimensionality-reduction techniques. This allows segmentation that does not require
pre-registration and utilisation of atlases for which only a fraction of the
brain has been segmented.
Method
Overview
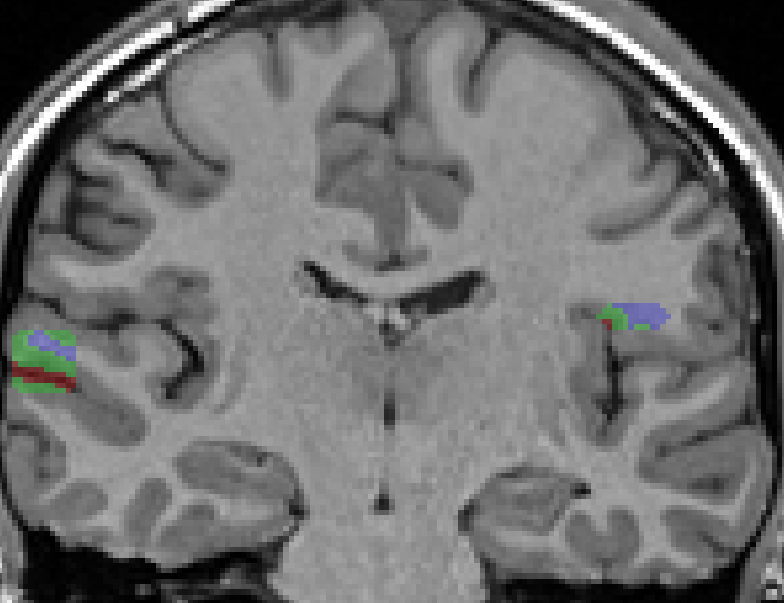
MPRAGE images from adults were randomly assigned as either atlas (n=1) or target (n=10). Manually edited brain masks and segmentation ground truths for cortical grey matter, white matter, and CSF were available for each from a previous study.2 On the atlas, three 10x10 voxel ‘atlas ROIs’ were defined and dilated twice (Figure 1). Voxels for the entire brain of each target image were segmented using only atlas patches fully within this atlas ROI. The accuracy of the resultant tissue segmentations in cortical tissue and the brainstem were recorded. This process was repeated for a variety of atlas ROI sizes, each generated by dilating this initial ROI.
Global-Search Patch Technique
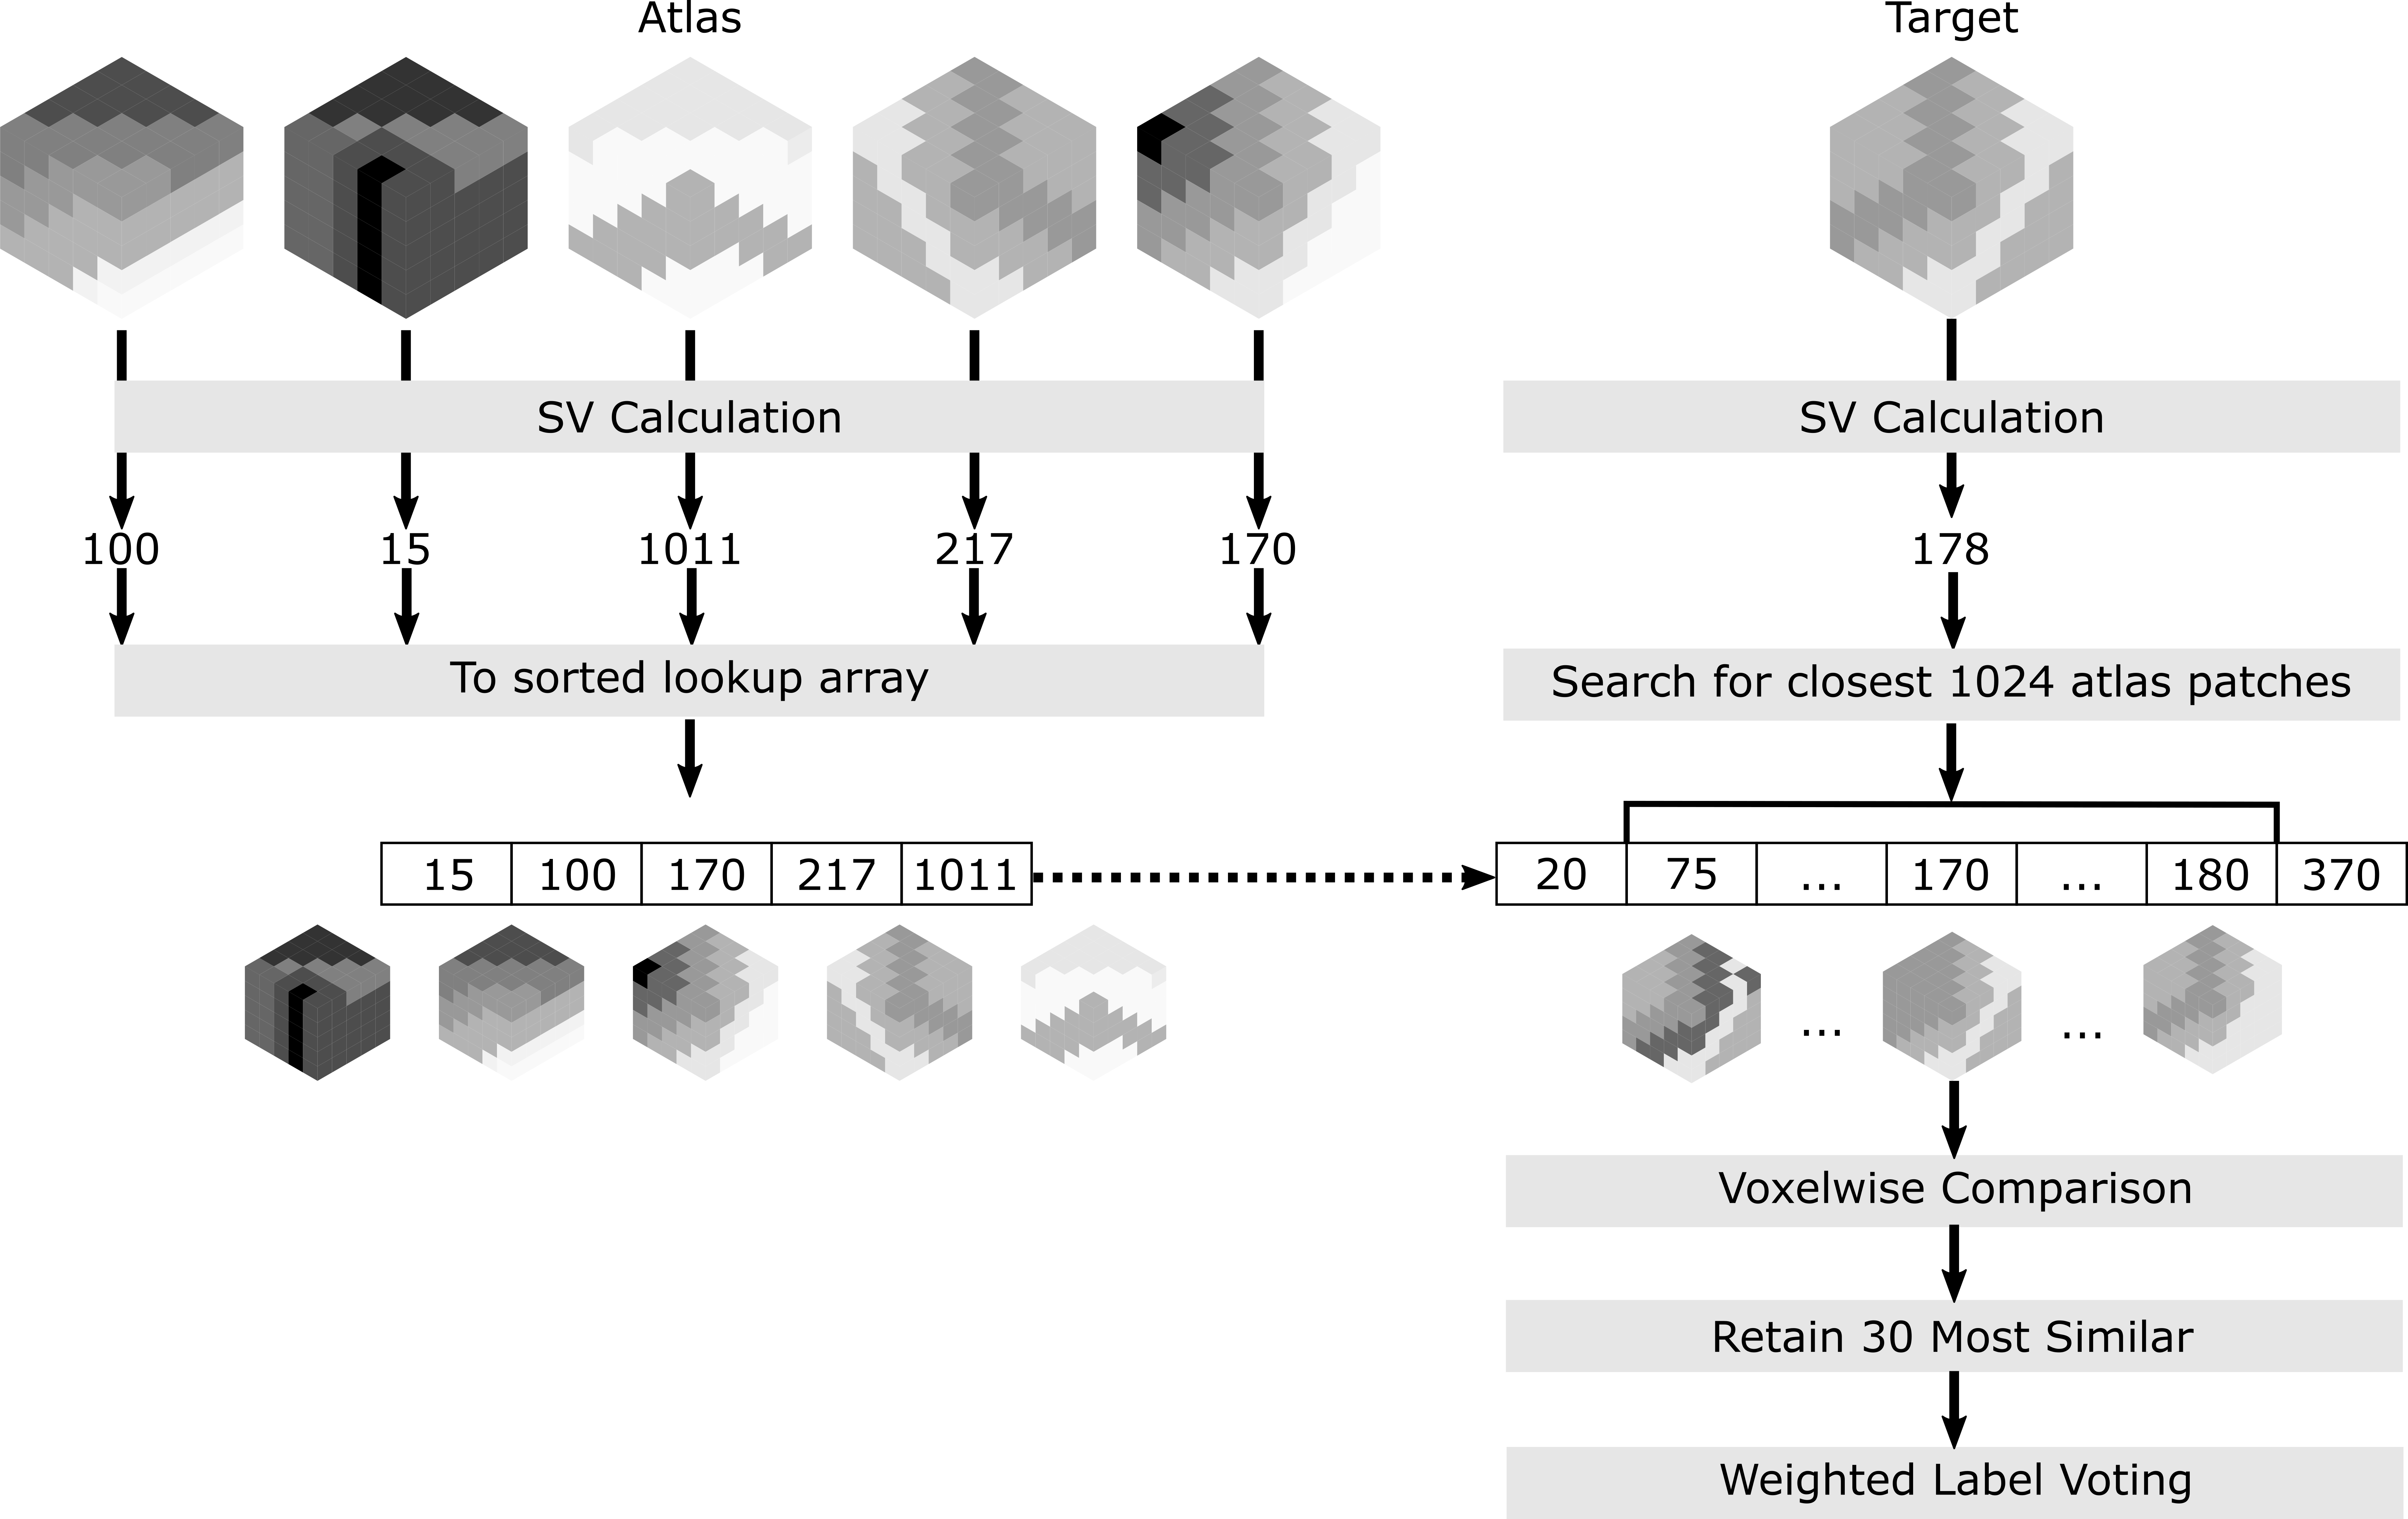
Figure 2 details the technique. Voxels within the provided brainmask were grouped into overlapping 5x5x5 voxel patches with no positional information retained. Each patch was indexed as a single value (SV). The following SV methods were compared: PCA (ε0), mean voxel intensity, random (SV randomly generated), SOM. Each SOM was arranged as an array of 256 nodes. SV calculation using the SOM was performed by locating the continuous position in this array (i.e. between the best and second-best matched nodes) based on voxelwise sum of square differences (SSD). For all methods, atlas patches were sorted by their SV in an array. The voxelwise SSD was calculated between the target patch and 1024 atlas patches with the most similar SVs. Labels from the 30 most similar patches were combined as a weighted (1/SSD) average and applied in a voxelwise fashion, as in Manjon et al.1
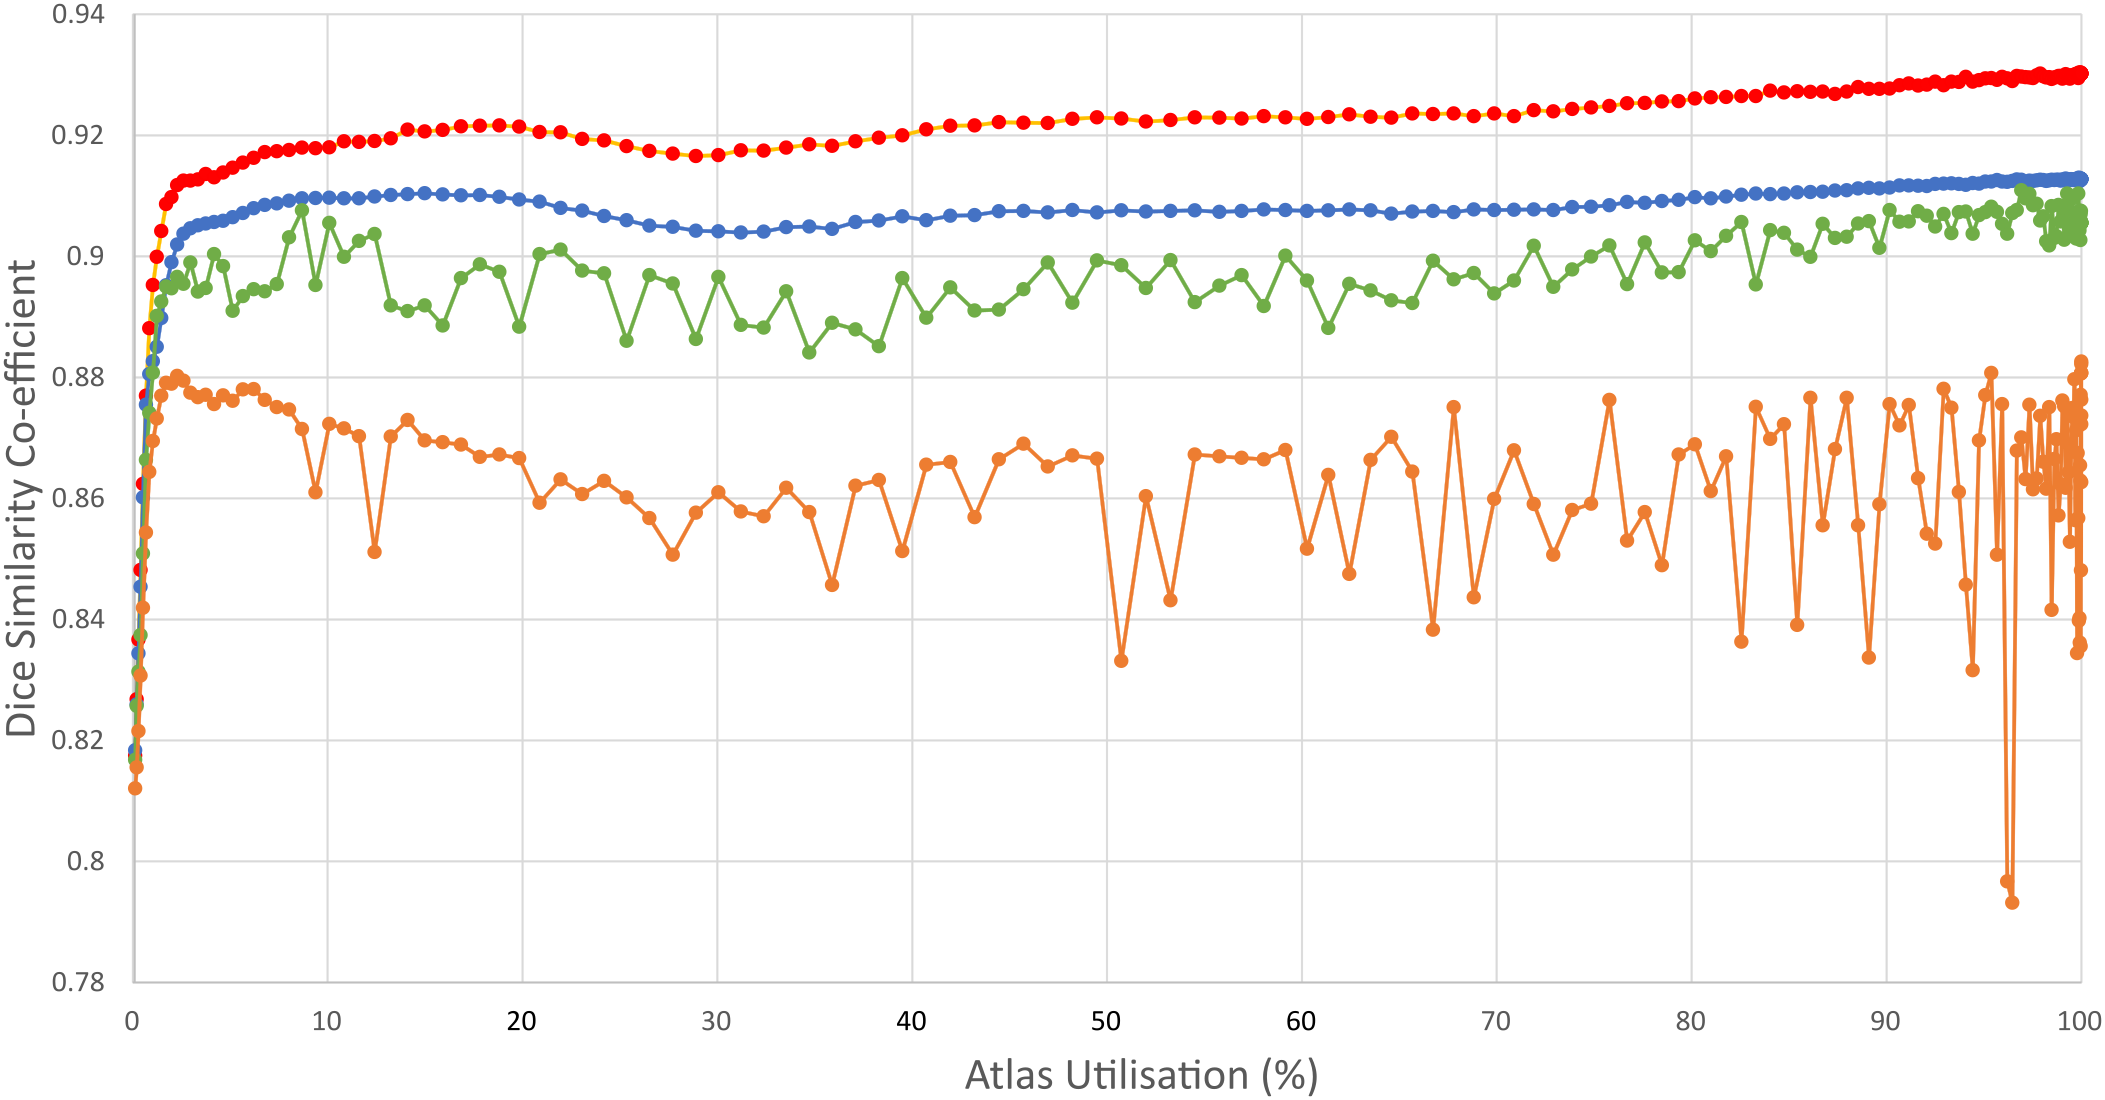
Results
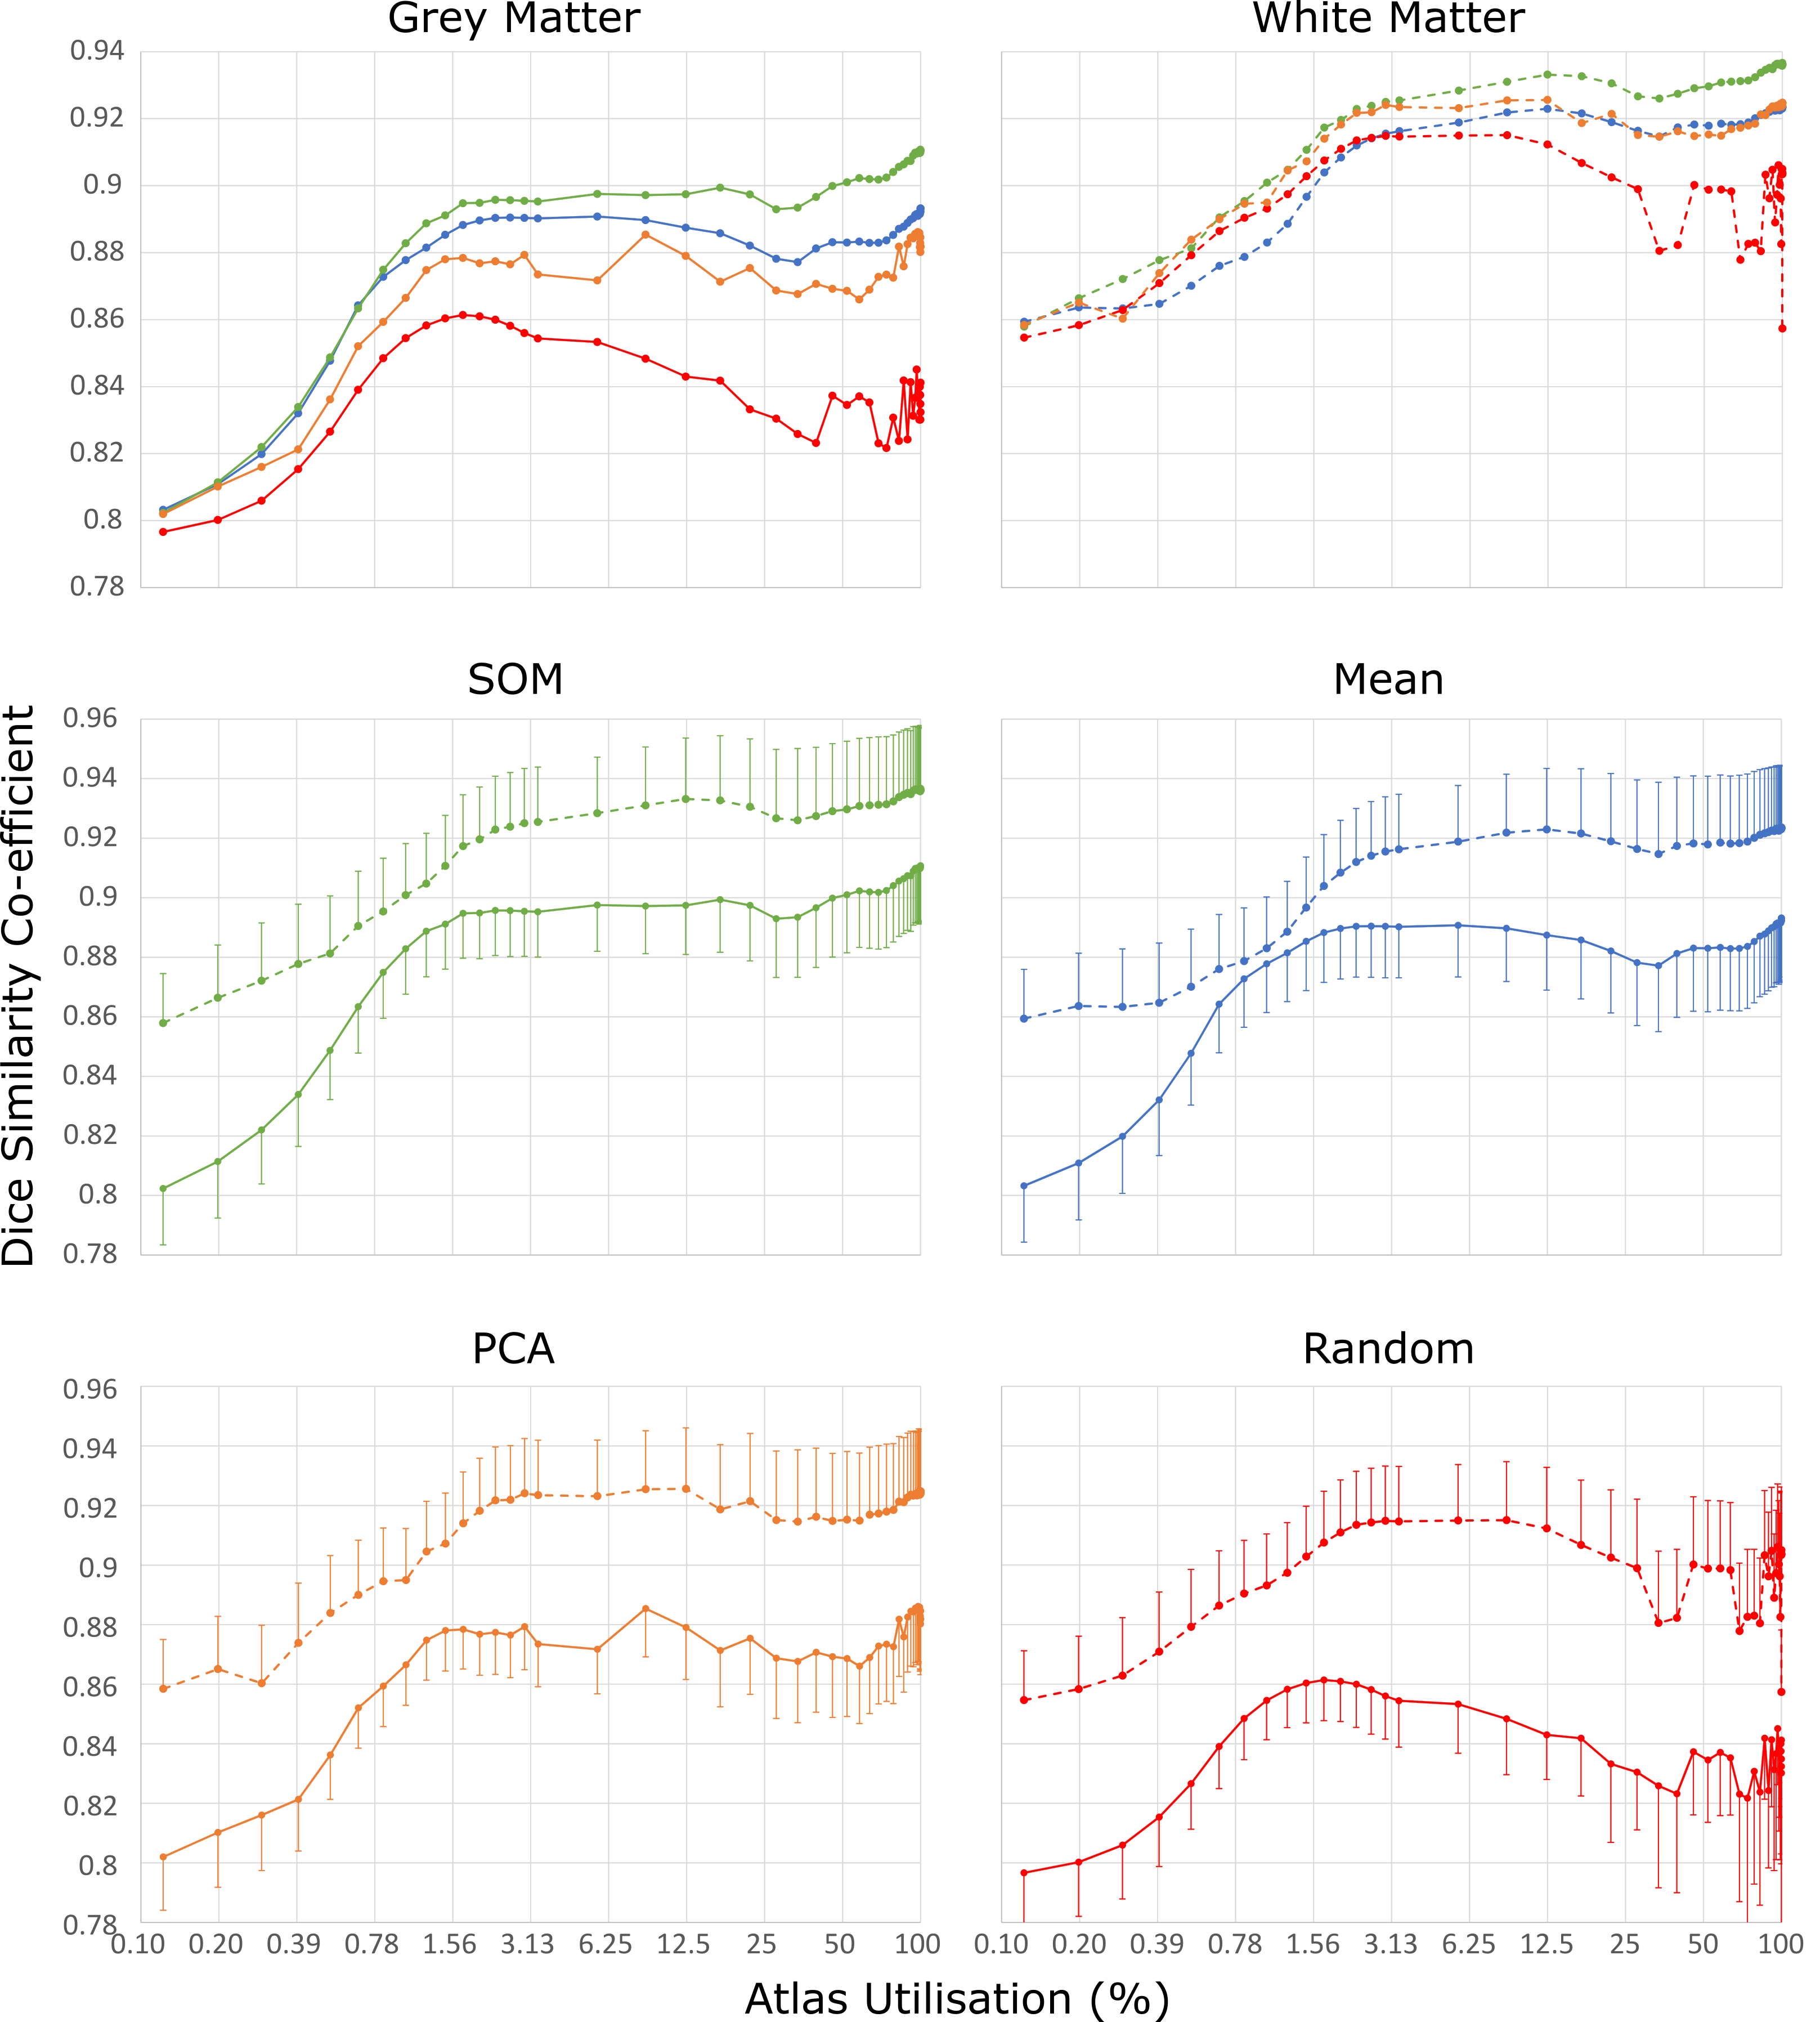
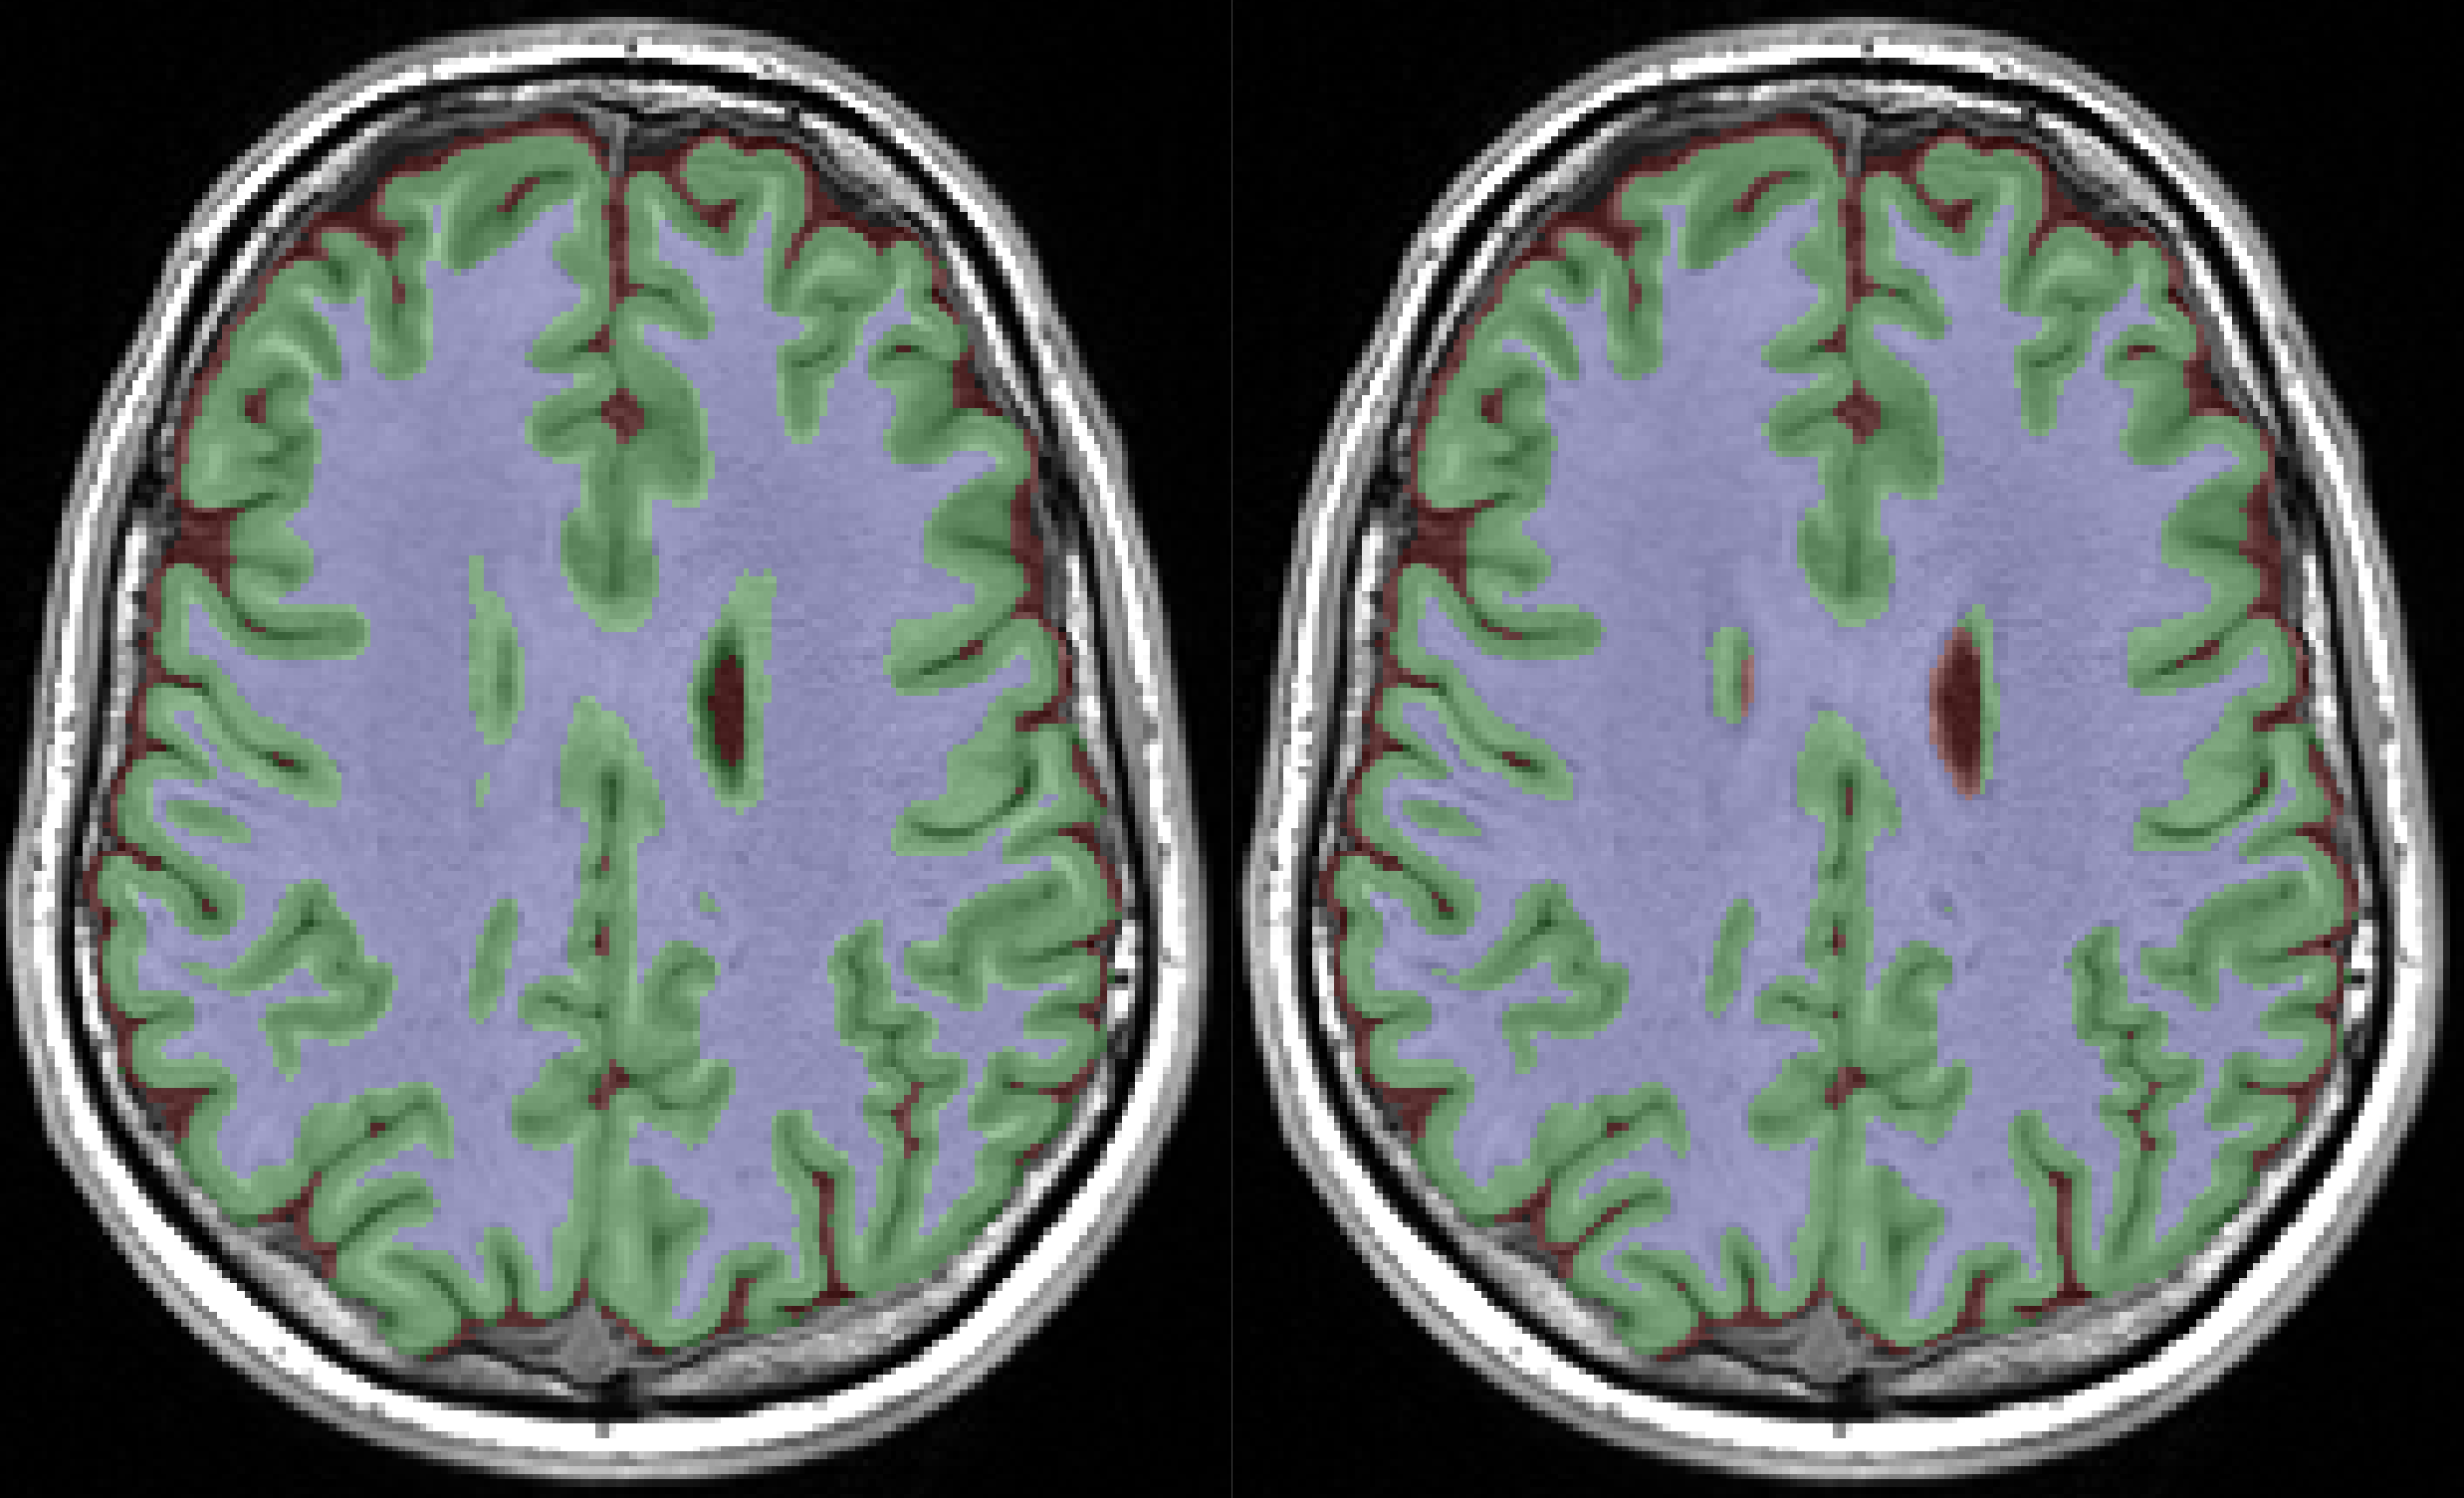
Run times were 2 – 4.5 minutes on a three-GPU (Nvidia Tesla K20) PC. The non-random SV methods increased accuracy sharply between 0.1% and 2% of atlas utilisation, after which a gradual increase was seen with increasing atlas utilisation (Figure 3, Figure 4). All methods outperformed EM segmentation at atlas utilisation > 0.4%. The SOM method provided superior segmentation accuracy to other methods, particularly for grey-matter labelling, and was more stable than PCA or random SV generation (Figure 5). Mean dice scores for the SOM method (grey-matter 0.91; white-matter 0.94) at 100% atlas utilisation were comparable to those recently published for convolutional neural networks.3 We also re-ran the SOM-based analysis for a single dataset providing, for each atlas patch, 48 augmentations (all possible rotations, plus their mirror images). This reduced the amount of labelled atlas required to achieve grey-matter dice coefficients of 0.9 from ~2% to 1.2%, however offered little improvement over the non-augmented method at >2% atlas utilisation.Discussion
Patch-based techniques ideally leverage the redundancy contained in images. We have overcome the computational burden of searching a full image for matching patches through dimensionality reduction. A major benefit of this approach is that it can segment the full cortex using as little as 2% of an atlas, or even lower by providing rotations and mirror images of this partial segmentation.
SOM demonstrated superior accuracy and stability to other methods. This is likely due to its ability to separate patches from their mirrored or rotated equivalents (unlike mean), moderate immunity to tissue class frequency biases (unlike PCA), and sheer improbability of including very dissimilar patches in the 1024-item comparison list (unlike the random method).
The demonstrated technique could conceivably allow segmentation of brains with substantial pathology, or allow rapid generation of whole-brain atlases. In the latter case, only a very small area of segmentation would be required to segment a larger area. By alternating with small amounts of manual correction, a voxel-perfect segmentation of the full brain could be generated with substantially less effort than would otherwise be required.
Acknowledgements
No acknowledgement found.References
1. Manjon J V, Coupe P. volBrain: an online MRI brain volumetry system. Front Neuroinform. 2016;10(30).
2. Sale M V, Reid LB, Cocchi L, Pagnozzi AM, Rose SE, Mattingley JB. Brain changes following four weeks of unimanual motor training: Evidence from behavior, neural stimulation, cortical thickness, and functional MRI. Hum Brain Mapp. 2017 Sep 5;38(9):4773–87.
3. Wachinger C, Reuter M, Klein T. DeepNAT: Deep convolutional neural network for segmenting neuroanatomy. Neuroimage. 2017 Feb 20;(February):1–12.
Figures