0692
Comprehensive 3D flow characterization in patients with Dilated Cardiomyopathy from 4D flow MRI data using a finite element method and 17-Segment BullseyesPamela Alejandra Franco1,2, Julio Sotelo1,2, Bram Ruijsink33, David Nordsletten3, Eric Kerfoot3, Joaquín Mura4, Daniel Hurtado5, and Sergio Uribe2,6
1Department of Electrical Engineering, Pontificia Universidad Católica de Chile, Santiago, Chile, 2Biomedical Imaging Center, Pontificia Universidad Católica de Chile, Santiago, Chile, 3Department of Biomedical Engineering, King's College London, London, United Kingdom, 4Pontificia Universidad Católica de Chile, Santiago, Chile, 5Department of Structural and Geotechnical Engineering, Pontificia Universidad Católica de Chile, Santiago, Chile, 6Department of Radiology, School of Medicine, Pontificia Universidad Católica de Chile, Santiago, Chile
Synopsis
Dilated Cardiomyopathy (DCM) is a disease of the heart muscle characterized by the enlargement of the left ventricle and systolic/ diastolic dysfunction. Cardiac Magnetic resonance (CMR) is the gold standard to measure cardiac function using b-SSFP CINE images1. However, hemodynamic parameters within the ventricles have received less attention. In this work, we present a method that allows a comprehensive assessment of different flow parameters in the left ventricle of DCM patients using a finite element framework over 4D flow data sets.
Introduction
Dilated Cardiomyopathy (DCM) is a disease of the heart muscle characterized by the enlargement of the left ventricle and systolic/diastolic dysfunction. Cardiac Magnetic resonance (CMR) is the gold standard to measure cardiac function using b-SSFP CINE images1. 4D flow MRI had offered the opportunity to assess 3D blood flow characteristics but mainly applied to the great vessels for different cardiovascular conditions2,3. However, hemodynamic parameters within the ventricles4 have received less attention. In this work, we present a method that uses a finite element (FE) analysis applied to DCM patients, using 4D flow MRI, to perform a comprehensive assessment of different flow parameters in the left ventricle.Methods
The 4D flow MRI data of 9 healthy volunteers and 14 patients with DCM were acquired in a clinical MR Scanner of 1.5T (Philips Achieva, Best, The Netherlands). 3D balance multi-slice SSFP of short-axis were acquired with mean parameters: TR/TE= 2.8 ms/1.4 ms, FA= 60°, matrix size= 256x256, slice thickness= 8 mm. The 4D flow MRI data was acquired with mean parameters: FA= 6°, VENC= 165 cm/s, FOV= 277x360x157 mm3, cardiac phases = 24, number of slices = 53, matrix size= 142x105, slice thickness= 8 mm. Figure 1, shows the principal steps for the in-vivo processing. Data analysis include registration of 4D flow data with cine SSFP data and segmentation of the cine SSFP images. The segmentation and a FE analysis were performed using an in-house MATLAB library (version R2017a, MathWorks). We increased the number of short-axis images to obtain a smooth mesh. For this purpose, we used a cubic interpolation between slices, obtained a voxel size = 1.4x1.4x4.1 mm3. For the LV segmentation, we applied Otsu thresholding and manual correction to generate the LV mask. Subsequently, we generated a tetrahedral mesh using the iso2mesh MATLAB toolbox. Once the mesh is constructed, we compute the velocity vector at each node of the mesh from the 4D flow MRI datasets by using a cubic interpolation. 3D maps of vorticity, helicity density, relative helicity density, viscous dissipation, energy loss and kinetic energy fields were calculated using the Python software. Finally, LV mesh and results were divided into 17 parcellations (AHA) using ParaView (version 5.3.0, Kitware Inc.). MATLAB was used to perform the different bullseyes of the mean parameters measures, during systole and diastole in each group of subjects. The statistical analysis for comparing quantitative variables between volunteer and patients was performed using a Mann-Whitney U Test.Results
Table 1 shows the clinical data of DCM patients and volunteers. Statistical differences were found in LV stroke volume, LV end-diastolic volume, and LV end-systolic volume. Figure 2 shows the visualization of some hemodynamic parameters, as the vorticity, helicity and viscous dissipation, at diastole and systole, for one representative patient and volunteer. Table 2 summarizes the percentage change in mean parameters measured between volunteers and patients, at systole and diastole. Bullseyes maps of the hemodynamics parameters at systole and diastole are shown in figure 3. Statistical differences at diastole of hemodynamics parameters were found in basal and mid-cavity in vorticity, helicity density, energy loss and kinetic energy. Also, velocity shows more statistical differences in basal LCX. Similar behavior has been observed for viscous dissipation and relativity helicity density in basal LAD.Conclusions
We have characterized the hemodynamic of the LV of DCM patients using the Bullseyes and a FE technique. This approach allows the estimation of vorticity, helicity density, relativity density, viscous dissipation, energy loss and kinetic energy field from 4D flow MRI. When the methodology is applied to DCM patients, we found that the vorticity, helicity density, energy loss and kinetic energy reveal statistical differences between volunteers and patients, particularly during diastole in basal and mid-cavity. Also, velocity shows more statistical difference indicators in basal LCX. Similar behavior has been observed for viscous dissipation and relativity helicity density in basal LAD. In conclusion, we have shown that a comprehensive framework for the analysis of 4D MRI data is able to characterize flow patterns within the left ventricle, and shows to be a good predictor for the DCM disease.Acknowledgements
We thanks to CONICYT – PIA – Anillo ACT1416, CONICYT FONDEF/I Concurso IDeA en dos etapas ID15|10284, and FONDECYT #1141036 grants. Sotelo J. thanks to the School of Engineering, Pontificia Universidad Católica de Chile, for his Post-Doctoral Fellow.References
- Hershberger RE and Morales A. Dilated Cardiomyopathy Overview. 2007.
- Sotelo J et al Mgn Reson Med 2017.
- Sotelo J. et al. Proc 24th Annual Meeting ISMRM 2016.
- Macdonald J. et al. Proc 25th Annual Meeting ISMRM 2017.
Figures

Figure 1. Schematic depiction of the steps in the proposed in-vivo
analysis method.
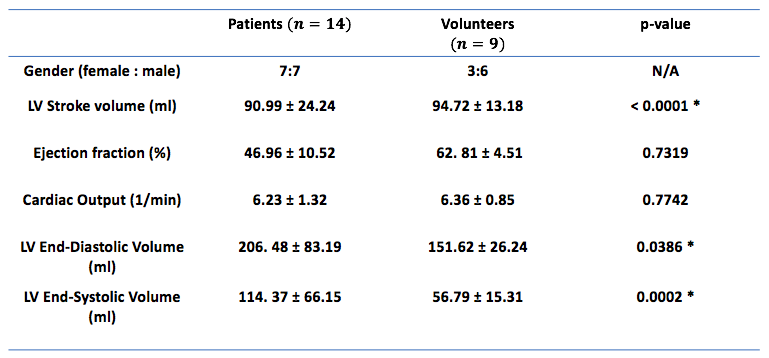
Table 1. Clinical data for DCM patients and healthy
volunteers. With *p < 0.05 considered statistically statistically
significant (t-Test).
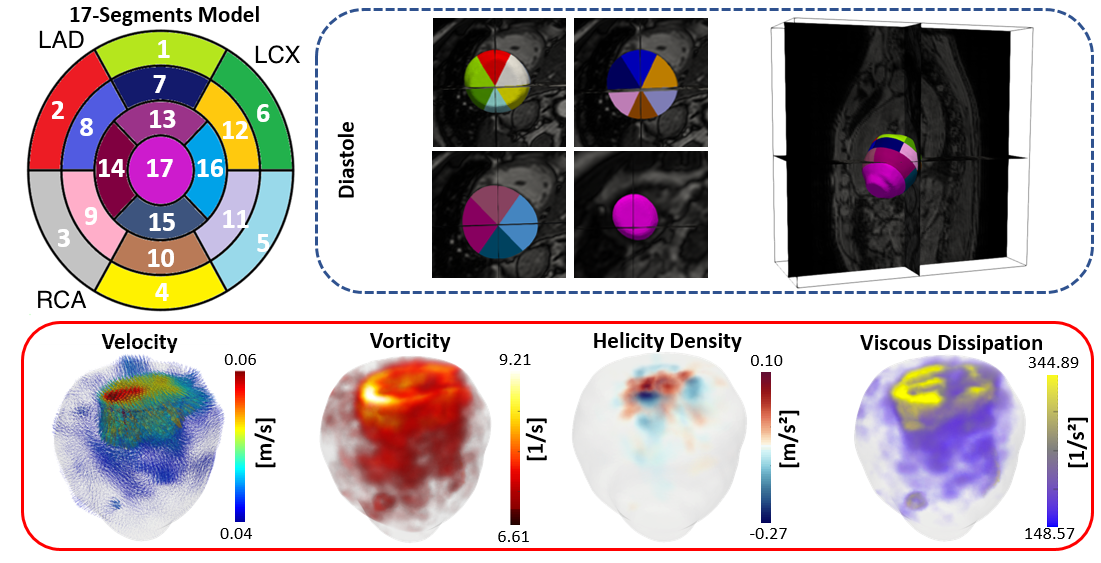
Figure 2. Regional partitioning of the LV for one representative patient, including velocity, vorticity, helicity density and viscous dissipation during diastole. We adjusted the colorbar range for visualization purposes. With: Left Anterior Descending (LAD), Right Coronary Artery (RCA) and Left Circumflex (LCX).
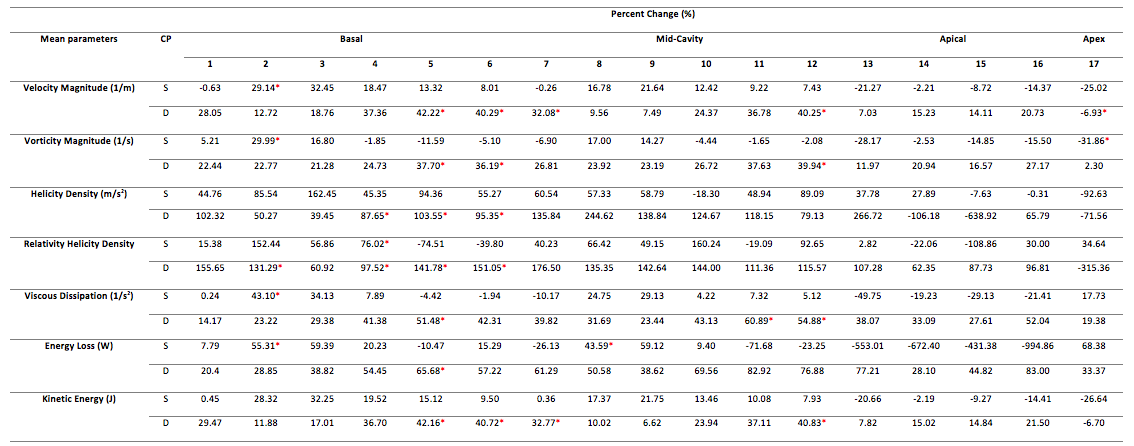
Table 2. Percentage change of mean parameters values between
volunteers and patients in the basal, mid-cavity, apical and apex segments of
the LV, during systole and diastole. Where * is p<0.05 considered statistically significant, cardiac phases, systole and diastole.
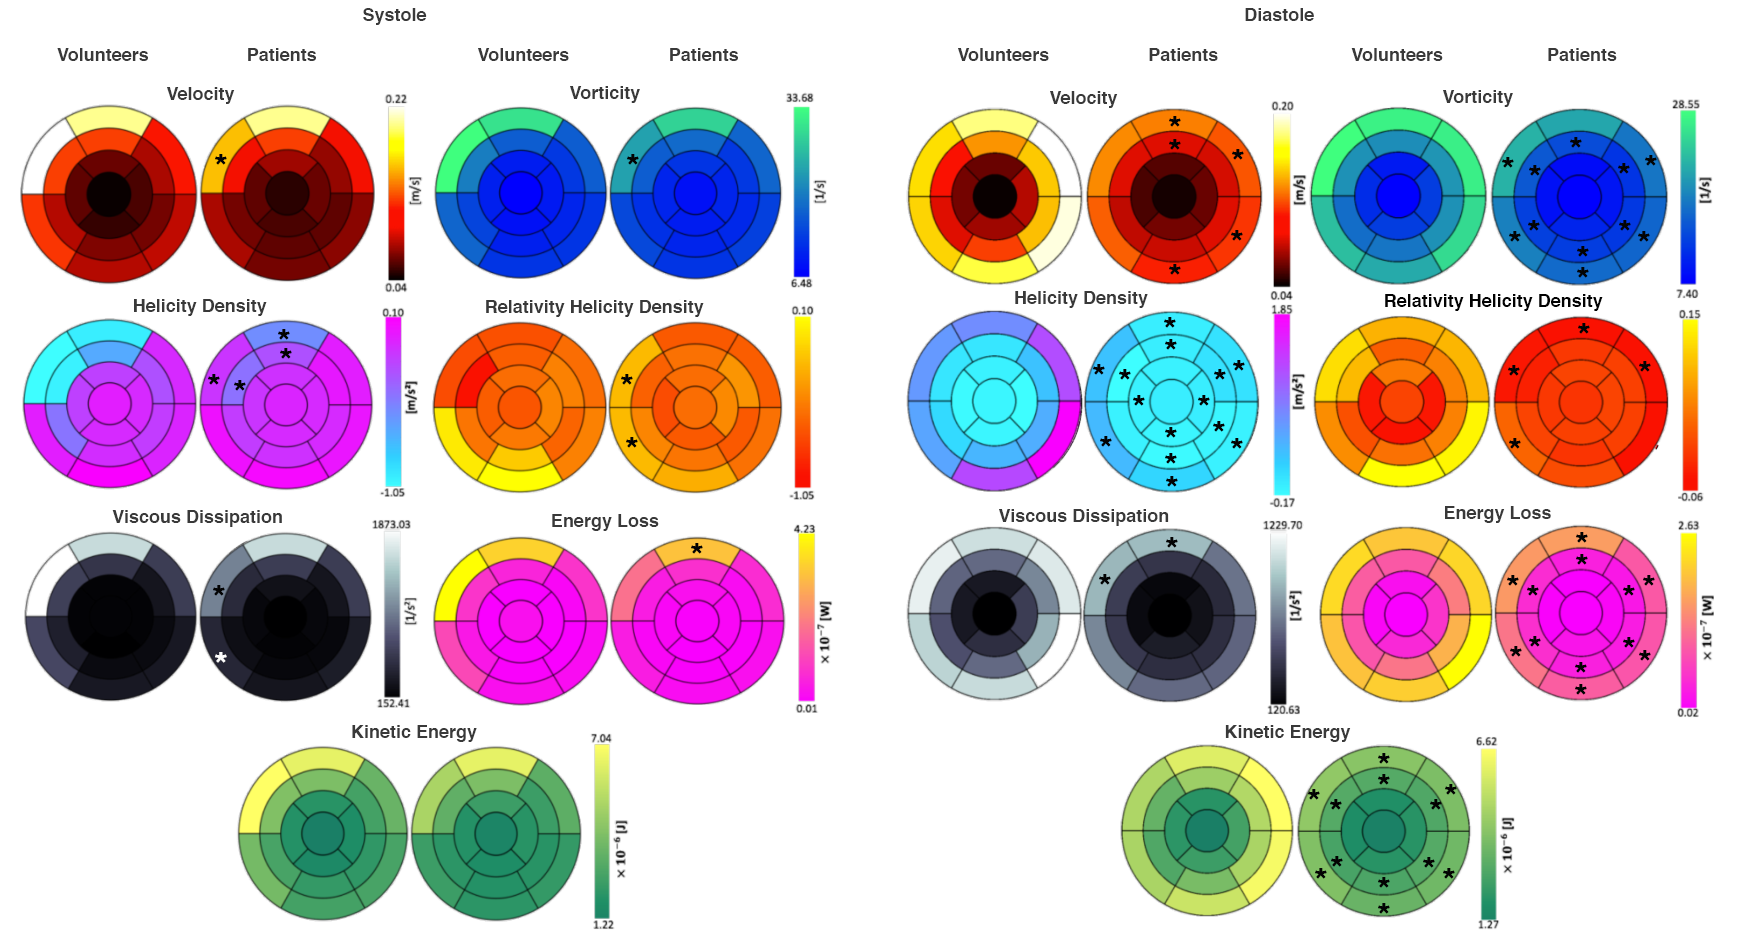
Figure 3. Bullseye maps of mean hemodynamic parameters,
across 17 segments for volunteers and patients at systole and diastole. With * p
< 0.05 considered statistically significant (U-Test).