0690
Hemodynamic Assessment of the Post-Myocardial Infarction Left Ventricle with 4D Flow MRI1Medical Physics, University of Wisconsin-Madison, Madison, WI, United States, 2Medicine, University of Wisconsin-Madison, Madison, WI, United States, 3Medicine, Weill Cornell Medical College, New York, NY, United States, 4Radiology, Weill Cornell Medical College, New York, NY, United States, 5Radiology, University of Wisconsin-Madison, Madison, WI, United States
Synopsis
This work employed high resolution time resolved (4D) flow cardiac MRI (CMR) to characterize altered left ventricular (LV) flow physiology after anterior myocardial infarction (MI). 4D Flow CMR was used to quantify LV velocity (parallel to the LV long axis) at pre-specified landmarks in the basal, mid, and apical LV. Post-MI patients with impaired global LV function had reduced peak systolic velocity in all regions compared to age-matched controls (p<0.05). A difference in flow patterns between the LV base and apex was also discerned in post-MI patients, characterized by a marked reduction and prolongation of forward flow in the apex.
INTRODUCTION
Impaired left ventricular (LV) function after acute myocardial infarction (MI) has been linked to adverse outcomes and devastating sequelae, including LV thrombus (LVT) – a known substrate for stroke. Both anterior MI location and low ejection fraction (EF) generally increase risk for LVT, but established predictors of LVT are known to be limited and mechanistic reasons for augmented LVT risk after anterior MI, as well as typical localization of LVT to the LV apex are not well understood. Recent 4D Flow cardiac MRI (CMR) work demonstrated increased LV residual volumes and reduced kinetic power among unselected patients with LV dysfunction1, supporting the feasibility of 4D Flow CMR for the study of MI-induced alterations in LV flow physiology. This work employed 4D Flow CMR to elucidate the magnitude and pattern of altered LV flow hemodynamics after anterior MI.METHODS
MRI: Eighteen Subjects (9 anterior MI patients, 9 age-matched normative controls) underwent CMR (cine bSSFP, 4D Flow). MI patients were partitioned based on LVEF—reduced EF (rEF<55%, n=6) and preserved EF (pEF>55%, n=3). Flow data was acquired with a 3D radially undersampled trajectory (PC VIPR2) (field strength=1.5-3T, TR/TE=5.8-8.4/2.0-2.5ms, FOV=32x32x20cm3, acquired spatial resolution=1.25mm isotropic, 20 cardiac frames, scan time=10-14min, VENC=100-150cm/s). Short axis bSSFP images had an in-plane resolution of 1.25x1.25mm2 and a slice thickness of 8mm.
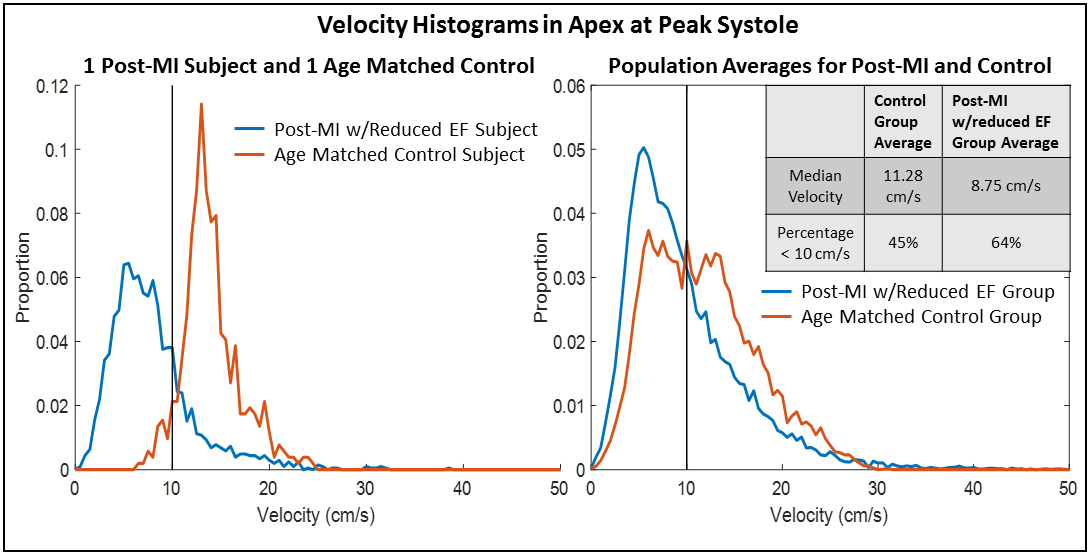
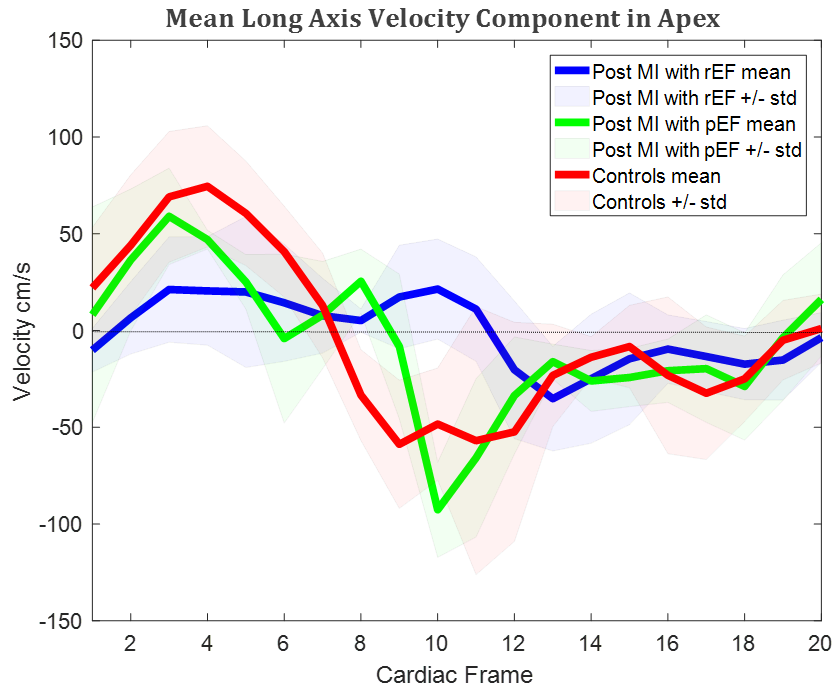
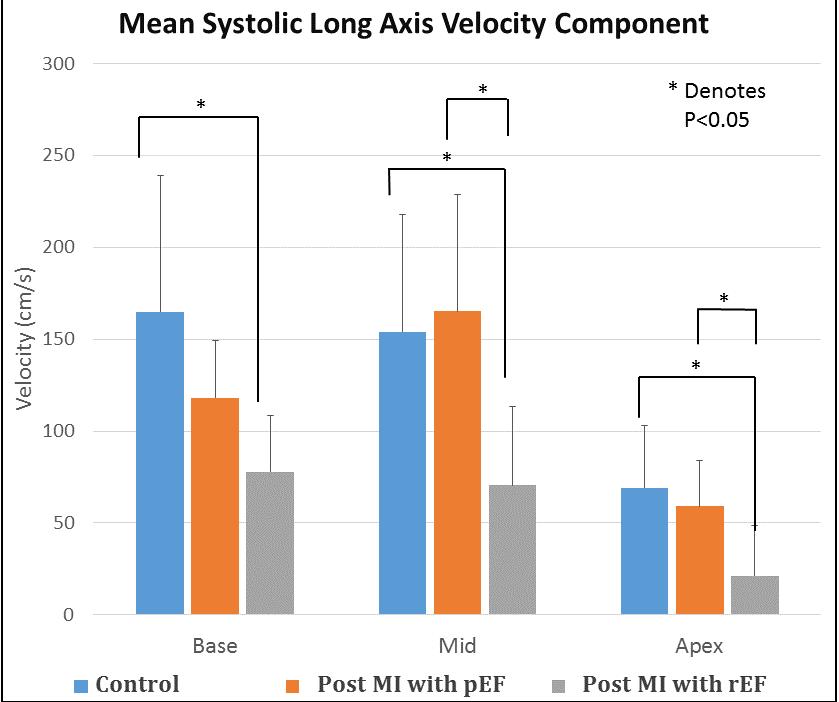
Analysis: Time-resolved LV segmentations were produced from semi-automatically contouring short axis bSSFP images using Segment (http://segment.heiberg.se, v2.0 R5399)3 and co-localized to 4D Flow data using a custom-built Matlab tool that enables manual correction for movement between scans and misalignment between short-axis slices acquired during different breath holds. LV volumes were divided into equal-length base, mid, and apex regions along the LV long axis. Given the fact that LV thrombus typically localizes to the LV apex, velocity histograms4 in the apex at peak systole were computed for all subjects and for group averages to assess median blood velocity and percentage of voxels below 10 cm/s. In addition, the mean velocity component parallel to the LV long axis was computed at pre-specified landmarks (base, mid, and apex) throughout the cardiac cycle to quantify regional blood inflow and outflow. Mean long-axis velocity at peak systole was compared in the base, mid, and apex between post-MI patients and controls using two-tailed t-tests (significance level=0.05).
RESULTS
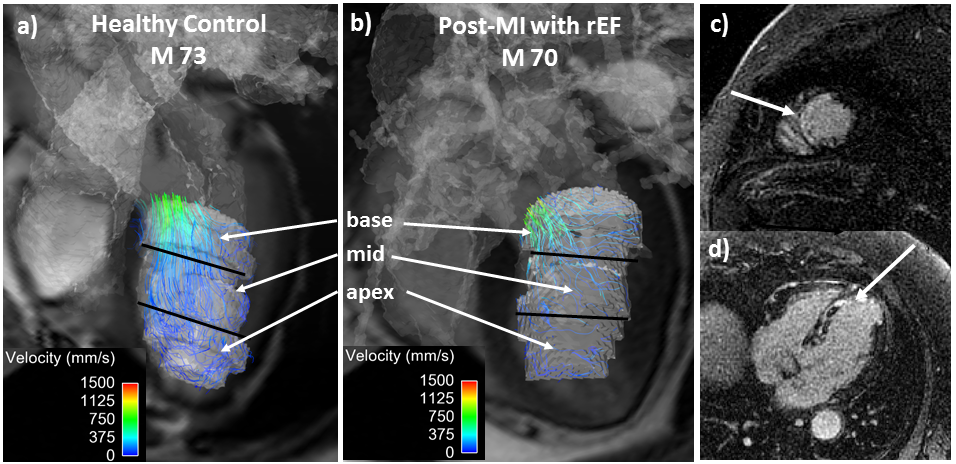
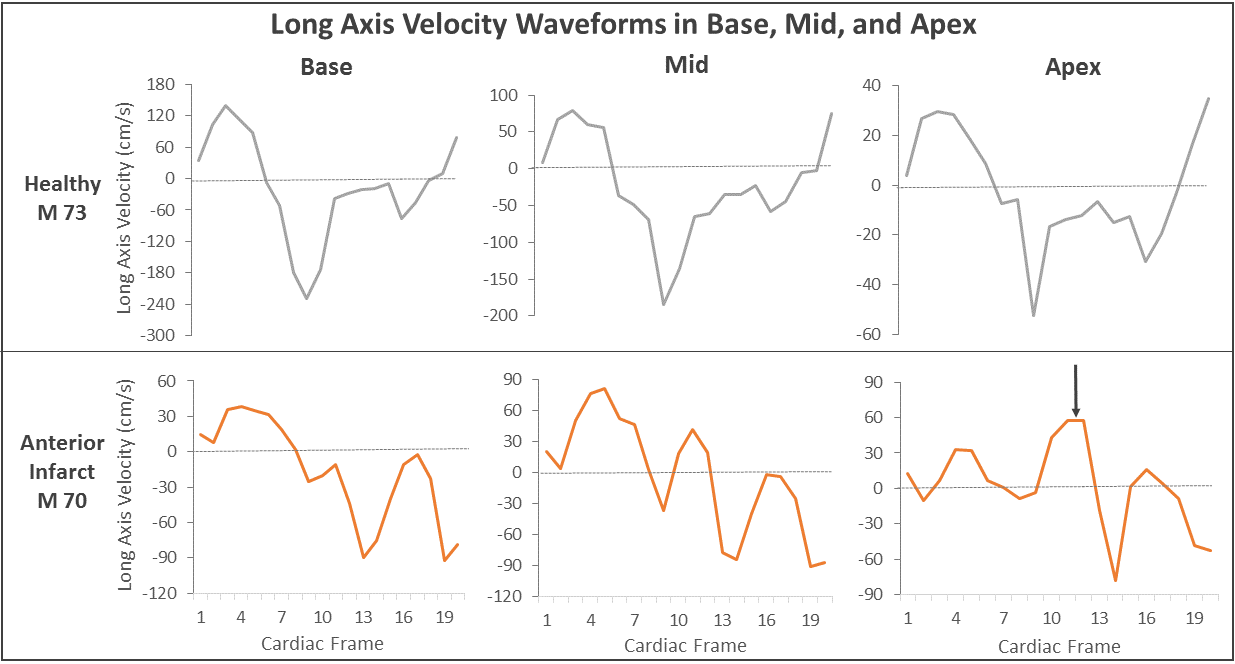
Figure 1 shows co-localization of the LV mask and 4 chamber bSSFP slice to 4D Flow data in a control (a) and apical MI patient (b-d). Figure 2 shows velocity histograms in the LV apex at peak systole from two individual cases (left) and from group averages (right). Median velocity was lower and flow stasis (% voxels < 10 cm/s) was greater in the post-MI with rEF group than in controls, but differences were not statistically significant (P=.18, P=.20, respectively). Figure 3 shows long-axis velocity waveforms in the apex averaged among each group. Figure 4 shows the mean long-axis component of the velocity at peak systole in the base, mid, and apex regions for each subject group. Post-MI with rEF patients had significantly lower long-axis velocity in all LV regions compared to age-matched controls, and lower velocity in the mid and apex LV regions compared to post-MI patients with pEF (P<0.05). Figure 5 shows the long-axis velocity waveforms for a control and a post-MI patient with rEF patient in the three LV regions.DISCUSSION
4D CMR LV flow characterization identified altered flow physiology in post-MI with rEF patients; flow impairments were most prominent in the LV apex–a region in which thrombus is known to localize. Streamline visualizations revealed decreased flow coherence between the apex and base at systole after MI, resulting in reduced velocity parallel to the LV long axis. Long-axis velocity waveforms varied between the base and apex in MI patients with rEF, while controls generally had similar waveform shapes in all LV regions. There was a shift towards lower velocities in the apices in post-MI rEF subjects compared to controls, but with significant intragroup heterogeneity in velocity histograms.CONCLUSION
This pilot study demonstrates a workflow for time-resolved
LV segmentation of 4D Flow CMR data for regional LV flow analysis. 4D Flow MRI
can detect regional LV flow alterations after MI, as well as differences
between MI patients with rEF and pEF. Substantial heterogeneity among post-MI
subjects supports the notion that flow physiology can vary, even among patients
with rEF—a phenomenon that may be useful in identifying patients at highest
risk for LVT. Longitudinal studies are warranted to determine whether this hemodynamic
information can help predict LVT formation.Acknowledgements
The authors gratefully acknowledge GE Healthcare for research support.References
1. Stoll V, Hess A, Eriksson J, et al. Evaluation of patients with left ventricular thrombus using intra-cardiac blood visualisation with 4d flow. Heart 2017;103:A83-A84.
2. Johnson KM, Lum DP, Turski PA, Block WF, et al. Improved 3D phase contrast MRI with off-resonance corrected dual echo VIPR. MRM. 2008;60(6):1329-1336.
3. Tufvesson J, Hedstrom W, Steding-Ehrenborg K, et al. Validation and Development of a New Automatic Algorithm for Time-Resolved Segmentation of the Left Ventricle in Magnetic Resonance Imaging. Biomed Res Int. 2015:970357.
4. Fluckiger JU, Goldberger JJ, Lee DC, Ng J, et al. atrial flow velocity distribution and flow coherence using four-dimensional FLOW MRI: a pilot study investigating the impact of age and pre and post intervention atrial fibrillation on atrial hemodynamics. JMRI. 2013;38(3):580-587.
Figures