0685
PC-MRI with Phase Recovery from Multiple Wrapped Measurements (PRoM)1Electrical and Computer Engineering, The Ohio State University, Columbus, OH, United States, 2Cardiac MR R&D, Siemens Medical Solutions USA, Inc., Columbus, OH, United States, 3Richard M. Ross Heart Hospital, The Ohio State University, Columbus, OH, United States, 4Internal Medicine, The Ohio State University, Columbus, OH, United States, 5Biomedical Engineering, The Ohio State University, Columbus, OH, United States
Synopsis
In traditional phase-contrast MRI (PC-MRI), the strength of velocity encoding gradient (VENC) offers a tradeoff between the velocity-to-noise ratio (VNR) and the extent of phase wrapping. In contrast, dual-VENC (DV) acquisition achieves the VNR associated with lower of the two VENCs, with higher VENC measurement solely used to perform phase unwrapping1. Here, we demonstrate that the phase unwrapping can be more effective from two low-VENC measurements, where both VENC values are below the peak velocity. The proposed method, called Phase Recovery from Multiple wrapped measurements (PRoM), enables computationally simple yet near-optimal estimation of unwrapped phase (velocity) from multiple wrapped measurements.
Introduction
Phase contrast MRI (PC-MRI) is a quantitative technique that can non-invasively measure hemodynamics in vivo. The accuracy of PC-MRI is challenged by lower velocity-to-noise ratio (VNR). To address this issue, dual-VENC (DV) techniques have been proposed, where VNR is determined by the wrapped, low-VENC measurement and the unwrapping is guided by the high-VENC measurement. In contrast to using low- and high-VENC measurements, we propose a new method that jointly processes multiple low-VENC (wrapped) measurements, leading to high overall VNR and high success rate of unwrapping. The proposed method, PRoM, can benefit a wide range of PC-MRI applications, especially where quantification of both high and low velocities is of interest.Methods
Two pairwise differences of three noisy phase measurements can generate two possibly wrapped noisy velocities, $$$\widetilde{v}_1$$$ and $$$\widetilde{v}_2$$$. For correlated Gaussian noise, the maximum likelihood (ML) estimate, $$$\widehat{v}_{MLE}$$$, of the unwrapped velocity from $$$\widetilde{v}_1$$$ and $$$\widetilde{v}_2$$$ can be easily computed (detailed derivations omitted). The wrapped range of each measurement is $$$m_i=2VENC_i,i=1,2$$$, and the unambiguous unwrapped velocity range is $$$[-\frac{M}{2},\frac{M}{2})$$$, where $$$M$$$ is the least common multiple of $$$(m_1,m_2)$$$. The task is to detect the integer numbers, $$$k_1,k_2$$$, of $$$2\pi$$$ wraps in each in phase, $$$\frac{\widetilde{v}_i \pi}{VENC_i}$$$, to minimize the distances between $$$\widehat{v}_{MLE}$$$ and each $$$\widetilde{v}_i+k_im_i$$$ ; the weighted distances account for different VNRs, noise correlation, and the circular nature of angles. Perhaps surprisingly, the optimal pair of integer wrap values, $$$k_1^\star,k_2^\star$$$ can be found by simply indexing into a table of $$$(\frac{m_1+m_2}{m}+1)$$$ entries, using as index the rounded difference, $$$(\widetilde{v}_2-\widetilde{v}_1)/m$$$. Then, the ML velocity estimate $$$\widehat{v}_{MLE}$$$ is merely a scaled sum,
$$\widehat{v}_{MLE} = \left\langle \alpha (k_1^\star m_1+\widetilde{v}_1)+(1-\alpha)(k_2^\star m_2+\widetilde{v}_2)+\frac{M}{2} \right\rangle_M-M$$Here, $$$\langle \cdot \rangle$$$ denotes remainder modulo $$$M$$$, and the combining weights are derived from the noise covariance: with $$$\beta = \frac{VENC_2}{VENC_1}$$$, $$$\alpha = \frac{\beta(\beta-0.5)}{\beta^2-\beta+1}$$$.
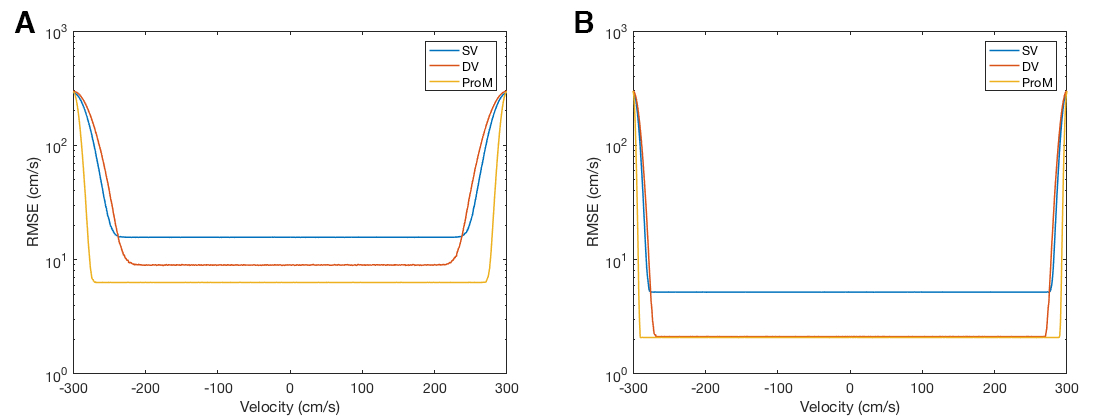
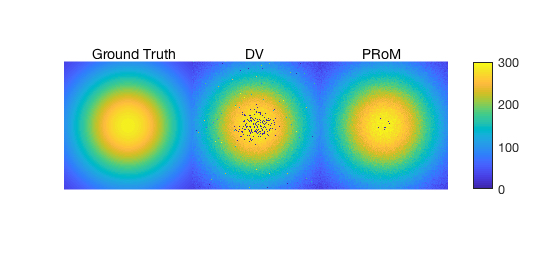
Simulation Study: We simulated 1,000,000 independent complex-valued measurements corresponding to gradient waveforms with these three first moments:$$$\frac{\gamma \pi}{200 cm/s}$$$,$$$\frac{\gamma \pi}{-200 cm/s}$$$, and $$$\frac{\gamma \pi}{600 cm/s}$$$, where $$$\gamma$$$ is the gyromagnetic ratio in appropriate units. The true velocity value was drawn from -300 to 300 cm/s range. By pairwise combining (angle after conjugate multiplication of complex numbers) these noisy measurements, we simulated effective phase measurements for SV (VENC: 300 cm/s), DV (VENCs: 100 cm/s and 300 cm/s), and PRoM (VENCs: 100 cm/s and 150 cm/s). In addition, for visualization, a digital phantom with the velocity profile defined by a bivariate Gaussian function was analyzed with DV and PRoM.
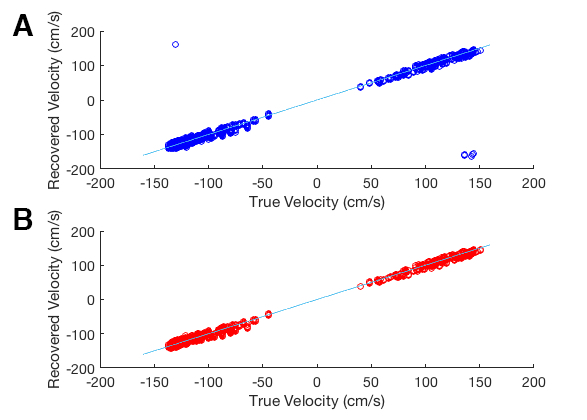
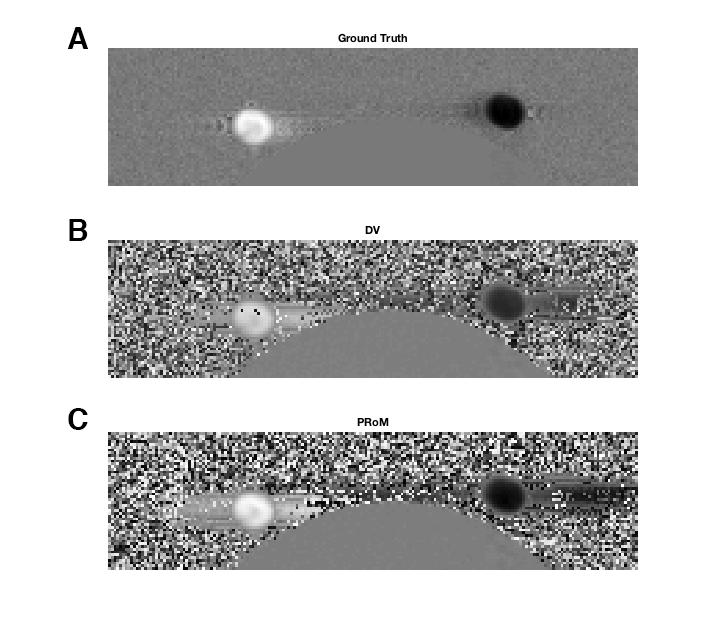
Phantom Study: PC-MRI was performed on a clinical 1.5T scanner (MAGNETOM Avanto, Siemens Healthcare, Erlangen, Germany) to image constant flow in a pipe connected to a flow pump (CardioFlow 5000 MR, Shelley Medical Imaging Technologies, Ontario, Canada). The imaging slice was selected such that it intersected with the pipe at two locations. A dual-VENC dataset was collected with first moments: $$$\frac{\gamma \pi}{100 cm/s}$$$, $$$\frac{\gamma \pi}{-100 cm/s}$$$, and $$$\frac{\gamma \pi}{300 cm/s}$$$. From pairwise phase differences, velocity measurements were generated for DV (VENCs: 50 cm/s and 150 cm/s) and PRoM (VENCs: 50 cm/s and 75 cm/s). The peak velocity was approximately 148 cm/s. For quantification, a high-SNR (200 averages) SV dataset was collected with VENC set at 150 cm/s.
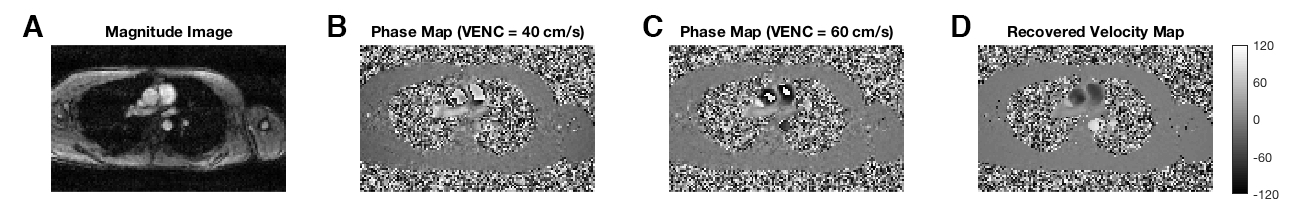
In Vivo Study: A single dataset was collected from a healthy volunteer with first moments: $$$\frac{\gamma \pi}{80 cm/s}$$$, $$$\frac{\gamma \pi}{-80 cm/s}$$$, and $$$\frac{\gamma \pi}{240 cm/s}$$$. These measurements were combined to generate two wrapped measurements with VENC values of 40 cm/s and 60 cm/s. PRoM was applied to recover an unwrapped velocity map from the two wrapped measurements.
Results and Discussion
Figure 1 shows simulation results. At low SNR, PRoM exhibits lower RMSE and outperforms both DV and SV. At high SNR, the performance of PRoM is superior only when velocity values are close to the edges of the pre-specified velocity range. Figure 2 provides a visual comparison of DV and PRoM, with DV leading to a much larger number of unwrapped pixels. Figure 3 compares performance of DV and PRoM for data from mechanical phantom. Each entry on the scatter plot represents a pixel within the pipe. The velocity values recovered by PRoM were in good agreement with the true velocity values. Also, in contrast to DV, PRoM was able to successfully unwrap all pixels. Figure 4 shows one frame from reference, DV, and PRoM images. Figure 5 demonstrates the feasibility of PRoM in vivo.Conclusions
Counter to the accepted practice of collecting high- and low-VENC measurements, we have proposed a method that can jointly process dual low-VENC (wrapped) measurements to estimate the true unwrapped phase. In future, we will validate this technique in larger groups of volunteers and patients.Acknowledgements
This work was partially funded by NIH grants R01HL135489 and R21EB022277.References
- Lee, A. T., Bruce Pike, G., & Pelc, N. J. (1995). Three‐Point Phase‐Contrast Velocity Measurements with Increased Velocity‐to‐Noise Ratio. Magnetic Resonance in Medicine, 33(1), 122-126.
Figures