0683
Comprenhensive analysis of Hemodynamics parameters in patients with bicuspid aortic valve using 4D flow data and a finite element method.1Biomedical Imaging Center, Pontificia Universidad Católica de Chile, Santiago, Chile, 2Department of Electrical Engineering, Pontificia Universidad Católica de Chile, Santiago, Chile, 3Department of Cardiology, Hospital Universitari Vall d´Hebron, Vall d´Hebron Institut de Recerca (VHIR), Universitat Autònoma de Barcelona, Barcelona, Spain, 4Institute for Biological and Medical Engineering, Schools of Engineering, Medicine and Biological Sciences, Pontificia Universidad Católica de Chile, Santiago, Chile, 5Department of Structural and Geotechnical Engineering, Pontificia Universidad Católica de Chile, Santiago, Chile, 6Department of Radiology, School of Medicine, Pontificia Universidad Católica de Chile, Santiago, Chile
Synopsis
Bicuspid aortic valve (BAV) is the most common congenital cardiac defect. Current criteria to support surgical decision in BAV patients has been recently questioned, which motivates the development of better biomarkers to assess the disease stage of development. In this work, we extensively analyze several hemodynamics parameters in volunteers and BAV patients from 4D flow MRI using a finite-element-based quantification framework. We found that the backward velocity fraction, the circumferential WSS, and turbulence parameters, can be used together with the diameters of the vessel as a new risk marker, as it can strongly discriminate subjects from BAV patients.
Introduction
Bicuspid aortic valve (BAV) is the most common congenital cardiac defect1,2. Early diagnosis of BAV may reduce the long-term risk of cardiovascular events3,4. Until now, it is not clear the appropriated time to perform surgery to BAV patients. The standard metric used to plan the surgery, which is the aortic diameter, has been changed three times in the last 20 years5. Such uncertain criteria for surgery motivates the development of more predictive aortic risk markers that can bring consistent guidelines to treat patient with BAV. Recent studies have found that BAV patients exhibit altered blood flow in the ascending aorta as outflow jet, helix and vortex flow6-9. These hemodynamic alterations may lead to changes in hemodynamics parameters (HP) as wall shear stress (WSS), oscillatory shear index (OSI), vorticity, helicity density, viscous dissipation, energy loss and kinetic energy6-13.However, only a few combinations of these parameters have been applied in the same cohort of patients12,13. The objective of this work is to show the applicability of a recently proposed method to obtain all these parameters in BAV patients using a single methodology, which is based on the analysis of 4D-flow data using a finite element method.Methods
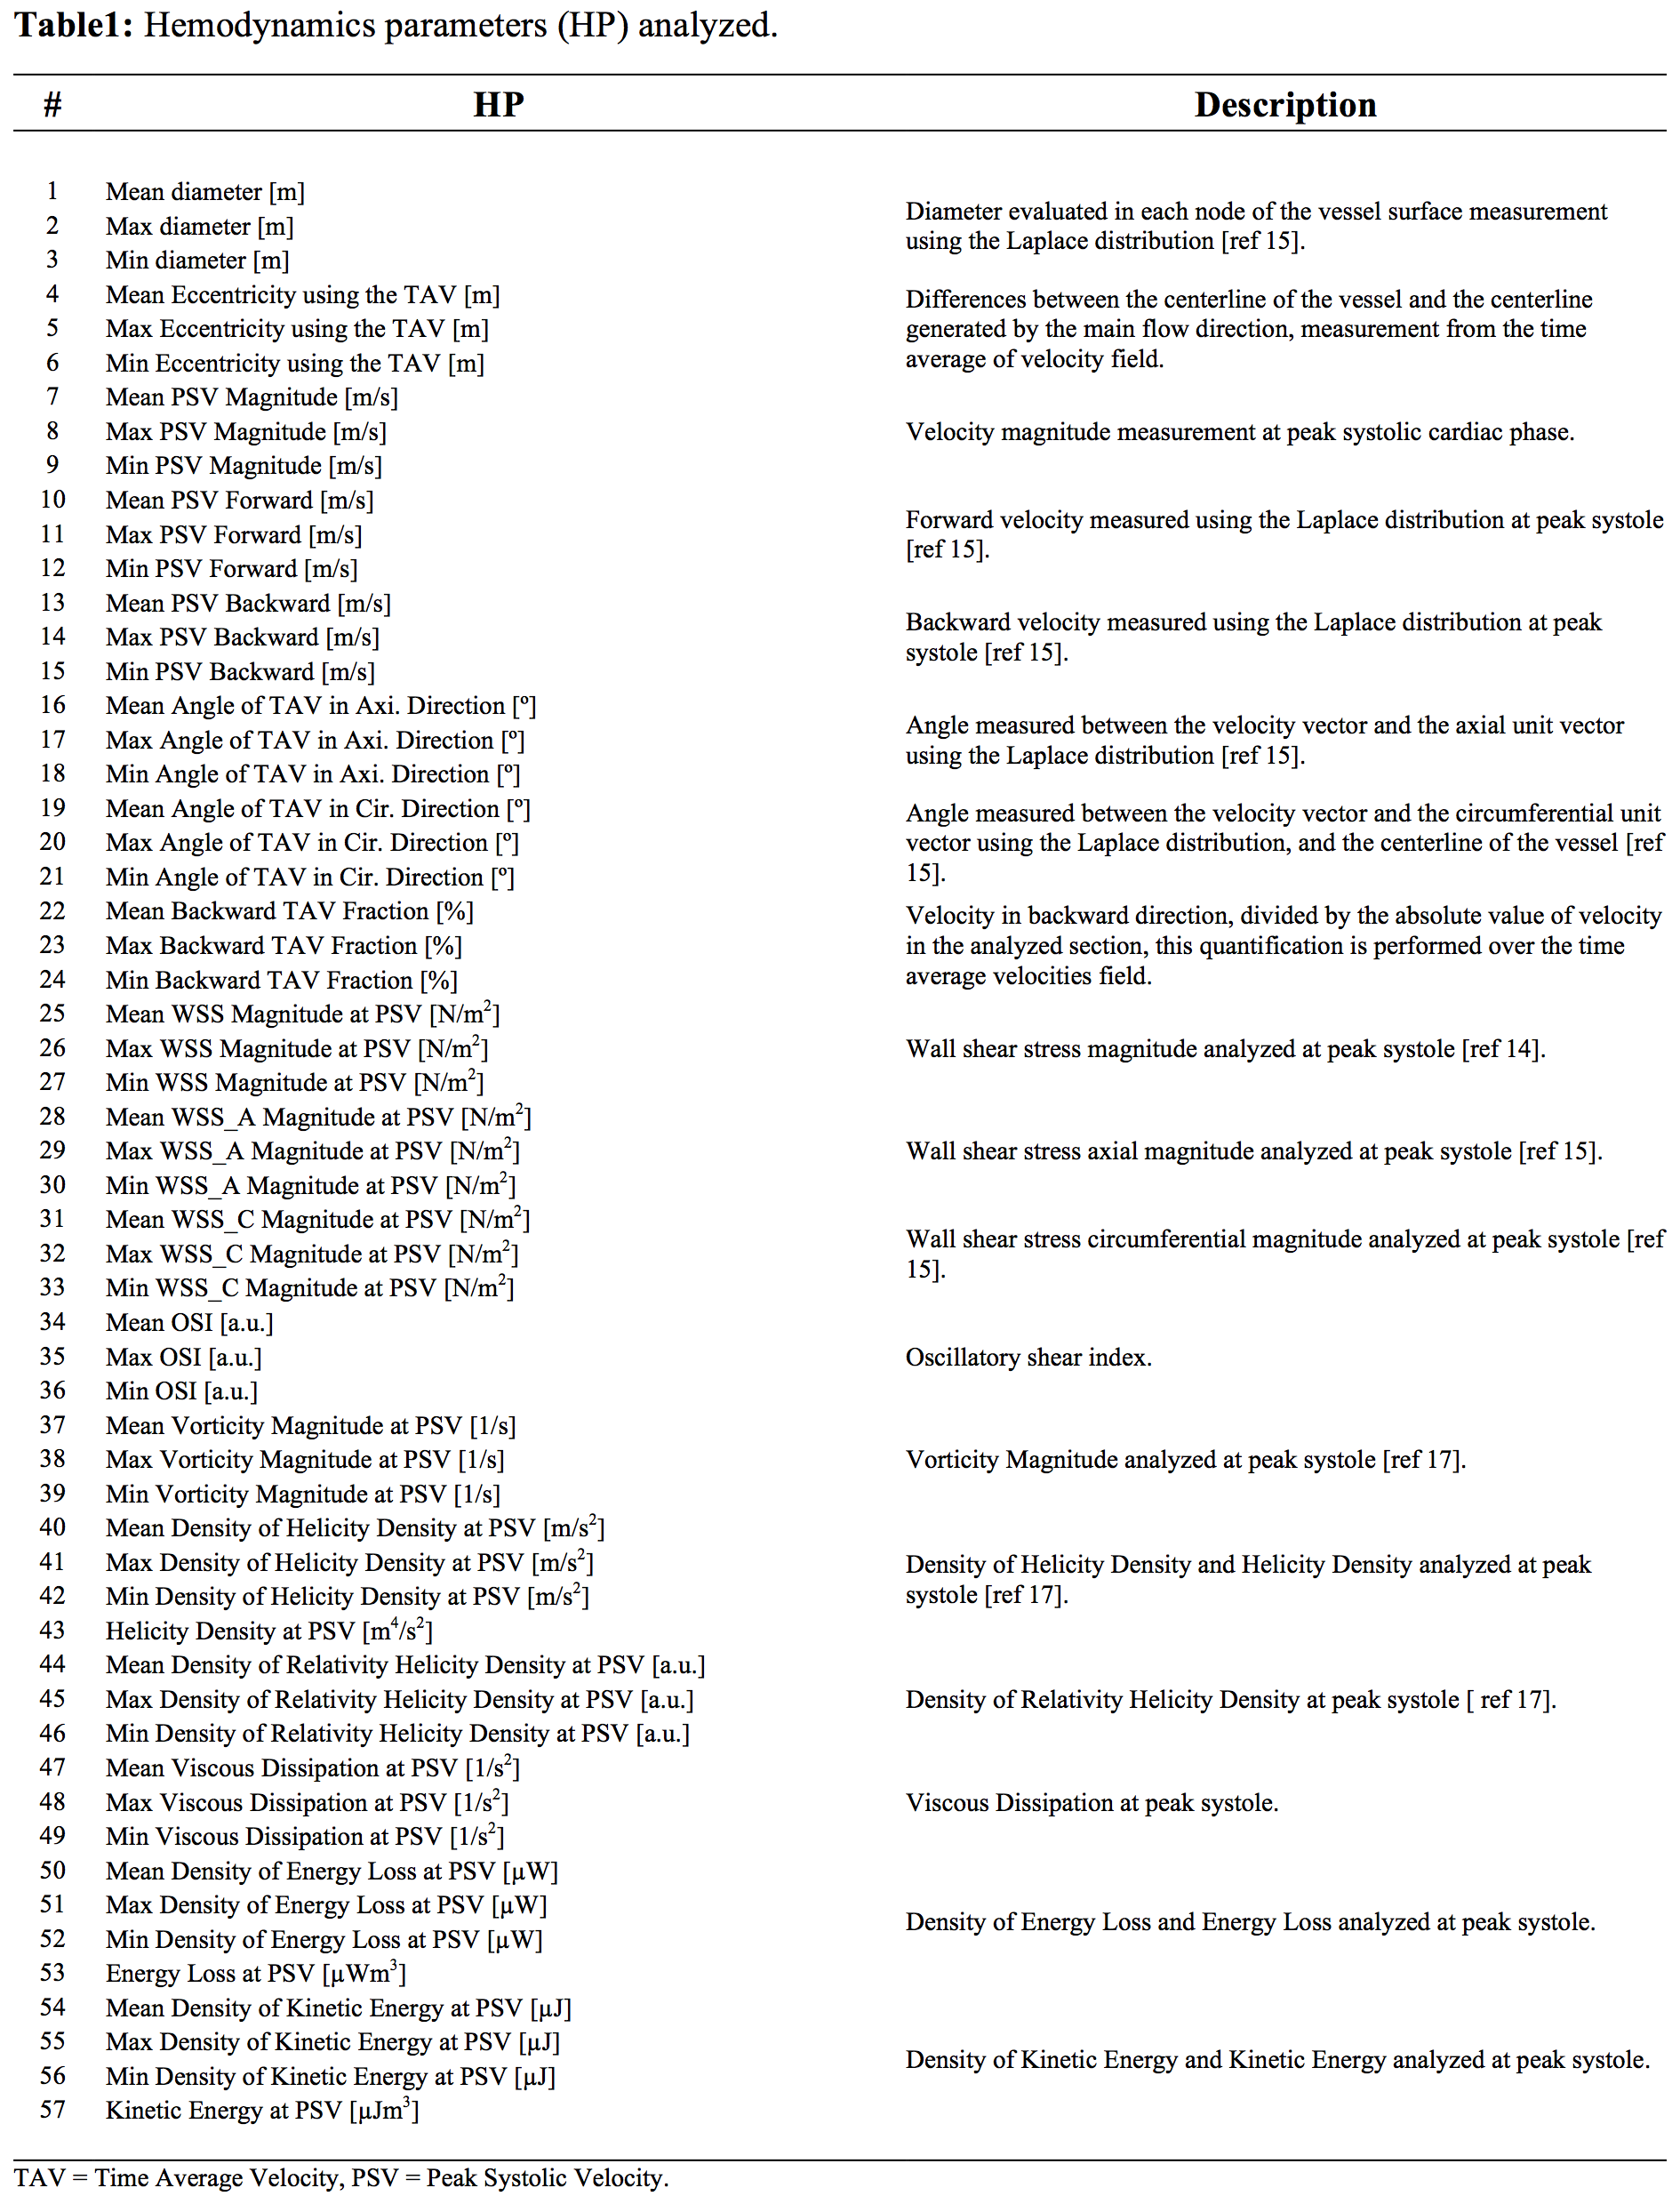
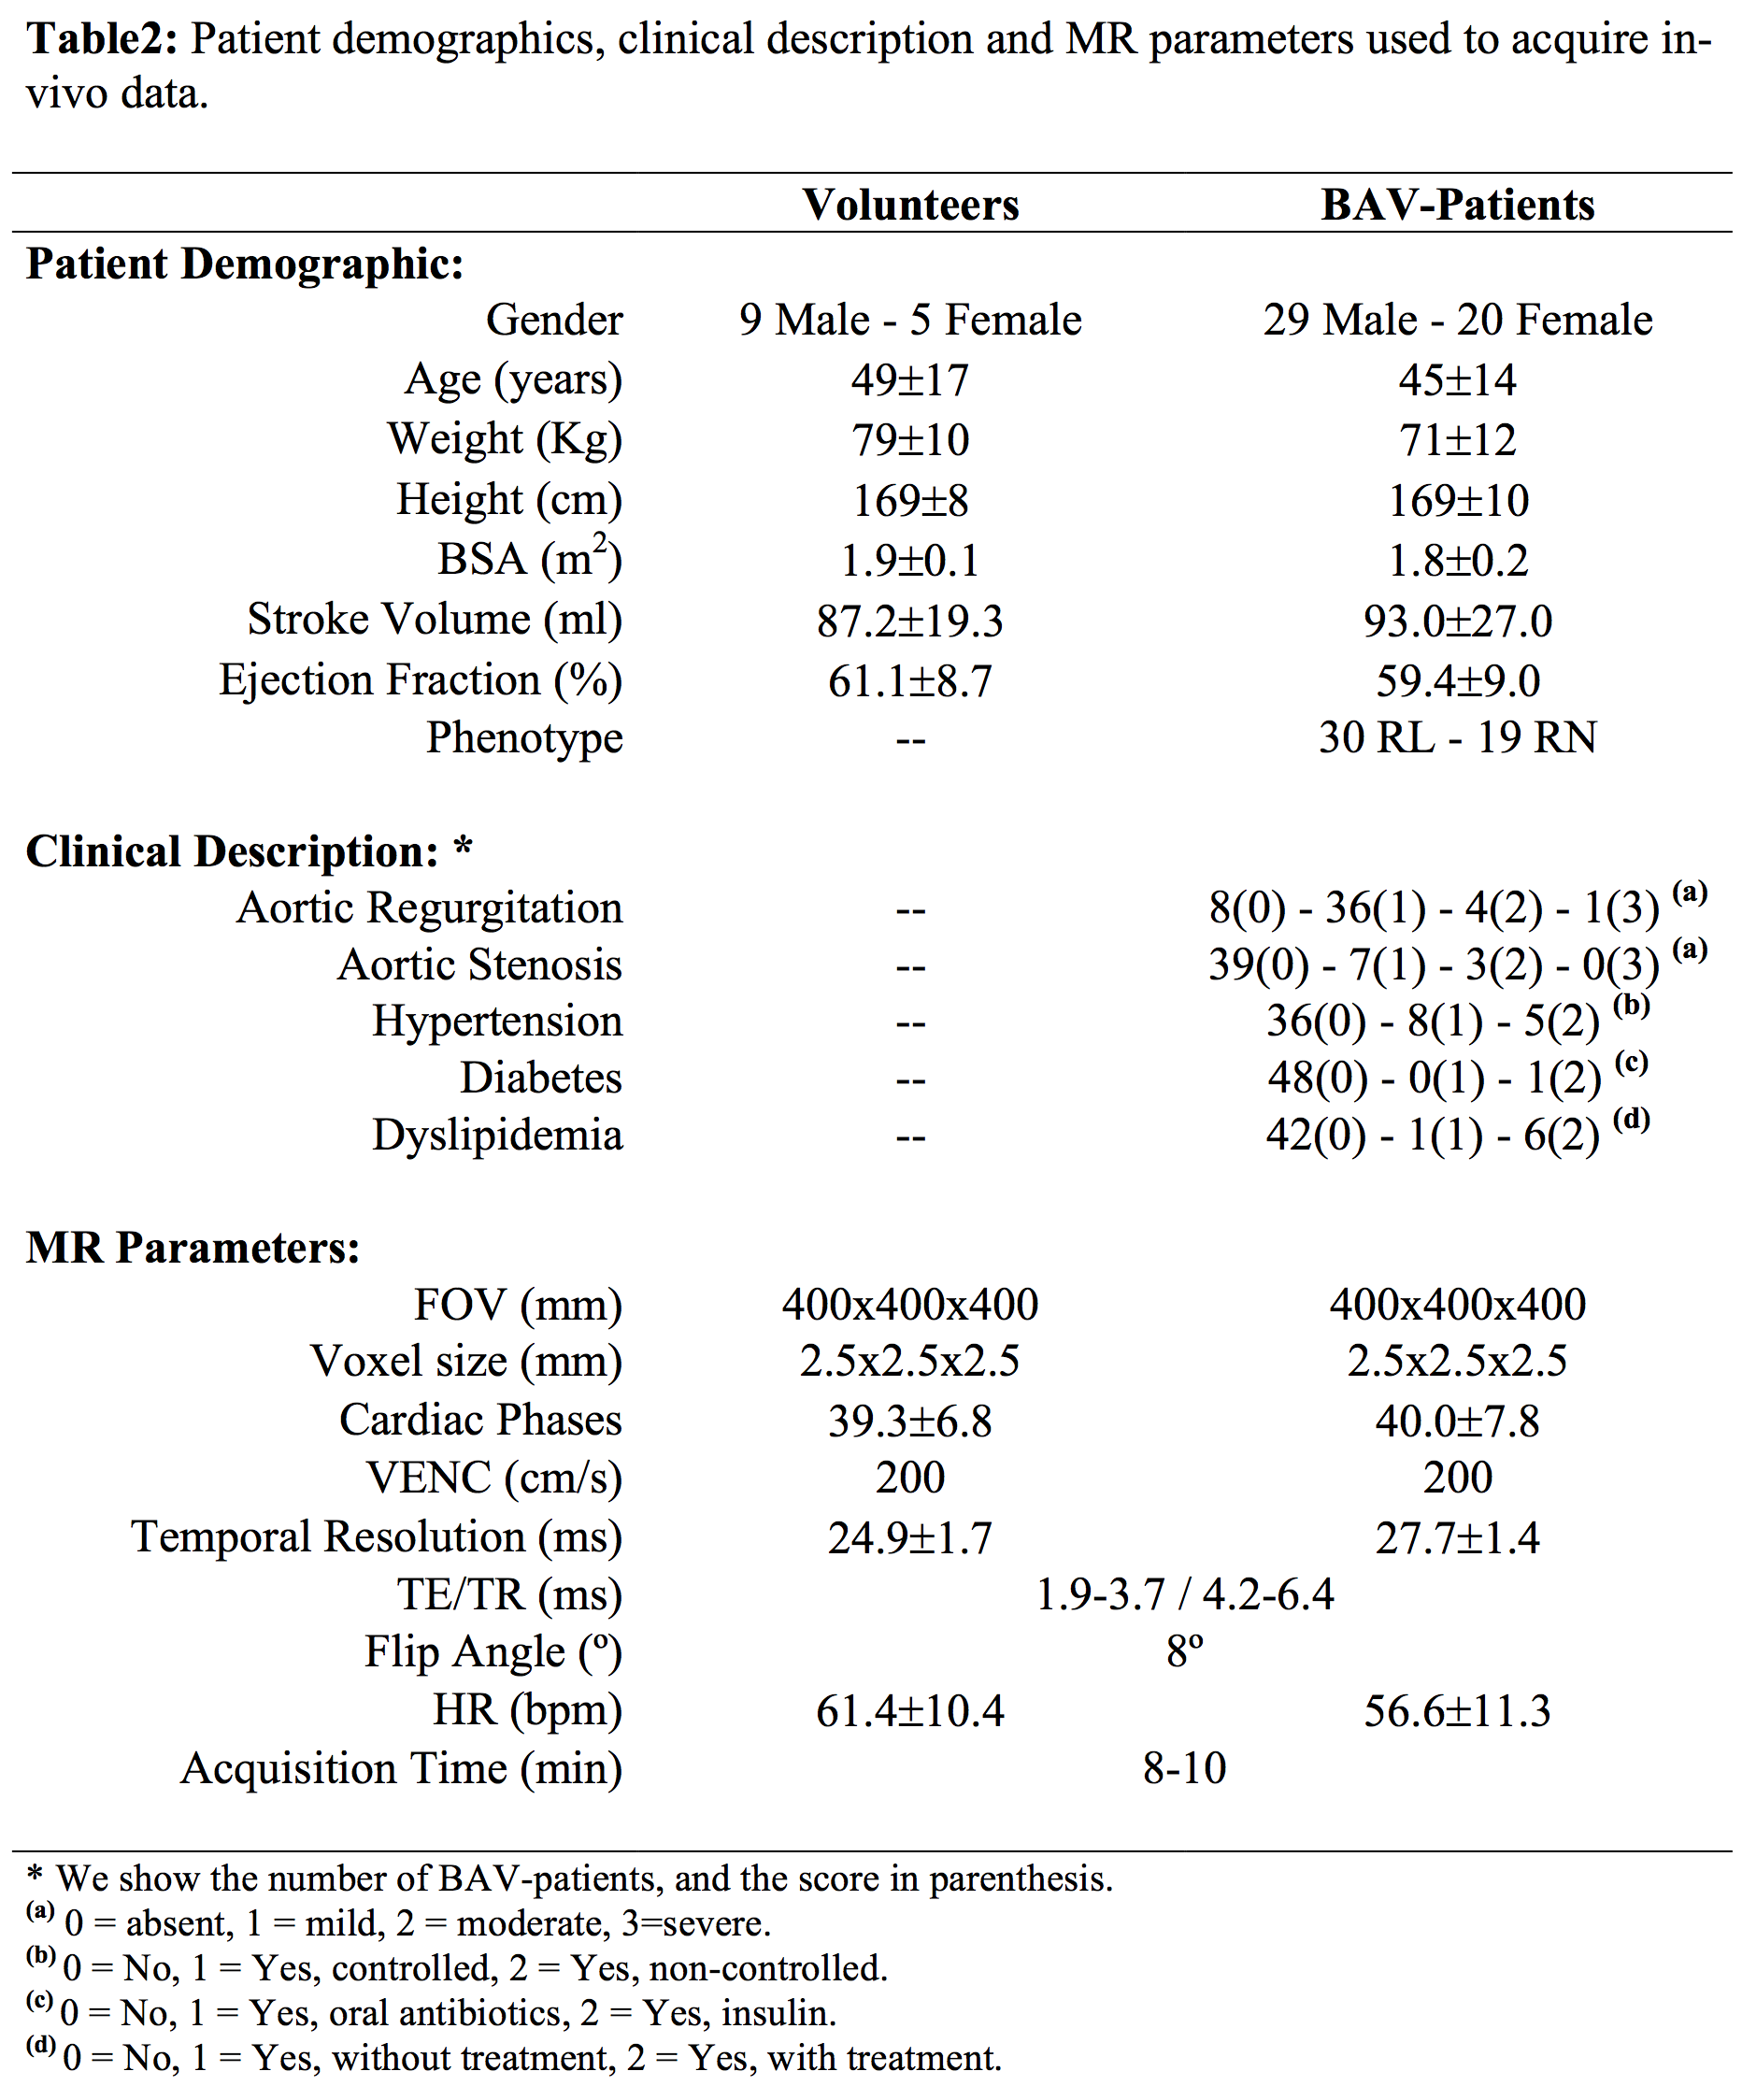
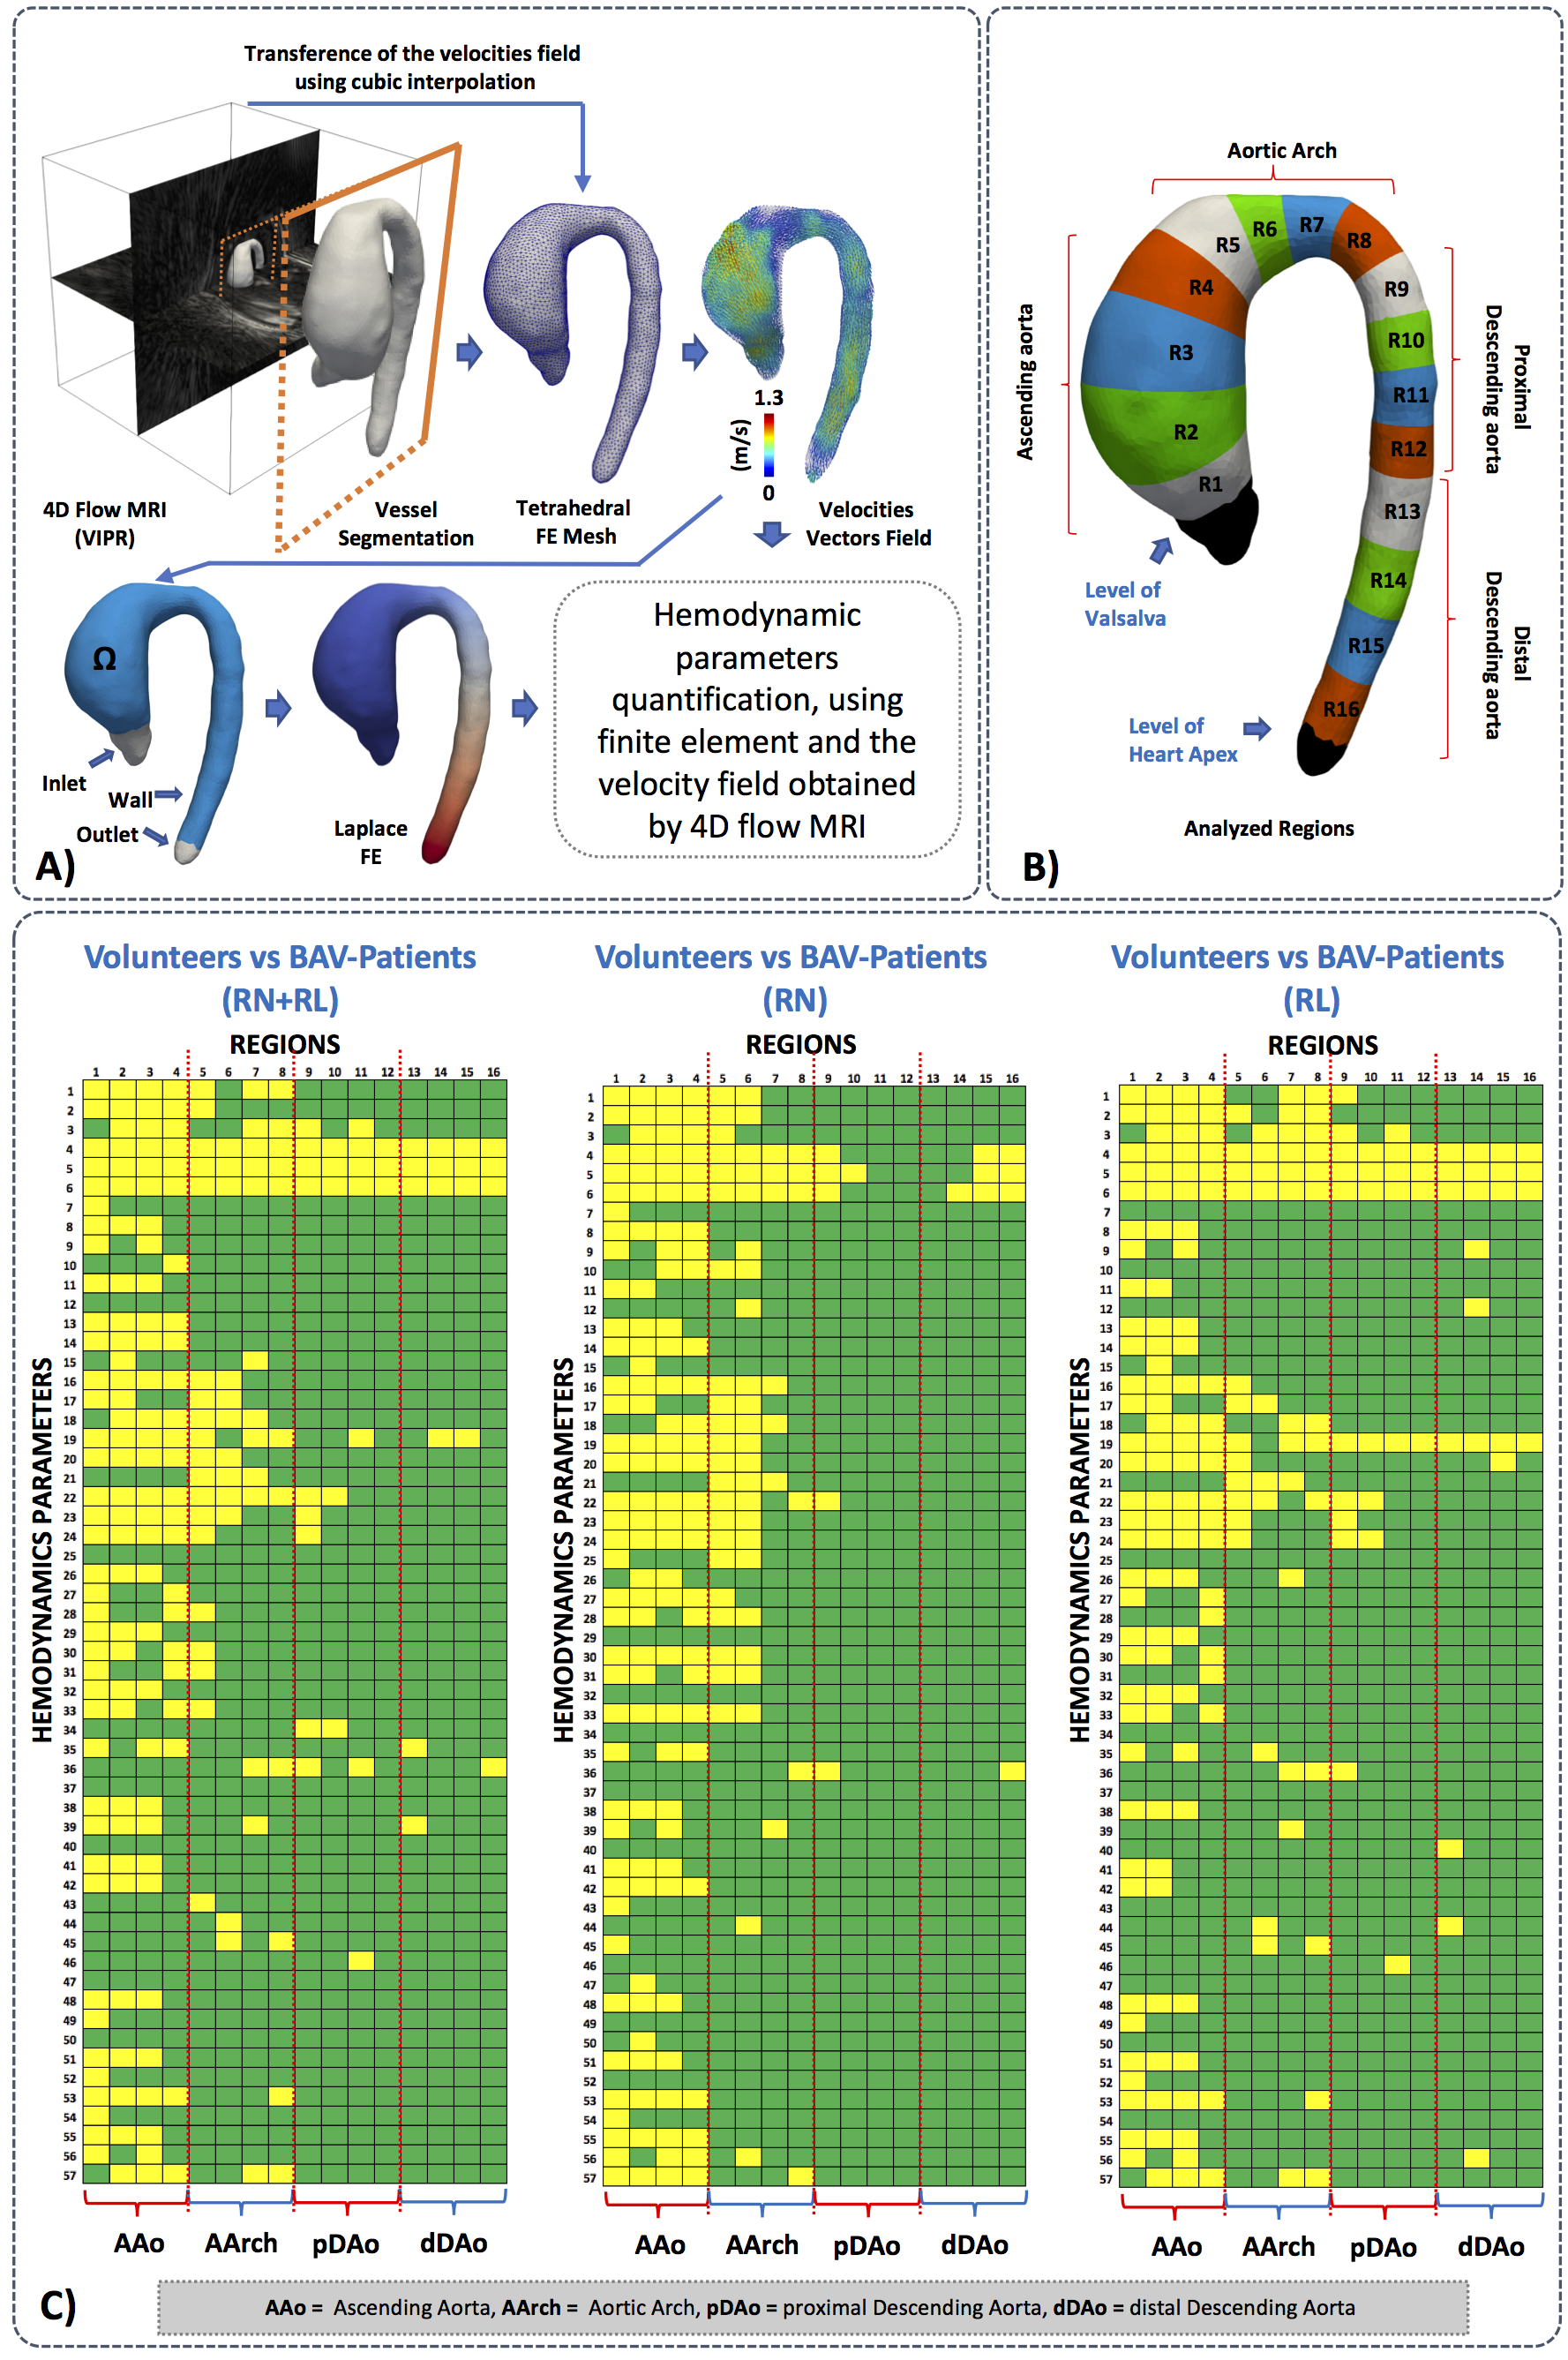
We obtained the velocity gradient from 4D-flow using a finite-element least-squares projection method previously published14,15 in three orthogonal directions, generating continuous 3D maps of different HP and diameter as described in Figure1. A total of 14 healthy volunteers and 49 BAV-patients were included in the study Figure2. The 4D-flow data was acquired at Hospital Universitari Vall d´Hebron with a 1.5T GE-MR Signa Scanner and using the VIPR technique16. The process for creating the tetrahedral mesh is summarized in Figure3a and was performed in Matlab (MathWorks, Natick, MA, USA) using the iso2mesh toolbox. Our finite element algorithm is programmed in the software Python (PSF, Wolfeboro Falls, USA) and for visualization we used the software Paraview (Kitware Inc., NY, USA). Sixteen different regions were analyzed for each volunteer and BAV patient Figure3b. In all these regions, we analyzed the mean, maximum and minimum values of HP at peak systole. The normal distribution of each data was studied using the Lilliefors test. Results between patients and volunteers were compared using a t-student test for normally-distributed data, and a wilcoxon test for data with non-normal distributions. Also, a linear regression analysis was carried out to assess correlation between all the HP calculated in the ascending aorta (AAo), aortic arch (AArch), proximal descending aorta (pDAo) and distal descending aorta (dDAo).Results
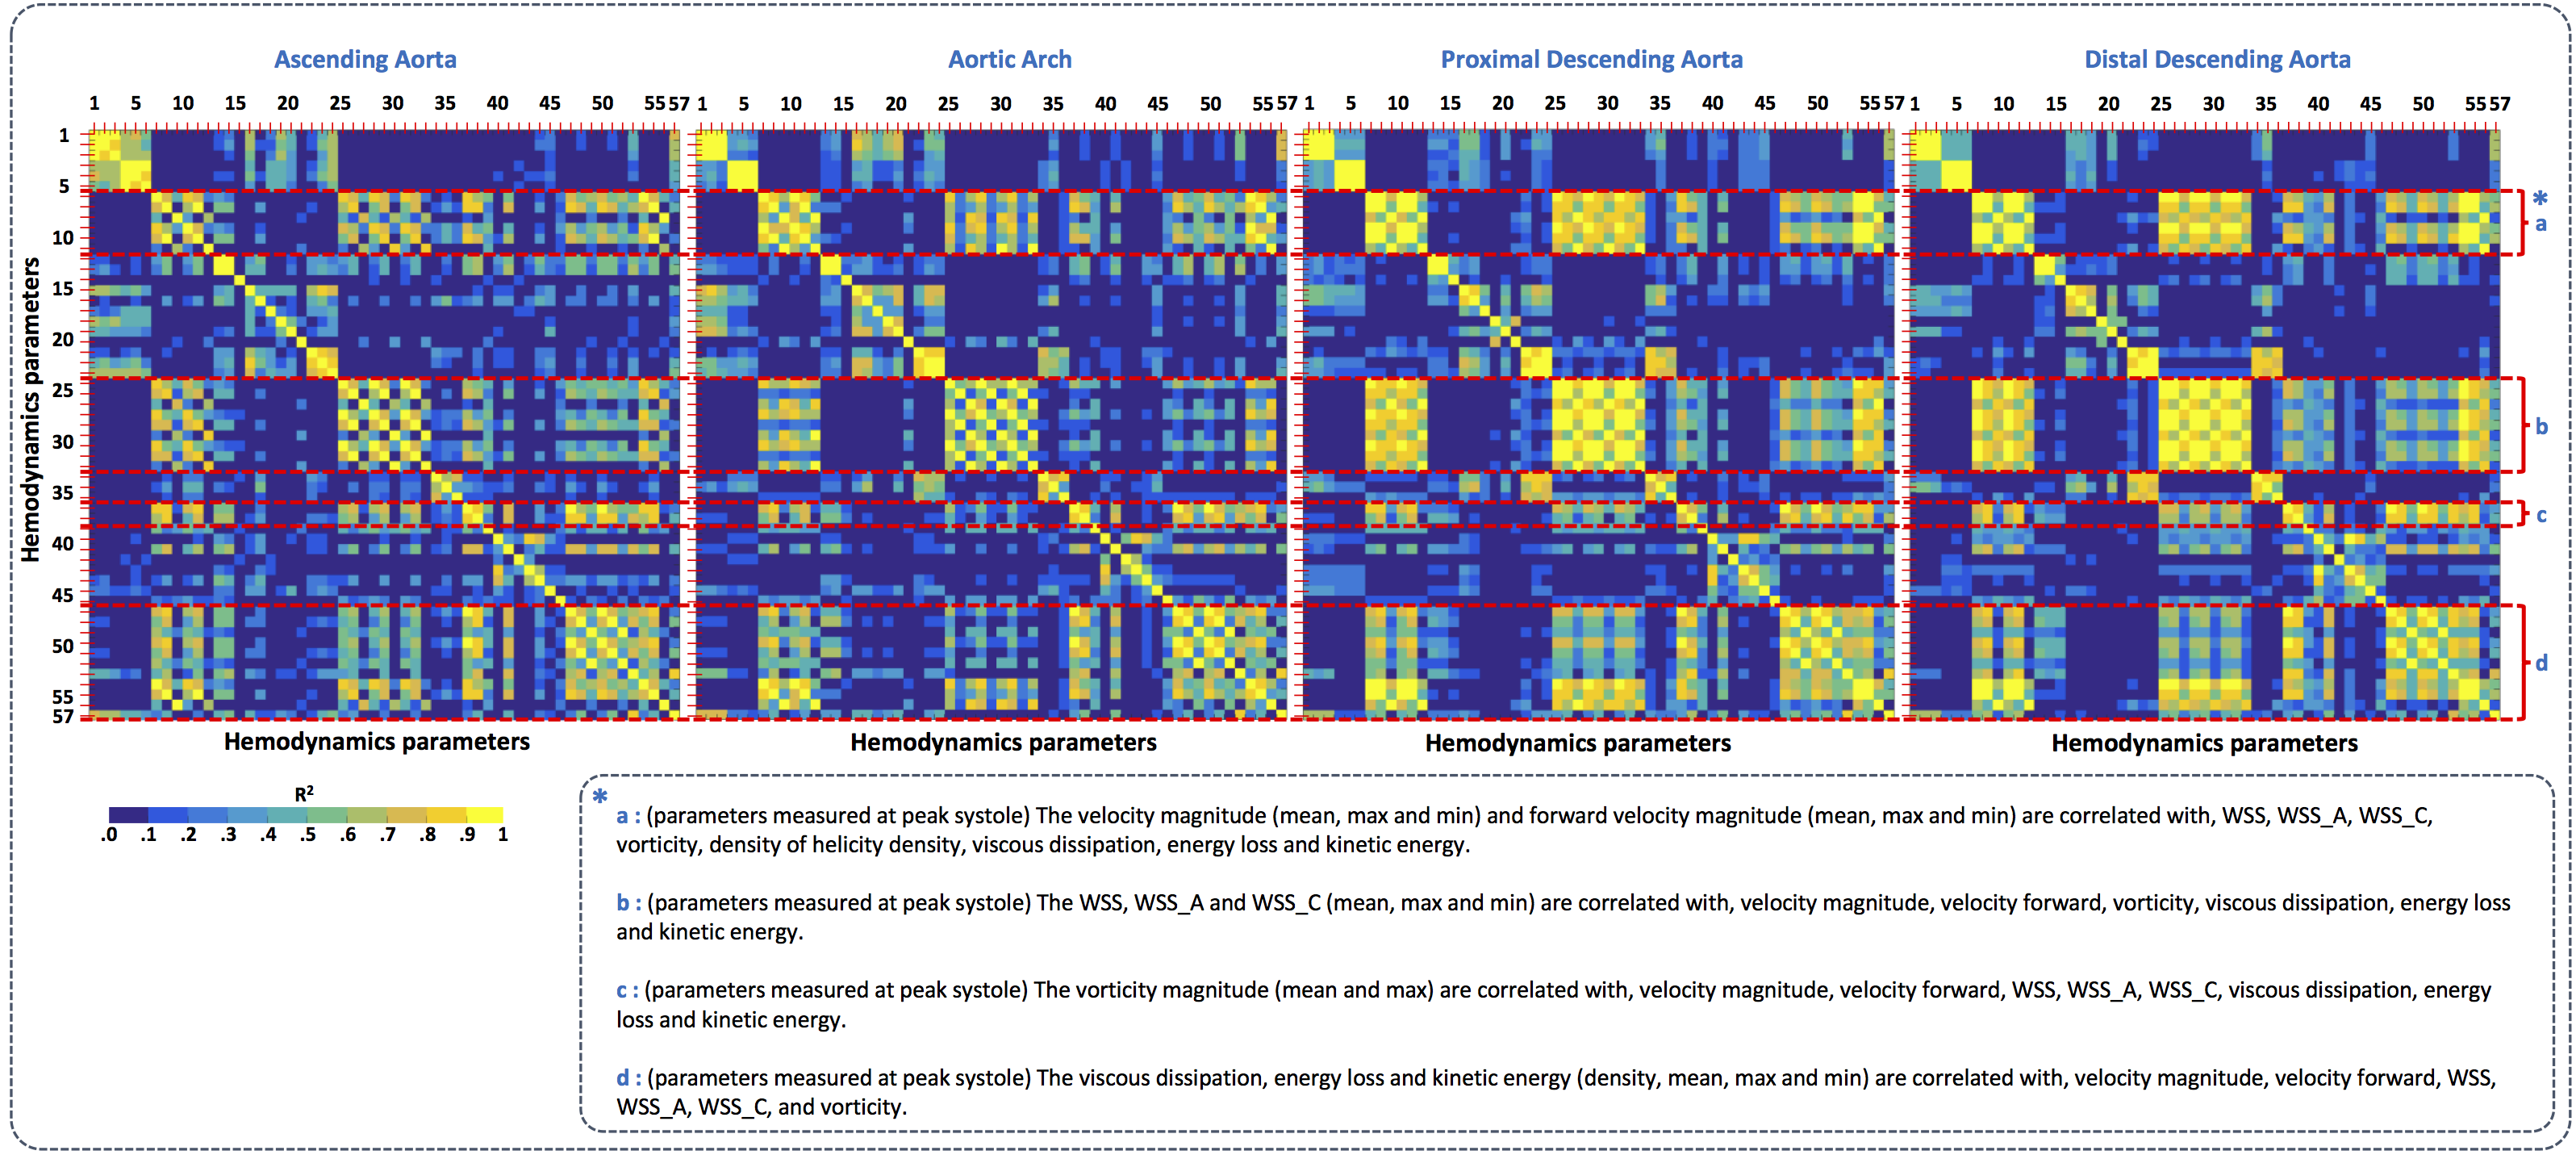
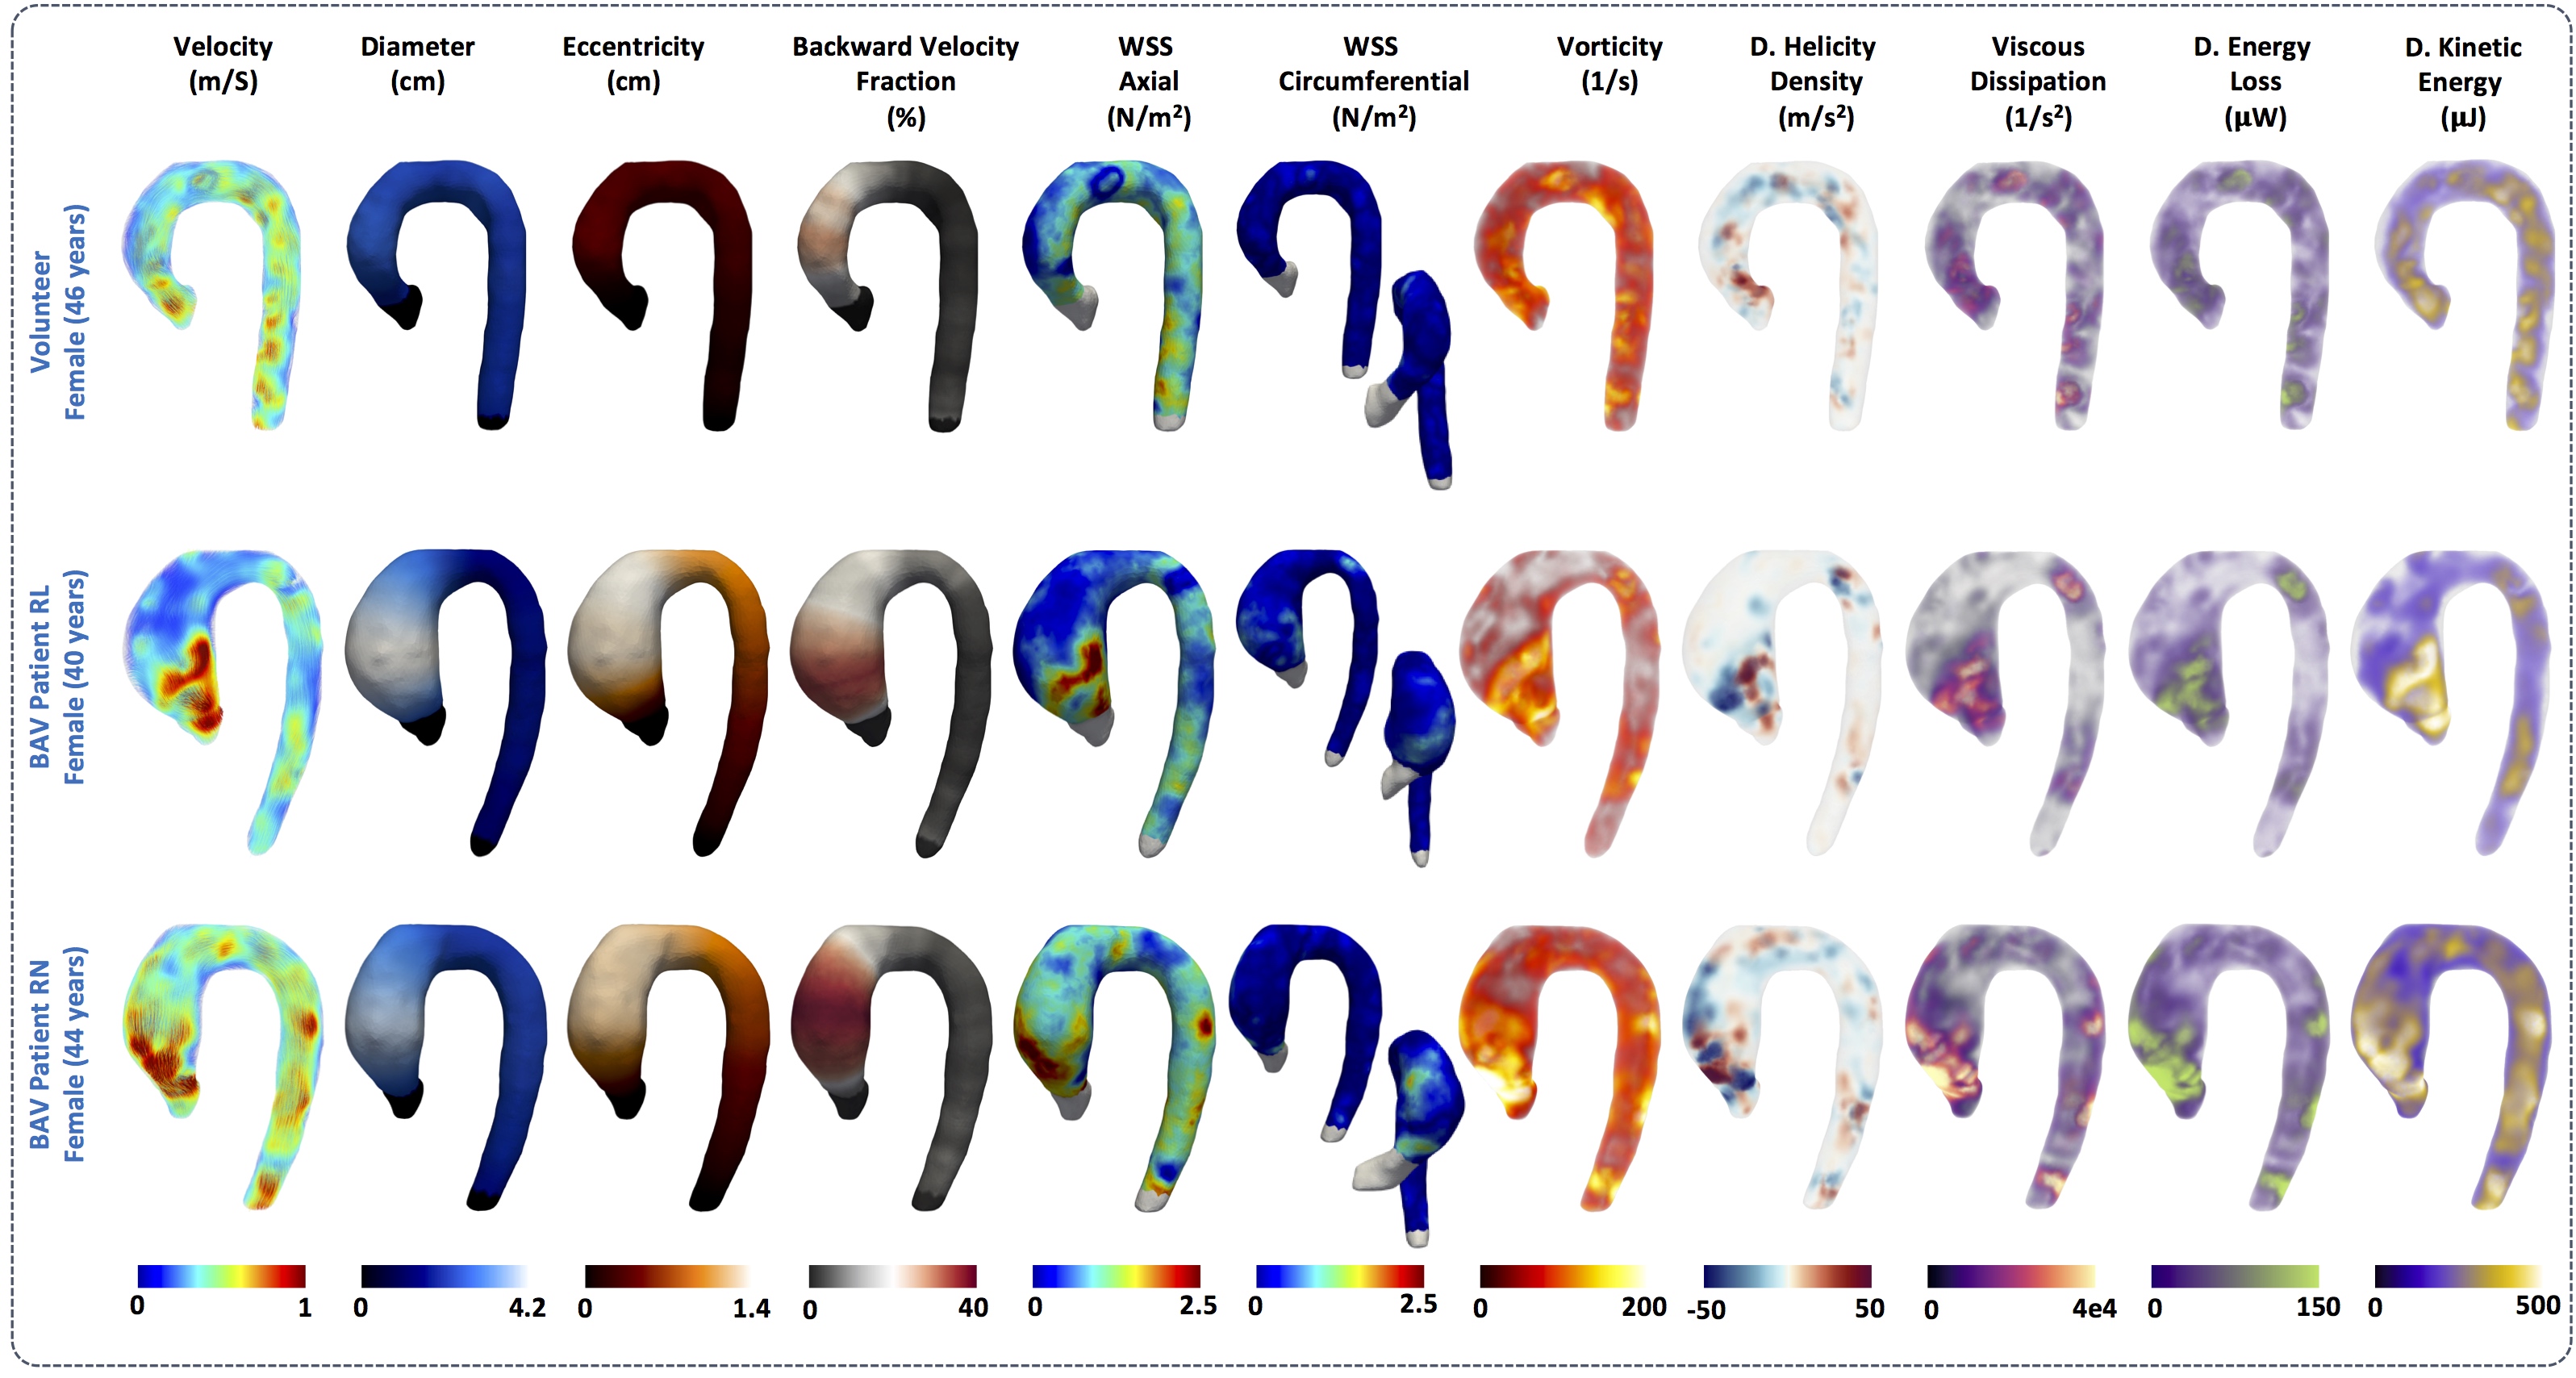
In Figure3c we observe statistical significant differences (p<0.05) between healthy volunteers and BAV-patients (yellow box) among all HP and diameter (Figure1). We observed that the HP in the regions of the AAo (Regions1-4) and the anterior part of the AArch (Regions5-6) showed more significant differences between volunteers and BAV-patients (RN+RL,RL,RN), compared to other regions. The parameter with more differential regions, between volunteers and BAV patients was the eccentricity (HP 4-6). Patients with RL phenotype, present significant differences in the circumferential direction of the flow (HP 19) in comparison with RN patients. Also, patients with RL shows significant differences in the diameter in more regions of the AAo and part of the AArch (HP 1-3) in comparison with RN patients, that only present in the ascending aorta regions. In Figure4 we present the correlation matrix (R2), obtained by the linear regression between all HP of patients, for all regions. We observe four remarkable sections (a,b,c,d) of HP in this matrix. Nevertheless, among those parameters only the kinetic energy had a good correlation with the diameter in the AAo. Figure5 shows the 3D maps of 10 relevant HP analyzed in this study, for one representative volunteer, two BAV-patient with phenotypes RL and RN respectively.Discussion and conclusion
We present a method that allowed us to obtain several 3D maps of different HP derived from a single 4D-flow data set. The great advantage of the proposed approach is that from a single segmentation of the 4D-flow data we can obtain several quantitative HP along the entire aorta. Parameters such as WSS, vorticity, viscous dissipation, energy loss and kinetic energy were highly correlated in this cohort of patients (R2>0.7). However, the eccentricity, the mean angle in axial direction, the mean backward flow fraction and the kinetic energy were the only parameters correlated with the aortic diameter (R2>0.6) in the ascending aorta. Longitudinal studies may consider all those parameters to evaluate the risk factors on BAV patients. In conclusion, the methodology present here represents an advanced hemodynamic description that may help to improve BAV patient’s management.Acknowledgements
Thank to grant, CONICYT - PIA - Anillo ACT1416, CONICYT FONDEF/I Concurso IDeA en dos etapas ID15|10284, and FONDECYT #1141036. Guala A. has received funding from the European Union Seventh Framework Programme FP7/People under grant agreement n° 267128. Sotelo J. acknowledges to FONDECYT Postdoctorado 2017 #3170737References
1. Ward C. Clinical significance of the bicuspid aortic valve. Heart 2000;83:81–5.
2. Siu SC, Silversides CK. Bicuspid aortic valve disease. J Am Coll Cardiol 2010;22;55(25):2789-800.
3. Asch FM, Yuriditsky E, Prakash SK, et al. The Need for Standardized Methods for Measuring the Aorta: Multimodality Core Lab Experience From the GenTAC Registry. JACC Cardiovasc Imaging. 2016;9(3):219-26.
4. Cavalcante JL, Lalude OO, Schoenhagen P, Lerakis S. Cardiovascular Magnetic Resonance Imaging for Structural and Valvular Heart Disease Interventions. JACC Cardiovasc Interv. 2016;14;9(5):399-425.
5. Hassanabad AF, Barker AJ, Guzzardi D, et al. Evolution of Precision Medicine and Surgical Strategies for Bicuspid Aortic Valve-Associated Aortopathy. Front Physiol. 2017; 8: 475.
6. Allen BD, van Ooij P, Barker AJ, et al. Thoracic aorta 3D hemodynamics in pediatric and young adult patients with bicuspid aortic valve. J Magn Reson Imaging. 2015;42(4):954-63.
7. Hope MD, Hope TA, Meadows AK, et al. Bicuspid aortic valve: four- dimensional MR evaluation of ascending aortic systolic flow patterns. Radiology 2010;255:53–61.
8. Bissell MM, Hess AT, Biasiolli L, et al. Aortic dilation in bicuspid aortic valve disease: flow pattern is a major contributor and differs with valve fusion type. Circ Cardiovasc Imaging 2013;6:499–507.
9. Saikrishnan N, Mirabella L, Yoganathan AP. Bicuspid aortic valves are associated with increased wall and turbulence shear stress levels compared to trileaflet aortic valves. Biomech Model Mechanobiol. 2015;14(3):577-88.
10. Barker AJ, van Ooij P, Bandi K, et al. Viscous energy loss in the presence of abnormal aortic flow. Magn Reson Med. 2014;72(3):620-8.
11. Binter C, Gülan U, Holzner M, Kozerke S. On the accuracy of viscous and turbulent loss quantification in stenotic aortic flow using phase-contrastMRI. Magn Reson Med. 2016;76(1):191-6.
12. van Ooij P, Garcia J, Potters WV, et al. Age-related changes in aortic 3D blood flow velocities and wall shear stress: Implications for the identification of altered hemodynamics in patients with aortic valve disease. J Magn Reson Imaging. 2016;43(5):1239-49.
13. Garcia J, Barker AJ, Collins JD, et al. Volumetric quantification of absolute local normalized helicity in patients with bicuspid aortic valve and aortic dilatation. Magn Reson Med. 2017;78(2):689-701.
14. Sotelo J, Urbina J, Valverde I, et al. 3D Quantification of Wall Shear Stress and Oscillatory Shear Index Using a Finite-Element Method in 3D CINE PC-MRI Data of the Thoracic Aorta. IEEE Trans Med Imaging. 2016;35(6):1475-87.
15. Sotelo J, Dux-Santoy L, Guala A, et al. 3D axial and circumferential wall shear stress from 4D flow MRI data using a finite element method and a laplacian approach. Magn Reson Med 2017;0:0-0
16. Gu T, Korosec FR, Block WF, et al. PC VIPR: a high-speed 3D phase-contrast method for flow quantification and high-resolution angiography. AJNR Am J Neuroradiol. 2005;26(4):743-9.
17. Sotelo J, Urbina J, Valverde I, et al. Three-dimensional quantification of vorticity and helicity from 3D cine PC-MRI using finite-element interpolations. Magn Reson Med. 2017;0:0-0
Figures