0682
Repeatability of 2D FISP MR Fingerprinting in the Brain at 1.5T and 3.0 T1IMAGO7 Foundation, Pisa, Italy, 2National Institute for Nuclear Physics, Pisa, Italy, 3IRCCS Fondazione Stella Maris, Pisa, Italy, 4Unit of Neuroradiology, AOUP, Pisa, Italy, 5Department of Translational Research and New Technologies in Medicine and Surgery, University of Pisa, Pisa, Italy, 6Department of Computer Science, Technische Universitat Munchen, Munich, Germany, 7GE Healthcare, Munich, Germany, 8Cancer Research UK Cambridge Institute, University of Cambridge, UK, Cambridge, United Kingdom, 9Department of Radiology, University of Cambridge, Cambridge, United Kingdom
Synopsis
MR Fingerprinting is a new multi-contrast imaging method that is appealing for its ability to acquire multiple quantitative maps efficiently when compared to other repeated acquisitions varying a single parameter at a time. This work shows our first demonstration of MRF in vivo repeatability through test/re-test imaging of seven healthy human volunteers at 1.5T and 3.0T. We found the group root-mean-square-difference (NRMSD) of MRF-SSFP T1 measurements to be 5-6% in grey and white matter at 1.5T and 4-5% at 3.0T, T2 NRMSD to be 6-9% at 1.5T and 11-13% at 3.0T, and PD NRMSD to be 2-3% at 1.5T and 2-3% at 3.0T.
Purpose:
Magnetic Resonance Fingerprinting (MRF) is a novel method that efficiently samples the transient state of the MRI signal. MRF is appealing due to its ability to acquire multiple quantitative maps efficiently when compared to other repeated acquisitions varying only a single parameter. However, in order to be validated and thus adopted clinically, the repeatability of quantitative MRF measurements must be confirmed. Published studies have shown a high repeatability of T1 and T2 values by MR Fingerprinting in the ISMRM/NIST phantom1. In order to confirm the repeatability of MRF in vivo, our study has acquired test/re-test data in the human brain at 1.5T and 3.0T.Methods:
MRF data were acquired on a 1.5T and a 3.0T MRI system (respectively HDxt and MR750 GE Healthcare, Waukesha, WI, USA), each equipped with an 8-channel dedicated brain coil. With local ethical approval, 7 healthy human subjects were imaged in two identical sessions per scanner, each including a 1mm-isotropic 3D fast spoiled gradient echo (FSPGR), and 2D steady-state free precession MRF2. Subjects were removed from the scanner between imaging sessions. The MRF acquisition trajectories used 89 undersampled golden-angle spiral interleaves with FOV = 256mm, matrix = 128x128, sampling bandwidth = ±250kHz, TE = 2.2ms. The scan parameters matched the repetition time and flip angle list from Jiang et al 2. We used 979 frames and 1 NEX per slice. The spirals were rewound and followed by a spoiler z-gradient achieving 8 dephasing through a 2mm slice. Three-dimensional volumes were reconstructed at 2mm isotropic resolution. The maximum gradient amplitude was 20mT/m and slew rate was 50T/m/s. MRF maps were obtained by inner-product pattern matching and the MRF dictionary was computed using the extended phase graphs formalism3; B0 and B1 were not included in the dictionary but slice profile was included to improve T2 accuracy4.
Analysis: M0 values were reported both un-normalised and self-normalised to the average inside the brain mask (here, we called normalised M0 data PDn). MRF maps for every test were rigidly co-registered to their respective re-test using Statistical Parametric Mapping (SPM 12) Toolbox. After registration, each subject’s volumetric image was warped to match a custom DARTEL atlas based on the subjects studied (the 3D FSPGR from the first test at 3T was used to estimate the transformation). After applying 6mm gaussian smoothing, the root mean square differences (RMSD) were calculated between each voxel in test and retest measurements, and voxel-wise normalized to the group average (NRMSD). For each subject, the segmented tissue probability maps were calculated and used to extract mean values of parameters in grey matter (GM), white matter (WM) and cerebrospinal fluid (CSF). A threshold of 50% probability was used as a mask per each tissue
Results:
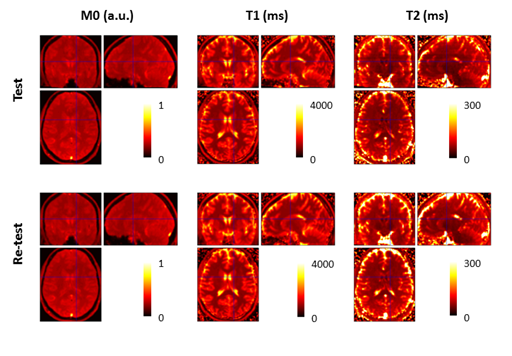
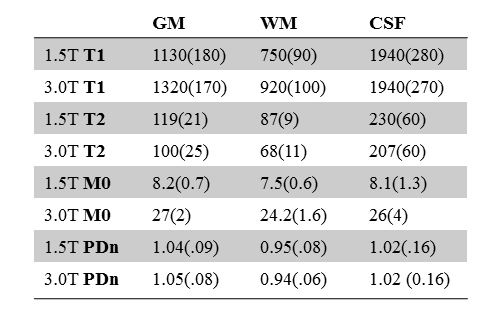
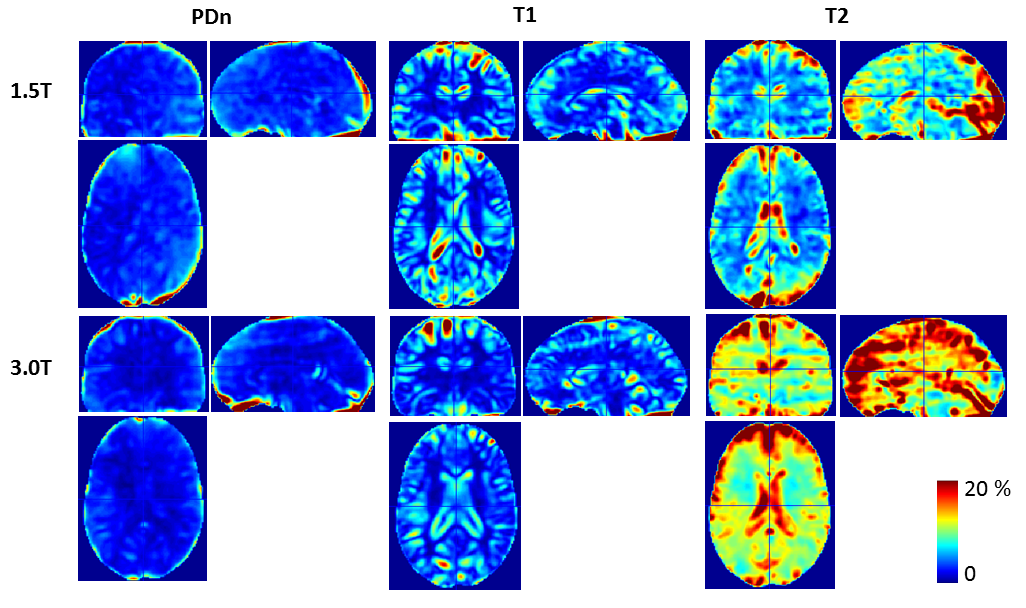
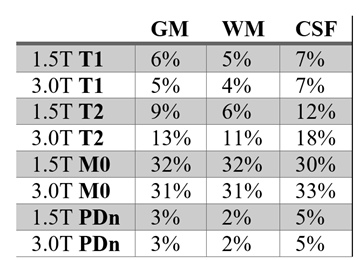
Sample co-registered MRF images are shown in Figure 1. Average values for T1, T2 and M0 are reported in Table 1. CSF T2 values were not uniform and had values below 100ms in some locations, possibly due to the high diffusion sensitivity of the spoiler gradients used to de-phase 2mm slices. NRMSD between test and re-test are shown in Figure 2, while values for each tissue class are reported in Table 2. While T1 repeatability was comparable between 1.5T and 3T, T2 repeatability was better at 1.5T than 3.0T.Discussion:
The fast MRF acquisitions produced repeatable values. The obtained reproducibility ranges were comparable to the values reported in phantoms1 for T1, while our T2 repeatability was worse, especially at 3.0T. The low T2 values in CSF measured here may be due the effects of diffusion introduced by the high spoiler gradients required to dephase thin slices2. The higher variation of un-normalised M0 with respect to relaxation times is due to arbitrary scaling of the images, which would not affect the values of the T1 or T2 maps. However, after normalisation to the brain average, the NRMSD was reduced from 30% to 3%. While this study is a single confirmation of test/retest repeatability, further confirmations should be done across multiple scanner types in order to validate the MRF for longitudinal imaging of disease and therapy.Conclusion:
We have reported a first account of our test/re-test repeatability when using MRF in the healthy human brain at 1.5T and 3.0T. Our test-retest reproducibility was around 5% for T1 and around 10% for T2 values, M0 reproducibility was around 3% once normalised. This result further encourages study of MR Fingerprinting repeatability for adoption in multi-centre longitudinal assessments of disease and treatment.Acknowledgements
We acknowledge Horizon2020 656937, INFN CNSV, GlaxoSmithKline, the Royal Society, Cambridge Research UK, Addenbrooke's Charitable Trust, and NIHR comprehensive Biomedical Research Centre for fundingReferences
1. Yun Jiang, Dan Ma, Kathryn E. Keenan, Karl F. Stupic, Vikas Gulani, Mark A. Griswold. Repeatability of magnetic resonance fingerprinting T1 and T2 estimates assessed using the ISMRM/NIST MRI system phantom. Magn. Reson. Med. 2016. Doi: 10.1002/mrm.26509;
2. Jiang Y, Ma D, Seiberlich N, Gulani V, Griswold MA. MR fingerprinting using fast imaging with steady state precession (FISP) with spiral readout. Magn Reson Med 2015;74:1621–1631
3. Weigel M. Extended phase graphs: dephasing, RF pulses, and echoes - pure and simple. J Magn Reson Imaging2015;41:266–295.
4. Buonincontri, G., Sawiak, S.J., 2016. MR fingerprinting with simultaneous B1 estimation. Magn. Reson. Med. 76, 1127–1135. http://dx.doi.org/10.1002/mrm.26009
Figures