0681
Water-Fat Separation in Spiral Magnetic Resonance Fingerprinting using Conjugate Phase Reconstruction1Radiology, Leiden University Medical Center, Leiden, Netherlands, 2Philips Research Hamburg, Hamburg, Germany
Synopsis
Water-fat separation can improve the quality of tissue parameter maps in quantitative imaging methods such as Magnetic Resonance Fingerprinting (MRF). We propose such a technique that uses the B0 map as prior information for spiral off-resonance correction through conjugate phase reconstruction, enabling efficient water-fat separation with only two echo points per frame, implemented in a single run MRF approach. With this technique, accurate tissue parameter maps can be produced in the presence of fat.
Introduction
Quantitative imaging is becoming increasingly important in muscle diseases such as Duchenne Muscular Dystrophy (DMD), where diseased muscle is replaced by fat1. The presence of fat and its bright appearance has led to several fat suppression techniques2, but standard techniques often result in insufficient accuracy for T2 mapping3. Moreover, fat contains also valuable information about the health of a muscle. In the Magnetic Resonance Fingerprinting4 (MRF) framework water and fat can be separated to find reliable tissue parameter estimates at the same time. Previous work showed how this can be performed using three or more different echo times5,6. In this work we use the B0 field map as prior knowledge for MRF encoding with water-fat separation using only two different echo times in a single run. Such an approach allows efficient, longer read-out, spiral sampling, reducing spiral artifacts via conjugate phase reconstruction7,8 (CPR).Methods
Experiments were performed on healthy volunteers with informed consent obtained, using an Ingenia 3T dual transmit MR system (Philips Healthcare) equipped with a 16-channel coil for reception in the calf.
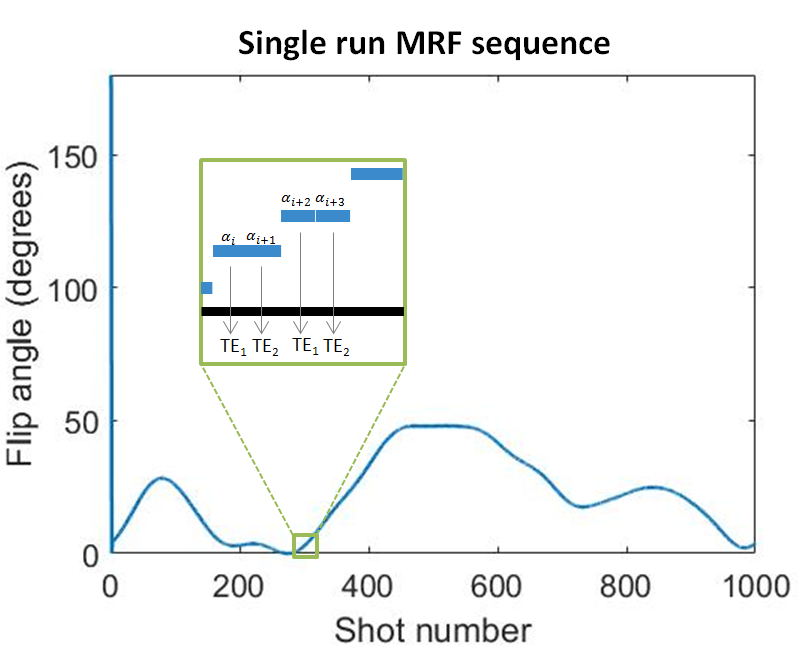
Fingerprinting definition: A pattern of 1000 flip angles (0°-48°) designed by Sommer9, was used preceded by an inversion pulse10 (Fig.1). The TEs were chosen alternating between 3.45 ms and 2.30 ms, with constant flip angle for alternating TE, allowing two-point water-fat separation within the MRF train. The TR/RF-phase was fixed to 15 ms/0°. The sequence was not optimized for B1+ sensitivity.
Data acquisition: MRF data was acquired using a spiral sampling scheme in a spoiled SSFP sequence with the following scan parameters: FOV 230x230 mm2, resolution 1.31x1.31x10.0 mm3, 8ms spiral read-out window (TA) satisfying Nyquist sampling with 20 interleaves (1 acquired) and scan time of 21 s. CPR was applied in an identical manner for each image frame after Roemer coil combination11, correcting for the spatially varying B0 inhomogeneity, but during spiral sampling only, so that the signal equation after this is written as12 $$$ S= [W+Fe^{i\gamma B_0 \sigma(\text{TE}+\text{TA})} ] e^{i\gamma\Delta B_0 \text{TE}}$$$.
Initial processing: In pre-processing an additional demodulation is applied to correct for the exponential term $$$e^{i\gamma\Delta B_0 \text{TE}}$$$, after which water and fat parts were separated within each TE pair. The individual fat images were deblurred using an offline algorithm that corrects for the fixed fat chemical shift (σ) with respect to water, using the spiral k-space trajectory.
Dictionary and Matching: The dictionary was calculated using the extended phase graph formalism13. 90234 signal evolutions were simulated with T1 and T2 values ranging from 40-4000 ms and 10-400 ms, respectively, and a B1+ fraction ranging from 0.6-1.0. Finally, separated water and deblurred fat signal evolutions were matched to the dictionary elements to produce T1, T2 and M0 maps.
Results
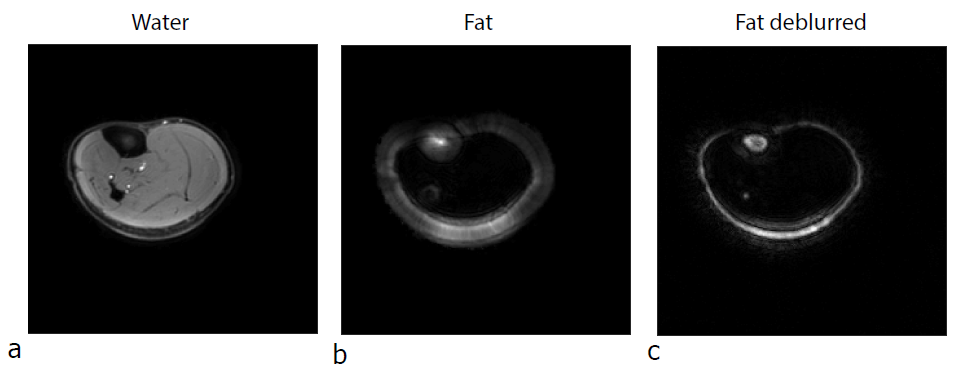
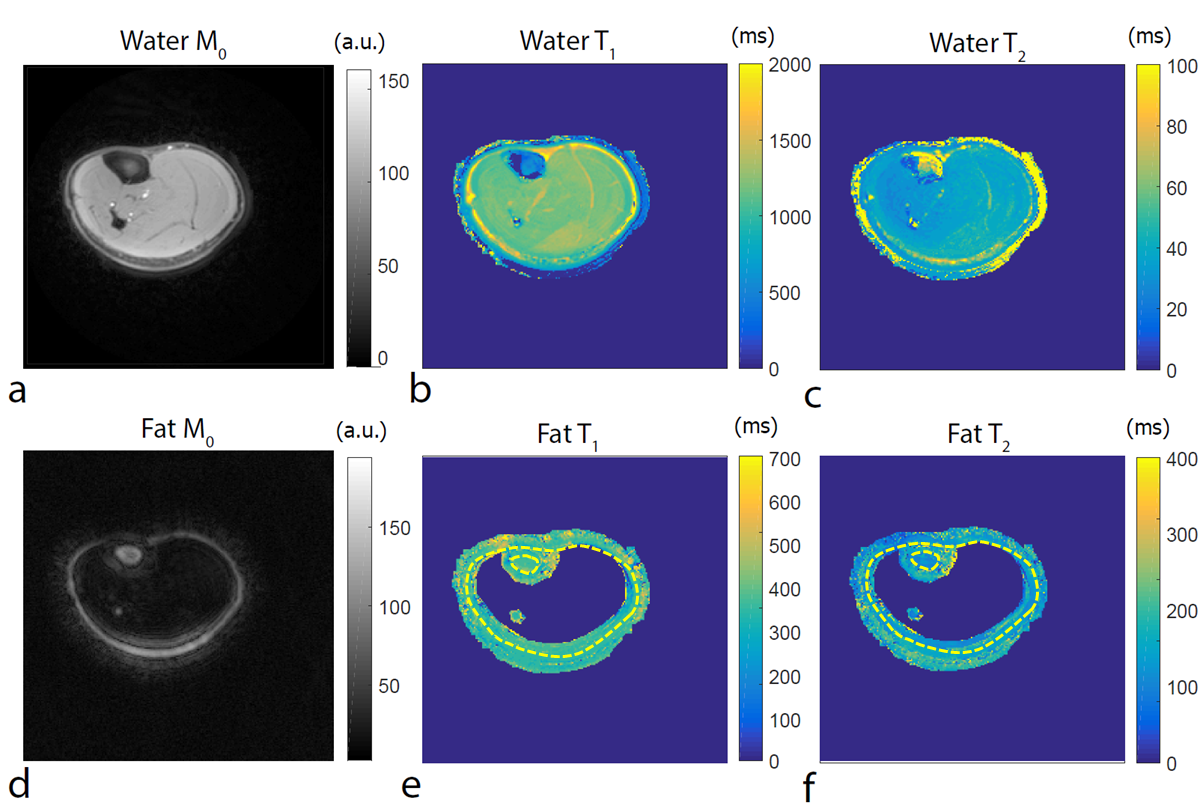
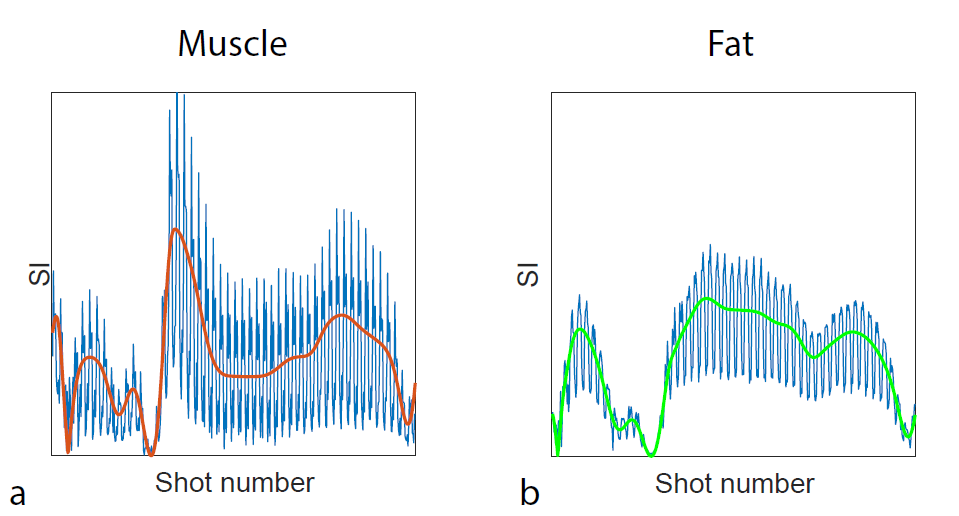
Figure 2 shows the sum over all water and fat images after separation within the MRF train. The sum over the fat images indicates that the individual fat images are seriously blurred due to chemical shift, and Fig. 2c shows the offline deblurring result. The corresponding M0 maps for water and fat are presented in Fig. 3, together with the T1 and T2 maps matched from the water signal in Fig. 3b and 3c, respectively. The maps for the fat (Fig. 3e and 3f) clearly show remaining blurring due to imperfect corrections. Average T1/T2 values for muscle are 1202/39 ms and T1/T2 values for fat are 349/163 ms, corresponding well with literature14. Typical signal matches for muscle and fat are shown in Fig. 4.Discussion
The proposed technique shows sharp results for the water part, while the fat part contains some remaining off-resonance artifacts after the deblurring procedure, to be addressed in future work to sopport the clinical application. Improvements are expected if CPR is applied before coil combination, also to minimize the effect of any applied correction filters. Additionally, B0 estimation from the unprocessed data would allow an offline CPR implementation that may lead to a more precise water-fat separation before doing the actual matching, which can be accelerated by dictionary and data compression. This, in combination with further adaptions of the MRF challenge, can lead to an approach for fast T1/T2 mapping during muscle exercise, in which only a short time window is available for data acquisition. This can help to get more insight into the mechanisms and progression of muscle degenerative diseases.Conclusion
Water-fat separation including CPR is possible within a single MRF scan, to provide tissue parameter maps in which the blurred fat signal is removed, while the sensitivity of the MRF sequence is maintained. Further work is needed to increase the accuracy of the water-fat separation and in this way improve the tissue parameter maps for the fat signal.Acknowledgements
This project was funded by the European Research Council Advanced Grant 670629 NOMA MRI.References
- Hooijmans M et al. Spatially localized phosphorous metabolism of skeletal muscle in Duchenne muscular dystrophy patients: 24-month follow-up. Public Library of Science one. 2017;12(8).
- Emmanuelle M et al. Fat Suppression in MR Imaging: Techniques and Pitfalls. RadioGraphics. 1999;19:373-382.
- Wokke B et al. T2 relaxation times are increased in Skeletal muscle of DMD but not BMD patients. Muscle & Nerve. 2016;53(1):38-43.
- Ma D et al. Magnetic Resonance Fingerprinting. Nature. 2013;495:187-192.
- Ostenson J et al. Fat Signal Fraction Determination Using MR Fingerprinting. Proc. Intl. Soc. Mag. Reson. Med. 2017; 0134.
- Ostenson J et al. MR Fingerprinting Fat-Water Signal Separation in k-space. Workshop on Magnetic Resonance Fingerprinting. 2017:22.
- Ostenson J et al. Multi-Frequency Interpolation in Spiral Magnetic Resonance Fingerprinting for Correction of Off-Resonance Blurring. Magnetic Resonance Imaging. 2017;41: 63–72.
- Koken P et al. Improving Accuracy in MR Fingerprinting by Off-Resonance Deblurring. Proc. Intl. Soc. Mag. Reson. Med. 2017:5067.
- Sommer K et al. Towards predicting the encoding capability of MR fingerprinting sequences. Magnetic Resonance Imaging. 2017; 41:7-14.
- Jiang Y et al. MR Fingerprinting Using Fast Imaging with Steady State Precession (FISP) with Spiral Readout. Magnetic Resonance in Medicine. 2015;74:1621-1631.
- Roemer P et al. The NMR phased array. Magnetic Resonance in Medicine. 1990;16:192-225.
- Ma J et al. Dixon Techniques for Water and Fat Imaging. Journal of Magnetic Resonance Imaging. 2008; 28:543-558.
- Scheffler K. A pictorial Description of Steady-States in Rapid Magnetic Resonance Imaging. Concepts in Magnetic Resonance. 1999;11(5):291-304.
- Gold G et al. Musculoskeletal MRI at 3.0T: Relaxation Times and Image Contrast. American Journal of Roentgenology. 2004;183:343-351.
Figures